Serendipitous ALMA detection of
a distant CO-emitting galaxy
with
a buried active galactic nucleus beyond
the nearby merging galaxies VV114
Abstract
We report the detection of a distant star-forming galaxy, ALMA J010748.3173028, which is identified by a 13 emission line at 99.75 GHz ( Jy km s-1), behind the nearby merging galaxies VV114 using the Atacama Large Millimeter/submillimeter Array (ALMA) Band 3. We also find an 880- counterpart with ALMA Band 7 ( mJy). A careful comparison of the intensities of the line and the continuum suggests that the line is a redshifted 12CO transition. A photometric redshift analysis using the infrared to radio data favors a CO redshift of , although is acceptable. We also find a hard X-ray counterpart, suggesting the presence of a luminous ( erg s-1) active galactic nucleus obscured by a large hydrogen column ( cm-2 if ). A cosmological simulation shows that the chance detection rate of a CO-emitting galaxy at with Jy km s-1 is per single ALMA field of view and 7.5-GHz bandwidth at 99.75 GHz. This demonstrates that ALMA has sufficient sensitivity to find an emission-line galaxy such as ALMA J010748.3173028 even by chance, although the likelihood of stumbling across such a source is not high.
Subject headings:
galaxies: formation — galaxies: starburst — quasars: general — submillimeter: galaxies — X-rays: galaxies1. Introduction
In recent years, the advent of new millimeter (mm) and submillimeter (submm) facilities, such as the Atacama Large Millimeter/submillimeter Array (ALMA), with unprecedented sensitivity and frequency coverage, has improved the detectability of cool gas in high-redshift star-forming galaxies (e.g., Wagg et al., 2012; Vieira et al., 2013; Wang et al., 2013). Swinbank et al. (2012) reported two chance detections of submm galaxies (SMGs, Blain et al., 2002, for a review) in [C ii] 158- line emission during 870- continuum follow-up observations of 126 SMGs using ALMA, which places the first constraint on the [C ii] luminosity function at . Furthermore, Hatsukade et al. (2013) made the deepest unlensed number counts of SMGs using sources incidentally detected in the same fields of view (FoVs) toward near-infrared-selected star-forming galaxies at . Such “incidental” searches for high- star-forming galaxies, especially in emission lines, offer a unique opportunity to investigate the line luminosity functions or cool gas mass functions, which are important for constraining galaxy formation models.
Here we report the serendipitous detection of a dusty starburst galaxy, ALMA J010748.3173028 (hereafter ALMA-J0107), with a significant emission line at 99.75 GHz, which is likely a redshifted 12CO line. At this position, we find a hard X-ray source, which strongly suggests the presence of a buried active galactic nucleus (AGN).
We assume a cosmology with , , and km s-1 Mpc-1 ().
2. ALMA Observations and Results
ALMA 3-mm and 880- observations toward VV114 (program ID: 2011.0.00467.S) were conducted using the compact configuration in November 2011 and the extended configuration in May 2012 (3-mm observation only). The correlator was configured to cover 98.53–102.35 GHz/110.77–113.90 GHz (3 mm) and 323.51–327.25 GHz/335.68–339.31 GHz (880 ) with a 0.488 MHz resolution. The 3-mm and 880- primary beam sizes are and , respectively; for the 880- observations, we mosaicked seven pointings to compensate for the small FoV of Band 7. At both 3 mm and 880 , Uranus, J1924292, and J0132169 ( away from VV114) were used to calibrate the absolute flux, bandpass, and complex gain, respectively. We used casa (McMullin et al., 2007) to calibrate the visibility data and to image them with a robust weighting of 0.5. Note that we made the continuum images using only spectral channels that are free from 12CO emission from VV114, which leaves 6.7-GHz and 6.6-GHz bandwidths at 3 mm and 880 , respectively. We cleaned the resulting dirty images down to the 1 level. The synthesized beam sizes at 3 mm and 880 are (PA = ) and (PA = ), respectively. The resulting rms noise levels at 3 mm before correcting for primary beam attenuation were 0.92 mJy beam-1 for a cube with a resolution of 30 km s-1 and 50 Jy beam-1 for the continuum image. The 880- noise levels for a 30 km s-1 resolution cube and continuum are 1.5 mJy beam-1 and 0.11 mJy beam-1, respectively. The flux calibration accuracies in both bands are estimated to be 10%.
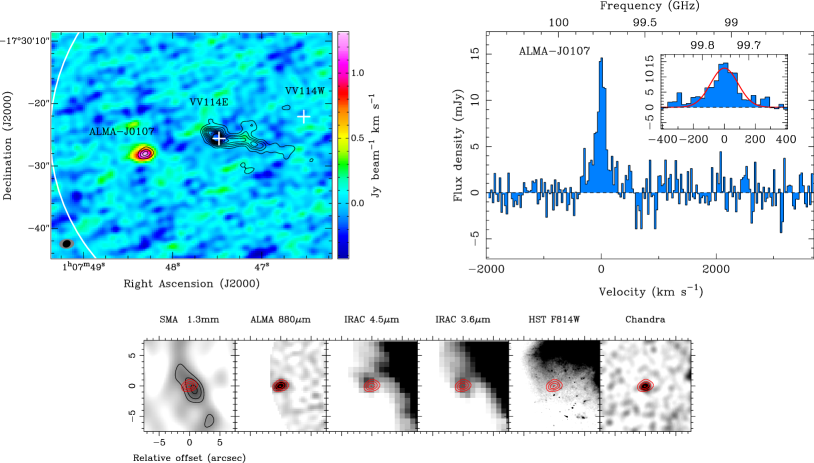
We serendipitously detect a 13 line-emitting object, ALMA-J0107, at 99.753 GHz at , as shown in Figure 1. The image is marginally resolved, and the beam-deconvolved source size measured using a casa task imfit is , although no velocity structure is found. Figure 1 (upper right) shows the spectrum of the emission line. A single Gaussian fit to the spectrum shows mJy, km s-1. The integrated intensity is Jy km s-1. This line does not correspond to a CO line or any other line of VV114 itself, even if we search a wide velocity range of km s-1 around the systemic velocity of VV114 (6100 km s-1). Moreover, we find no emission line feature in the other spectral windows of Bands 3 and 7 at this position. Thus, it is natural to consider a redshifted emission line, especially a 12CO line, arising from a background galaxy. We list the possible redshifts, as well as the corresponding CO luminosities and molecular masses, for up to the –5 transitions of 12CO in Table 1. The –6 () transition is ruled out because no [C i](2–1) at GHz is found. Higher transitions at are not plausible. We will identify the line in § 3.
The 880- continuum emission in Band 7 is detected at the same position as the Band 3 line peak, close to the edge of the ALMA FoV (Figure 1, top left). The 880- flux density is mJy after correcting for primary beam attenuation, whereas we fail to detect the 3-mm continuum in Band 3 down to the 3 upper limit of mJy. The flux density is typical of SMGs (Blain et al., 2002), and the inferred far-infrared (FIR) luminosity is for if we assume a dust temperature of K and an emissivity index of . If the FIR luminosity is powered by starburst activities, a star formation rate is estimated to be yr-1 following Kennicutt (1998). We also find 1.3-mm continuum emission in published Submillimeter Array (SMA) data (Wilson et al., 2008). The 1.3-mm flux density is mJy. The Rayleigh–Jeans slope is constrained primarily by the ALMA observations, and the lower limit of the spectral index111The spectral index is defined such that . is , consistent with those found in dusty star-forming galaxies.
At the ALMA position, many ancillary data are available from the radio to the X-ray bands. Table 2 lists the results of multiwavelength photometry, and Figure 1 (bottom) shows multiwavelength images. Unfortunately, heavy blending by VV114 affects the infrared to optical images, but we clearly see a Chandra X-ray counterpart and marginally detect it in the Spitzer/IRAC bands. It is not clear from the current data whether the source is gravitationally lensed.
| 12CO | aaCO line luminosity in units of K km s-1 pc2 | bbMolecular gas mass in units of , derived using a conversion factor of (K km s-1 pc2)-1 (Downes & Solomon, 1998) and assuming thermally excited lines | Predicted ccIntegrated intensity in units of Jy km s-1, predicted from the 880- flux. See details in § 3.2. | ||
|---|---|---|---|---|---|
| Transition | M82dd K, , and the CO excitation ladder of M82 (Weiß et al., 2005b) are assumed. | BR1202eeThe same as (b), but a dust temperature of 50 K and the CO excitation ladder of BR 12020725 SE (Salomé et al., 2012) are assumed. | |||
| 0.1556 | 0.37 | 0.29 | 0.6 | 1.1 | |
| 1.311 | 7.1 | 5.7 | 0.8 | 1.6 | |
| 2.467 | 9.9 | 7.9 | 1.1 | 2.4 | |
| 3.622 | 10.5 | 8.4 | 1.4 | 3.5 | |
| 4.777 | 10.4 | 8.3 | 1.7 | 4.9 | |
| 5.932 | 10.0 | 8.0 | 2.0 | 6.6 | |
3. Redshift Identification
3.1. Photometric Redshift Estimates
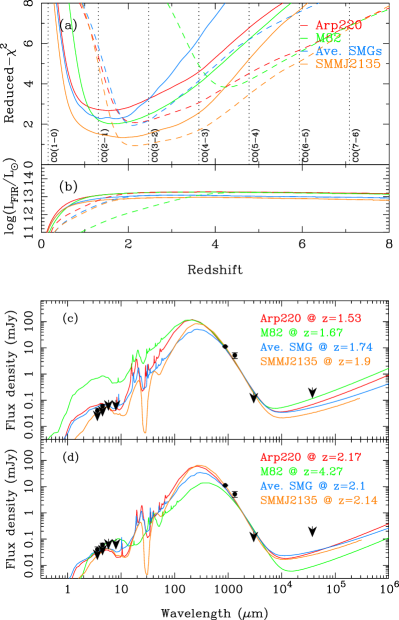
To obtain rough estimates of the redshift, we use four template spectral energy distributions (SEDs) of well-studied starburst galaxies: Arp 220, M82 (Silva et al., 1998), SMM J21350102 (Swinbank et al., 2010), and a composite of radio-identified SMGs (Michałowski et al., 2010). Then we fit the submm to radio data to the templates. Figures 2a, b, and c show the minimum and FIR luminosity as a function of the redshift and the best-fit SEDs, respectively. The resulting redshifts and the 90% confidence intervals are (Arp 220), (M82), (SMM J2135), and (mean SMG). Thus, the likely redshift range is for all the templates, suggesting that the 12CO redshift can be , 2.47, or 3.62. The FIR luminosity, –13, is mostly insensitive to the redshift.
The constraint could become tighter when we use the IRAC photometry in addition to the submm to radio data, although the use of IRAC data should be considered cautiously because IRAC observes the rest-frame optical component, which depends strongly on the stellar population model. The dashed curves in the plot of Figure 2a show the minimum values from SED fits using the constraints at 3.6 and 4.5 . The best-fit SEDs are shown in Figure 2d. The resulting redshifts are (Arp 220), (M82), (SMM J2135), and (mean SMG), although we note that the M82 fit might not be reliable in this case because of poor values. The plausible redshift range in this case is therefore . Consequently, the photometric redshift analysis favors a redshift of , whereas is within an acceptable range in terms of the values.
| Instrument | Band | Flux Density | Unit |
|---|---|---|---|
| VLAaaThe data were retrieved from the VLA archive. | 3.0 cm | (3) | mJy |
| ALMA/Band 3 | 3.0 mm | (3) | mJy |
| SMA | 1.3 mm | mJy | |
| ALMA/Band 7 | 880 | mJy | |
| Spitzer/IRAC | 8.0 | mJy | |
| Spitzer/IRAC | 5.8 | mJy | |
| Spitzer/IRAC | 4.5 | bbThe flux density is strongly affected by contamination from VV114 and thus should be regarded as an upper limit. | mJy |
| Spitzer/IRAC | 3.6 | bbThe flux density is strongly affected by contamination from VV114 and thus should be regarded as an upper limit. | mJy |
| Chandra/ACIS | 0.5–10 keV | erg s-1 cm-2 | |
| Chandra/ACIS | 0.5–2 keV | erg s-1 cm-2 | |
| Chandra/ACIS | 2–10 keV | erg s-1 cm-2 |
3.2. Line Identification
To confirm that this is a 12CO line, we estimate the 12CO intensities using the 880- continuum intensity and some empirical relations and quantities found in a local starburst galaxy, M82. From the 880- flux density, we obtain for and for if K and . The inferred FIR luminosity is almost independent of the redshift at . Although these are very crude estimates, we use the -to- correlation (Iono et al., 2009) to obtain the 12CO(3–2) luminosity and then the intensities at the possible redshifts. We find that , 1.6, 1.1, 1.0, 0.98, and 1.0 Jy km s-1 at , 1.31, 2.47, 3.62, 4.78, and 5.93, respectively. Then we assume the CO excitation ladder found in M82 (Weiß et al., 2005b) to obtain the CO intensities at other transitions, which allows us to estimate those at the possible redshifts. We repeat this procedure for a higher dust temperature ( K) and the CO excitation found for BR12020725 SE (Salomé et al., 2012), in which the heating of the interstellar medium is dominated by a powerful AGN. The results are given in Table 1. The line intensities are on the order of 1 Jy km s-1 and are in good agreement with the observed ones, strongly suggesting that the line is 12CO because non-12CO lines, such as 13CO and HCN, are order(s) of magnitude weaker than 12CO. The atomic carbon [CI](1–0) line is possible (at ) but less likely because the intensity is typically 1/3 to 1/10 that of 12CO(3–2) (e.g., Weiß et al., 2005a).
Other possible line attributions include the H2O molecule, which is known to have emission lines as bright as those of 12CO in the submm band. The major transitions exhibiting strong emission at GHz are – and – at and 987.9 GHz, respectively. However, the redshifts inferred from the H2O lines would be 6.54 and 8.90, which are outside of the photometric redshift range. Therefore, these results in combination with the photometric redshift indicate that the line is most likely a redshifted 12CO transition at or 3.622.
4. Hard X-ray Detection
We used the primary package of Chandra/ACIS-I data (sequence No. 600501, observation ID: 7063). The X-ray source at the ALMA position also appears east of VV114E in Figure 6 of Grimes et al. (2006). The effective exposure time at the position of ALMA-J0107 was 59 ks. We count the X-ray events with a -diameter aperture and measure the background level over a -diameter circular region centered at ALMA-J0107 while masking VV114 and ALMA-J0107. We find counts within the aperture, and background subtraction leaves counts, which is poor statistics but just enough to simply model the spectrum. We use xspec (version 12.8.1, Arnaud, 1996) for spectral modeling and assume a power-law spectrum for the intrinsic spectrum. For simplicity, we consider only an absorbed spectrum with the intrinsic photon index () and obscuring column density () as free parameters, and eliminate other components such as the scattered spectrum. Note that this simple assumption may underestimate the obscuring column.
The results for the likely redshifts of and 3.62, as well as for for reference, are shown in Table 3. The inferred unabsorbed luminosity, , covers the range for , which is comparable to that of AGN-classified SMGs (Alexander et al., 2005). Using the method described in Tamura et al. (2010), we estimate an AGN bolometric luminosity of – for . Despite a large uncertainty, this gives a mass of – for the accreting supermassive black hole, where is the Eddington ratio, which is typically 0.2–0.6 in SMGs (Alexander et al., 2008). The bolometric luminosity is comparable to those found in the most luminous AGNs in the local Universe (e.g., Mrk 231), but it is even less than the FIR luminosity of the host galaxy ALMA-J0107 ( for K), suggesting that the large FIR luminosity of ALMA-J0107 is not dominated by the AGN but can be attributed to massive star formation activities.
| aaRest-frame energy band corresponding to the observed-frame 0.5–10 keV band. | bbUnabsorbed luminosity in energy band . | ||||
|---|---|---|---|---|---|
| (cm-2) | (keV) | (ergs s-1) | () | ||
| 1.31 | 1.2–23 | 0.8 | |||
| 2.47 | 1.7–35 | 7.4 | |||
| 3.62 | 2.3–46 | 34 |
5. Number Counts of CO Emitters
How frequently is a 3 Jy km s-1 12CO emitter observed by chance? We use a mock galaxy catalog from the s3 sax simulation (Obreschkow et al., 2009a, b) to estimate the expected number of detections of redshifted 12CO, regardless of redshift, with a single pointing/tuning of ALMA at 100 GHz. This is a semi-analytic simulation of neutral atomic (H i) and molecular (H2) hydrogen in galaxies and the associated CO lines; it is based on the Millennium Simulation (Springel et al., 2005), which reliably recovers galaxies with cold hydrogen masses (H i+H. It reproduces the local CO(1–0) luminosity function well (Keres et al., 2003), whereas those at high- are not fully verified by observations; It may underpredict the number density of Jy km s-1 CO emitters at by a factor of several, in comparison with CO observations of BzK galaxies (Daddi et al., 2008, 2010). The cumulative number counts of CO emitters, , expected in a bandwidth and a primary beam solid angle are described as
| (1) | |||||
| (2) |
where is the redshift at which the transition of CO is observed at , and is the surface number density of galaxies observed in the transition per redshift interval with line fluxes above a certain threshold, . To estimate at each , we extract sources with an integrated intensity higher than 1 Jy km s-1 from the simulated volumes defined by an area of Mpc2 with a depth of at , 2.47, 3.62, 4.78, and 5.93 (we choose for ).
Consequently, we expect source with Jy km s-1 per ALMA FoV (2800 arcsec2) and bandwidth (7.5 GHz). Most of the sources (%) are CO(1–0) at . The remaining 10% are almost evenly distributed at , 2.47, and 3.62, but no source is found at . The SED analysis (§ 3.1) rules out the lowest redshift (), even though the probability of a chance detection appears to be highest for . Although it should be properly tested whether the s3 sax simulation reproduces the brightest ( Jy km s-1) population of CO emitters at , this result implies that ALMA-J0107, likely at or 3.62, is a very rare galaxy that falls within the ALMA bandwidth by chance (one out of FoVs).
6. Summary
We presented the detection of a 12CO-emitting galaxy, ALMA-J0107, beyond the nearby merging galaxies VV114. The integrated intensity of CO and the 880- flux density are Jy km s-1 and mJy, respectively. The photometric redshift analysis favors , but is acceptable. The molecular mass and FIR luminosity at the plausible redshifts are and , respectively, which correspond to a star formation rate of yr-1. We identified a hard X-ray source at the ALMA position, suggesting the presence of a luminous ( erg s-1) AGN behind a large hydrogen column ( for the likely redshifts). However, the intrinsic properties of the AGN (e.g., the bolometric luminosity) depend strongly on the redshift, although the FIR luminosity and molecular mass are rather insensitive to the redshift. This fact makes it difficult to investigate the power source of ALMA-J0107 and the evolutionary status of black hole growth in ALMA-J0107. It is obviously quite important to confirm the redshift through observations of the other transitions of 12CO.
This serendipitous detection of a CO-emitting galaxy demonstrates that ALMA is capable of identifying an emission-line galaxy such as ALMA-J0107. We have shown that the likelihood of stumbling across such a source is not high, and redshift determination remains a challenge even when one line and the continuum are clearly detected. Nevertheless, pointings of ALMA Band 3 will offer an additional detection of a Jy km s-1 CO source at high redshift (). A CO emitter at this flux level can routinely be detected at 100 GHz in only a few minutes with the full ALMA if the line happens to fall in the observing band. A complete census of background high- CO emitters in Band 3 archival cubes, as well as [C ii] emitters in Band 6/7, is encouraged.
References
- Alexander et al. (2005) Alexander, D. M., Bauer, F. E., Chapman, S. C., et al. 2005, ApJ, 632, 736
- Alexander et al. (2008) Alexander, D. M., Brandt, W. N., Smail, I., et al. 2008, AJ, 135, 1968
- Arnaud (1996) Arnaud, K. A. 1996, Astronomical Data Analysis Software and Systems V, 101, 17
- Blain et al. (2002) Blain, A. W., Smail, I., Ivison, R. J., Kneib, J.-P., & Frayer, D. T. 2002, Phys. Rep., 369, 111
- Daddi et al. (2008) Daddi, E., Dannerbauer, H., Elbaz, D., et al. 2008, ApJ, 673, L21
- Daddi et al. (2010) Daddi, E., Bournaud, F., Walter, F., et al. 2010, ApJ, 713, 686
- Downes & Solomon (1998) Downes, D., & Solomon, P. M. 1998, ApJ, 507, 615
- Grimes et al. (2006) Grimes, J. P., Heckman, T., Hoopes, C., et al. 2006, ApJ, 648, 310
- Hatsukade et al. (2013) Hatsukade, B., Ohta, K., Seko, A., Yabe, K., & Akiyama, M. 2013, ApJ, 769, L27
- Imanishi et al. (2007) Imanishi, M., Nakanishi, K., Tamura, Y., Oi, N., & Kohno, K. 2007, AJ, 134, 2366
- Iono et al. (2013) Iono, D., Saito, T., Yun, M. S., et al. 2013, PASJ, 65, L7
- Iono et al. (2009) Iono, D., Wilson, C. D., Yun, M. S., et al. 2009, ApJ, 695, 1537
- Kennicutt (1998) Kennicutt, R. C., Jr. 1998, ARA&A, 36, 189
- Keres et al. (2003) Keres, D., Yun, M. S., & Young, J. S. 2003, ApJ, 582, 659
- McMullin et al. (2007) McMullin, J. P., Waters, B., Schiebel, D., Young, W., & Golap, K. 2007, Astronomical Data Analysis Software and Systems XVI, 376, 127
- Michałowski et al. (2010) Michałowski, M., Hjorth, J., & Watson, D. 2010, A&A, 514, A67
- Obreschkow et al. (2009a) Obreschkow, D., Heywood, I., Klöckner, H.-R., & Rawlings, S. 2009a, ApJ, 702, 1321
- Obreschkow et al. (2009b) Obreschkow, D., Klöckner, H.-R., Heywood, I., Levrier, F., & Rawlings, S. 2009b, ApJ, 703, 1890
- Salomé et al. (2012) Salomé, P., Guélin, M., Downes, D., et al. 2012, A&A, 545, A57
- Silva et al. (1998) Silva, L., Granato, G. L., Bressan, A., & Danese, L. 1998, ApJ, 509, 103
- Springel et al. (2005) Springel, V., White, S. D. M., Jenkins, A., et al. 2005, Nature, 435, 629
- Swinbank et al. (2010) Swinbank, A. M., Smail, I., Longmore, S., et al. 2010, Nature, 464, 733
- Swinbank et al. (2012) Swinbank, A. M., Karim, A., Smail, I., et al. 2012, MNRAS, 427, 1066
- Tamura et al. (2010) Tamura, Y., Iono, D., Wilner, D. J., et al. 2010, ApJ, 724, 1270
- Vieira et al. (2013) Vieira, J. D., Marrone, D. P., Chapman, S. C., et al. 2013, Nature, 495, 344
- Wagg et al. (2012) Wagg, J., Wiklind, T., Carilli, C. L., et al. 2012, ApJ, 752, L30
- Wang et al. (2013) Wang, R., Wagg, J., Carilli, C. L., et al. 2013, ApJ, 773, 44
- Weiß et al. (2005a) Weiß, A., Downes, D., Henkel, C., & Walter, F. 2005a, A&A, 429, L25
- Weiß et al. (2005b) Weiß, A., Walter, F., & Scoville, N. Z. 2005b, A&A, 438, 533
- Wilson et al. (2008) Wilson, C. D., Petitpas, G. R., Iono, D., et al. 2008, ApJS, 178, 189