Optimal shapes and stresses of adherent cells on patterned substrates
Abstract
We investigate a continuum mechanical model for an adherent cell on two dimensional adhesive micropatterned substrates. The cell is modeled as an isotropic and homogeneous elastic material subject to uniform internal contractile stresses. The build-up of tension from cortical actin bundles at the cell periphery is incorporated by introducing an energy cost for bending of the cell boundary, resulting to a resistance to changes in local curvature. Integrin-based adhesions are modeled as harmonic springs, that pin the cell to adhesive patches of a predefined geometry. Using Monte Carlo simulations and analytical techniques we investigate the competing effects of bulk contractility and cortical bending rigidity in regulating cell shapes on non-adherent regions. We show that the crossover from convex to concave cell edges is controlled by the interplay between contractile stresses and boundary bending rigidity. In particular, the cell boundary becomes concave beyond a critical value of the contractile stress that is proportional to the cortical bending rigidity. Furthermore, the intracellular stresses are found largely concentrated at the concave edge of the cell. The model can be used to generate a cell-shape phase diagram for each specific adhesion geometry.
I Introduction
Living cells actively probe physical cues in their environment via receptor-ligand adhesion complexes that link the actomyosin cytoskeleton to the extracellular matrix (ECM) Schwarz and Gardel (2012). The cellular microenvironment, comprising of the ECM and of neighboring cells, imposes specific boundary conditions that can regulate physiological processes such as cell differentiation, division and motility, as well as cell architecture and polarity Discher et al. (2005). Myosin motors generate contractile stresses in the actin cytoskeleton that are transmitted to the substrate by focal adhesions. The traction stresses exerted by the cells on the substrate are thus very sensitive to the stiffness of the substrate as well as to the adhesion geometry. Cell morphology in turn is directly affected by traction stresses through the tension that builds up in the actomyosin stress fibers. It has been shown that the substrate stiffness plays a crucial role in regulating the cell spread area, the magnitude of traction forces and the cell morphology Yeung et al. (2005); Lo et al. (2000); Ghibaudo et al. (2008); Chopra et al. (2011). Much less explored is the role of adhesion geometry in regulating the spatial distribution of cellular stresses. Micropatterning has emerged as a powerful tool to investigate the interplay of mechanics and cytoskeletal architecture in controlling cell morphology by specific tuning of the geometry of the adhesion sites Théry (2010). When plated on small micropatterns, cells are unable to grow, thus showing high apoptotic rate Chen et al. (1997). Large adhesive patches, in contrast, favor cell spreading and promote the assembly of contractile stress fibers along the cell’s perimeter Théry et al. (2006). These peripheral stress fibers interconnect focal adhesions and yield concave arcs of constant curvature in the nonadherent portions of the cell boundaries. In addition, traction forces tend to localize in regions of high curvature at the boundary Roca-Cusachs et al. (2008); Rape et al. (2011). The model proposed here allows to separately study the roles of cell contractility and mechanical properties of peripheral cell fibers in controlling cell shape. Future comparison with experiments where both quantities can be perturbed using pharmacological interventions Bar-Ziv et al. (1999); Théry et al. (2006) may provide a quantitative understanding of the relative importance of boundary and bulk properties in determining steady state cell shapes.
Various successful theoretical models of single and multi-cell mechanics have been proposed over the past decade that address the role of ECM elasticity in regulating cell behavior Schwarz and Safran (2013). Previous work has addressed the interplay between cell mechanics and geometry by either focusing solely on the elasticity of the cell boundary Bischofs et al. (2009); Banerjee and Giomi (2013) or by considering only the bulk of the cell, described via continuum mechanics Banerjee and Marchetti (2011); Edwards and Schwarz (2011); Pathak et al. (2008); Banerjee and Marchetti (2013), by a cellular Potts model Vianay et al. (2010), or as a polymer network Torres et al. (2012). These models highlight the competing roles of cell contractility and substrate stiffness in regulating polymorphic cell shapes.
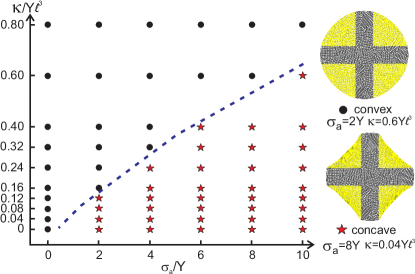
Continuum models of cell mechanics have assumed that the material constants describing the cell are spatially homogeneous. Cell material properties are, however, highly heterogeneous. In particular, experiments have shown strong differences in the mechanical properties of the bulk and boundary regions of the cell Heidemann and Wirtz (2004). Increased tension and rigidity of cell boundaries can spontaneously arise during adhesion as a result of the assembly of peripheral stress fibers consisting of thin bundles of semiflexible actin filaments. Due to thermal and active forces these bundles considerably bend generating non-uniform peripheral tensions. Cell boundary can also resist changes in local curvature due to contact forces at the three-phase contact line between the cell, the substrate and the ambient medium. Motivated by these observations, in this paper we couple cell contour elasticity Bischofs et al. (2009); Banerjee and Giomi (2013) to a continuum description of bulk cell mechanics Banerjee and Marchetti (2011); Edwards and Schwarz (2011) to investigate the cooperative roles of cortical elasticity, bulk elasticity and active contractility in controlling cell shapes on non-uniform adhesion patterns. Non-uniform tension and elasticity is incorporated in the model by introducing a penalty for bending deformations of the cell periphery Banerjee and Giomi (2013). Using a combination of Monte Carlo simulation and analytical studies, we examine the interplay of bulk contractility and cortical tension in controlling morphological transitions in adherent cells and propose a cell shape phase diagram for specific adhesion geometries. An example of such a phase diagram for a cross-shaped adhesion pattern is shown in Fig. 1. See section 3 for details.
The paper is organized as follows. In section II, we describe a continuum mechanical model for a thin adherent cell as an isotropic and homogeneous elastic material, subject to a homogeneous negative pressure, embodying active contractility. Cell-ECM adhesions are modeled as linear springs distributed non-uniformly along the cell-substrate interface. Cortical tension is described via a penalty for bending deformations of the cell periphery. In Section III we discuss the steady shapes of cells adherent to different concave micropatterns obtained via Monte Carlo simulations (numerical details are given in the Appendix). Our simulations suggest a transition between convex and concave morphologies as a function of cell contractility and bending rigidity, that is captured by an analytically solvable model for the cell boundary presented in Section IV. We conclude with a brief discussion.
II Continuum Mechanical Model
We consider the mechanical equilibrium of a stationary cell strongly adherent to a soft elastic substrate. We assume that the cell’s interior can be described as an isotropic homogeneous elastic material and neglect all dissipation. We further neglect all out-of-plane deformations of the cell and assume that its thickness is uniform throughout its entire area and remains unaffected by the substrate-induced deformations. The bulk elastic energy of our model cell is given by
| (1) |
with the three-dimensional Young’s modulus, the cell thickness, the Poisson’s ratio, and () the strain tensor. We retain the nonlinearity in strain tensor to allow for the possibility of large strains that can arise even for small displacements Audoly and Pomeau (2010). The nonlinear terms essentially describe strain stiffening which is indeed expected in crosslinked actin networks Gardel et al. (2004). The two-dimensional displacement vector is defined as , where () is a material point before (after) the deformation. The integral is calculated over the area of the undeformed (reference) state and summation over pairs of repeated indices is assumed. Cell contractility arising from myosin motors is modeled as a homogeneous negative pressure resulting in an additional contribution to the cell’s energy, given by
| (2) |
where is a parameter controlling active contractility, determine by concentration of myosin motors and rate of ATP consumption. At the continuum scale, it controls active contributions to the cell’s surface tension Mertz et al. (2012). Cell adhesion to the substrate is modeled via a harmonic potential with a position-dependent rigidity parameter
| (3) |
with the position of focal adhesions on the substrate. The rigidity parameter is nonzero over the adhesion region and zero elsewhere. Thus we allow for non-uniformity in the geometry of cell-substrate adhesions as can be realized experimentally using micropatterning techniques Théry et al. (2006). The assumption of local adhesive interactions with the underlying substrate strictly holds for elastic substrates that are much thinner than the cell perimeter or on soft microposts Banerjee and Marchetti (2012). The rigidity parameter depends on the elastic modulus of the underlying substrate as well as on the stiffness of focal adhesions. For an elastic substrate of shear modulus and thickness , with focal adhesion density , is given by, . Traction force density is therefore given by, . Finally, we assign a bending penalty to the cell’s perimeter, reflecting the resistance of cortical actin bundles to changes in curvature,
| (4) |
where is the bending rigidity, is the curvature of the boundary, with a parametric curve describing the cell boundary, and the line integral is calculated along the cell boundary.
The optimal shape of the cell is obtained by minimizing the total mechanical energy , that is given as the sum of elastic, active, adhesion, and boundary bending energies, .
III Numerical Simulations
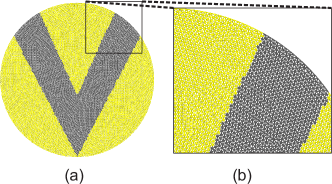
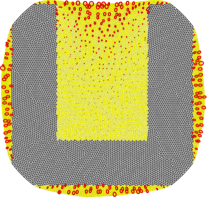
The minimal energy cell shapes have been determined numerically by a Monte Carlo study of a discrete representation of the continuum model introduced in Section II. The discrete representation of the undeformed cell is a triangulated disk. The initial configuration is built by randomly placing particles on a disk of radius . Particles are assumed to interact pairwise via a Weeks-Chandler-Andersen potential Weeks et al. (1971) and their positions are equilibrated using a standard Monte Carlo simulation with canonical () Metropolis algorithm. A typical equilibrated configuration is stored and the positions of the particles of that configuration are then used as nodes to construct a Delaunay triangulation. The resulting triangulation for a V-pattern is shown in Fig. 2. We note that the initial density of points in the disk is chosen such that even in the equilibrium state there is a substantial overlap between neighbors, thus ensuring a densely packed distribution of points. As a result the equilibrium distribution of the interparticle distances is rather narrow and its mean, denoted as , represents a suitable unit of length. In the following, all distances are measured in units of and all energies are measured in units of , where is the two-dimensional Young’s modulus. The substrate rigidity has units of and the bending rigidity of cortical stress fibers has units of . The low energy configurations are obtained using simulated annealing Monte Carlo (see Appendix for details).
III.1 Optimal shapes
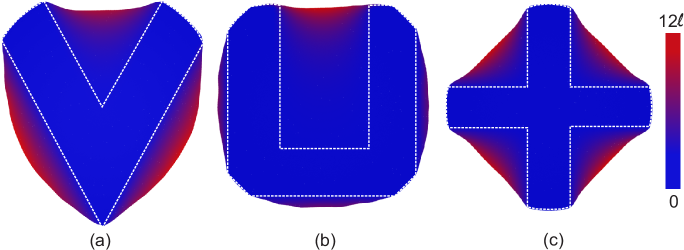
We performed a series of simulations for , , and cross shaped micro-patterns, corresponding to the white dashed outlines shown in Fig. 3. The relaxed shapes for three non-convex patterns (, , and cross) obtained for a fixed value of the rigidity of adhesions , and are shown in Fig. 3. In all cases, the non-adherent cell edges spanning two pinning regions are clearly concave. The relaxed shapes can be qualitatively compared with experiments on concave micropatterns Théry et al. (2006). Our simulations suggest that there is a transition between the concave and convex morphologies as a function of and . In Figure 1, we show a sample cell shape phase diagram as a function of the cortical bending rigidity and the active contractile stress for the cross shaped micropattern. The figure indicates that the cell boundary is concave at high values of the contractile stress , whereas convexity is ensured at high values of bending rigidity. The phase boundary between convex and concave shapes appears to be linear in the plane. To justify this observation, in the next section we study analytically the shape of the cell boundary in the non-adhesive regions, considering small deformation about a circular configuration.
III.2 Optimal Stresses
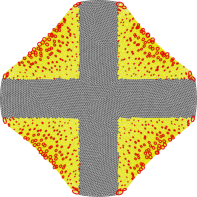
Experiments probing the distribution of traction force density exerted by cells adhering to soft substrates consistently show that such stresses are concentrated at the cell edges, and strongest in region of high cell curvature. Force balance requires , where is the two-dimensional stress tensor of the bulk cellular material, given by,
| (5) | |||||
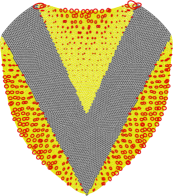
The distribution of such internal stresses can therefore be inferred experimentally from traction force microscopy measurements Tambe et al. (2011). Internal stresses of adhering cells are found to be concentrated at the cell’s interior, with a maximum value proportional to the active cell contractility, here . To highlight the role of patterned adhesion on the spatial distribution of cellular stress, we display in Fig. 4 the spatial distribution of the so-called Lamé’s stress ellipses Love (1927) for the elastic part of the stress tensor. The constant active contribution has been subtracted out to highlight spatial variations. As a result, the displayed stress is largest at the cell edges. The Lamé’s stress ellipses are obtained by computing the elastic part of the two-dimensional stress tensor at a representative subset of triangles in the Delaunay grid. This is achieved by directly evaluating the expression in eqn (5), excluding the active term. We then compute the low and the high eigenvalues, and , respectively, of the elastic stress tensor of a given triangle. Note that since the stress tensor is symmetric, its eigenvalues are always real. The length of the major and minor semi-axes of each ellipse are then given by and , respectively, whereas the orientation of the ellipse axes is given by the directions of the corresponding eigenvectors. As expected, and consistent with experiments Théry (2010), elastic stresses are concentrated at the free boundaries of the adherent cell. Boundary stresses along free edges connecting two adhesion points are directed normal to the edge whereas they are oriented along the edge near the adhesion points. This is most evident in the cross-shaped pattern, Fig. 4(c). The large stresses in the convex regions of the cell spilling outside straight portions of the pinning regions (see, for instance, the V-shape pattern, Fig. 4(a)) are largely an artifact of our model. They arise because we have introduced excluded volume interactions to prevent self-intersections of the triangulation. In other words, we assign a hard core radius of to each vertex of the triangulation, such that no two vertices can came closer than from each other. Once this limit has been reached, the excluded volume prevents further collapse of the cell, thus accounting for the presence of a sizeable portion of the cell that extends outside the pinning region. While steric effects are present in vivo and may describe for instance the role of structural elements capable of carrying compressive loads, such as microtubules, cells on synthetic substrates generally almost completely conform to the micropattern by changing their thickness. This is not possible in our strictly two-dimensional model. As a result, the model captures well the behavior of “free” cell edges spanning two adhesion points, but has limitations for describing the behavior of cell boundaries along straight pinning regions.
(a)
(b)
(c)
IV Boundary shapes
IV.1 Strong pinning at adhesions
For small deformations about an initially circular configuration of radius , the cell boundary in the non-adhesive region can be parametrized using polar coordinates as, , where is the radial component of the displacement field at the cell boundary, . Thus, is solely a function of the angular coordinate . In mechanical equilibrium, boundary force balance along the normal and tangential directions requires
| (6a) | |||
| (6b) | |||
where is the arc-length parameter and and are unit vectors normal and tangent, respectively, to the unperturbed cell boundary. Tangential force-balance in polar coordinates reduces to , which leads to the relation . Thus, the normal component of the elastic stress is given by , where is the Lamé elastic constant. Furthermore, for small deformations , the boundary curvature can be expanded as,
| (7) |
Using eqns (6a)-(7), and letting , we obtain an equation for the boundary profile,
| (8) |
where . Without loss of generality, we can consider solution in the interval , where is the angular width of the nonadherent region and depends on the geometry of the adhesion pattern. The boundary conditions for the case of strong pinning at adhesions are given by: . The full solution of eqn (8) is analytically tractable but cumbersome. We instead discuss the solutions in two limiting cases in terms of the dimensionless parameter , reflecting the relative contributions of bending and bulk elasticity. This parameter can also be written as in terms of the ratio of a length scale to the undeformed cell radius . The length scale described the interplay between bulk elasticity and boundary tension in controlling the response of the cell. When (corresponding to ) the cel deformation is controlled by the cortical tension at the boundary and the curvature is given by
| (9) |
Bulk elasticity drops out and the behavior is controlled by the ratio of contractility to bending rigidity. The curvature has a minimum at the center of the nonadherent segment. Thus, as one increases contractility , a region of negative curvature develops near , which grows upon increasing until convexity is retained within a small neighborhood of the adhesion patch. The onset of concavity is thus given by the condition of reality to the solution of , which gives the condition,
| (10) |
Since concave shapes are commonly observed in experiments Théry et al. (2006), we now turn to estimate the critical value of as predicted by our model in order to compare it with experimentally reported values for . The bending rigidity of cortical stress fibers can be estimated as , where is the Young’s modulus of actin and is the typical radius of the stress fibers. Using GPa Gittes et al. (1993) and m, we get Nm2. Using this value in eqn (10) for , corresponding to a thin V-pattern, we get value for the critical 2.7 nN/m. This is indeed the order of magnitude value for active stress or surface tension reported in experiments for adherent epithelial cells on continuous elastic substrates or endothelial cells on microposts Bischofs et al. (2009); Mertz et al. (2012). In the opposite limit of the deformation is controlled by bulk elasticity and the curvature is given by
| (11) |
The condition of concavity is given by . In the case when is comparable to , a simpler solution of eqn (8) can be obtained by neglecting the fourth order gradient term and also the derivative boundary conditions. The crossover to concave profiles can be approximated by the following interpolating form between the two limiting cases,
| (12) |
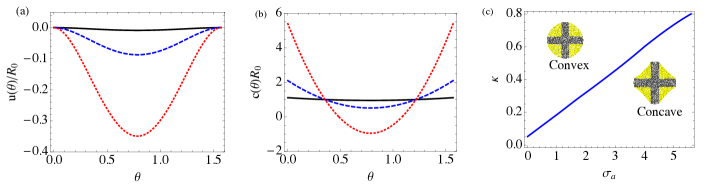
In the general case of eqn (8), the solution for curvature and the radial displacement is given in Fig. 5a,b for three different values of that compares the relative strengths of contractility to bending deformations. Furthermore, to compare numerically with the simulation results for the shape phase diagram of the adherent cell, we show the concave-convex phase boundary in plane in Fig. 5c, for a cross-shaped micropattern using the same parameters as used in Fig. 1. The resultant phase diagram is in good order-of-magnitude agreement with the simulation results, and the discrepancy in numerical values possibly arise from neglecting non-local bulk elasticity in the theoretical analysis.
IV.2 Soft pinning
We now consider the case of soft pinning, where the free cell boundary is anchored to soft springs at the adhesion sites. Equation (8) is now solved with the boundary conditions and , where we have introduced an unknown displacement of the ends of the segment, which can be self consistently determined by minimizing the total energy of the deformed configuration with respect to . For simplicity we ignore bulk elasticity and consider the limit . The total energy of the deformed configuration is then given by , where and is the cross-sectional area of focal adhesions. Note that the contribution due to contractility vanishes in the final energy due to the derivative boundary conditions on . The onset of concavity now depends on the substrate stiffness and the condition for convex-concave transition is given by
| (13) |
Thus, stiffer adhesions with , promote concavity transition at a much higher value of contractility. It is favorable for a cell to invaginate at the free edges if the anchoring at adhesions is softer than the effective bending stiffness .
V Concluding Remarks
Using a simple continuum model, coupling bulk and contour mechanics, we investigate the equilibrium shapes and stresses of adherent cells on substrates with various adhesion patterns. A continuum model without contour elasticity have been studied previously by two of us on convex patterns Banerjee and Marchetti (2011), which was successful in capturing distribution of traction and cellular stresses and their dependence on substrate physical properties Banerjee and Marchetti (2012). Here we focus on the shape and geometry induced stresses of non-adherent cell edges on concave micropatterns. We demonstrate numerically and analytically that the curvature of the non-adherent cell boundary can undergo a shape transition from convex to concave morphology, controlled by the interplay of contractility and bending rigidity. Stiff boundaries with low contractility relax to convex shapes, whereas at higher values of contractility, non-adherent cell edges attain a concave morphology. Previous work has shown that contractile cable network models are capable of reproducing the invaginated circular arc morphology of cell edges connecting strongly adhering sites Torres et al. (2012). Here we demonstrate that simple continuum whole-cell models can also predict qualitatively cell shape and the transition between convex and concave cell edges, provided a bending rigidity describing cortical tension is included. For parameters realistic to experiments (see section 4.1) our model suggest that cells prefer to invaginate at their free edges, such that the effective boundary stiffness on non-adhesive zones are softer than myosin induced contractile stresses. Images of actin from experiments on concave micropatterns do indeed show the formation of long and thin stress fibers that are invaginated on non-adherent edges Théry et al. (2006), indicating a softer cortical rigidity. In addition, elastic stresses are found to be higher along the free cell boundaries than in the neighborhood of adhesions, since in the absence of mechanotransduction cellular forces along free edges are not shared by the substrate. Previous theoretical study with only contour elasticity indicated that substrate stiffness and contractility can cooperatively control cell morphology and induce hysteresis at the onset of convex-concave transition Banerjee and Giomi (2013). Here we show that even in the presence of rigid adhesions, cell shape can be controlled by regulating the cortical bending rigidity and contractility. Bending rigidity can be experimentally controlled by regulating the amount of actin cross-linking proteins that can impact stress fiber thickness and rigidity, whereas myosin based contractility can be perturbed using the conventional inhibitor Blebbistatin. One limitation of our model is that it is strictly two-dimensional and does not allow for changes in the cell thickness. Due to the presence of steric interactions in the finite element simulations, the cell edges on flat adhesive segments do not fully relax to the flat morphology, but maintain a convex shape. This is in contrast to real cells that contract to adjust to the shape of the micropattern. A fully three-dimensional model can overcome this difficulty, and is a natural extension of our present work.
VI Appendix : Simulation Details
VI.1 Discrete Model
The discrete version of the elastic and active contraction energies can be expressed as a sum over triangles of the triangulation,
| (14) |
| (15) |
where matrix , with () being discrete metric tensor of the reference (deformed) configuration. is the area of an undeformed triangle spanned by two vectors and pointing along its sides. The sum is carried over all triangles. Adhesion energy is discretized as
| (16) |
where () for grey (yellow) vertices in Fig. 2, ( is the current (reference) position of the vertex i, and is the area associated to the vertex (i.e., a third of the sum of areas of all triangles that share the vertex, so-called “vertex star”). Finally, following ref. 31, the boundary bending energy is discretized as
| (17) |
where is the exterior angle at the boundary vertex i, and are lengths of two boundary edges meeting at i, and the sum is carried over all boundary vertices.
VI.2 Monte Carlo Sweeps
A Monte Carlo sweep consist of an attempted move for each vertex. A randomly selected vertex is displaced by where components of are chosen at random with an equal probability from an interval . Moves were accepted according to the Metropolis rules. Minimum energy configuration is obtained using simulated annealing with linear cooling protocol. Typically minimum energy configurations were reached to a satisfactory precision within Monte Carlo sweeps.
References
- Schwarz and Gardel (2012) U. S. Schwarz and M. L. Gardel, Journal of cell science, 2012, 125, 3051–3060.
- Discher et al. (2005) D. Discher, P. Janmey and Y. Wang, Science, 2005, 310, 1139–1143.
- Yeung et al. (2005) T. Yeung, P. Georges, L. Flanagan, B. Marg, M. Ortiz, M. Funaki, N. Zahir, W. Ming, V. Weaver and P. Janmey, Cell Motil Cytoskel, 2005, 60, 24–34.
- Lo et al. (2000) C.-M. Lo, H.-B. Wang, M. Dembo and Y.-l. Wang, Biophysical journal, 2000, 79, 144–152.
- Ghibaudo et al. (2008) M. Ghibaudo, A. Saez, L. Trichet, A. Xayaphoummine, J. Browaeys, P. Silberzan, A. Buguin and B. Ladoux, Soft Matter, 2008, 4, 1836–1843.
- Chopra et al. (2011) A. Chopra, E. Tabdanov, H. Patel, P. Janmey and J. Kresh, Am J Physiol-Heart C, 2011, 300, H1252–H1266.
- Théry (2010) M. Théry, Journal of Cell Science, 2010, 123, 4201–4213.
- Chen et al. (1997) C. Chen, M. Mrksich, S. Huang, G. Whitesides and D. Ingber, Science, 1997, 276, 1425–1428.
- Théry et al. (2006) M. Théry, A. Pépin, E. Dressaire, Y. Chen and M. Bornens, Cell Motil Cytoskel, 2006, 63, 341–355.
- Roca-Cusachs et al. (2008) P. Roca-Cusachs, J. Alcaraz, R. Sunyer, J. Samitier, R. Farré and D. Navajas, Biophysical journal, 2008, 94, 4984–4995.
- Rape et al. (2011) A. D. Rape, W.-h. Guo and Y.-l. Wang, Biomaterials, 2011, 32, 2043–2051.
- Bar-Ziv et al. (1999) R. Bar-Ziv, T. Tlusty, E. Moses, S. Safran and A. Bershadsky, Proc Natl Acad Sci USA, 1999, 96, 10140–10145.
- Schwarz and Safran (2013) U. S. Schwarz and S. A. Safran, Reviews of Modern Physics, 2013, 85, 1327.
- Bischofs et al. (2009) I. Bischofs, S. Schmidt and U. Schwarz, Phys Rev Lett, 2009, 103, 48101.
- Banerjee and Giomi (2013) S. Banerjee and L. Giomi, Soft Matter, 2013, 9, 5251–5260.
- Banerjee and Marchetti (2011) S. Banerjee and M. C. Marchetti, EPL (Europhysics Letters), 2011, 96, 28003.
- Edwards and Schwarz (2011) C. M. Edwards and U. S. Schwarz, Physical Review Letters, 2011, 107, 128101.
- Pathak et al. (2008) A. Pathak, V. S. Deshpande, R. M. McMeeking and A. G. Evans, Journal of The Royal Society Interface, 2008, 5, 507–524.
- Banerjee and Marchetti (2013) S. Banerjee and M. C. Marchetti, New Journal of Physics, 2013, 15, 035015.
- Vianay et al. (2010) B. Vianay, J. Käfer, E. Planus, M. Block, F. Graner and H. Guillou, Physical review letters, 2010, 105, 128101.
- Torres et al. (2012) P. G. Torres, I. Bischofs and U. Schwarz, Physical Review E, 2012, 85, 011913.
- Heidemann and Wirtz (2004) S. R. Heidemann and D. Wirtz, Trends in cell biology, 2004, 14, 160–166.
- Audoly and Pomeau (2010) B. Audoly and Y. Pomeau, Elasticity and geometry: from hair curls to the non-linear response of shells, Oxford University Press Oxford, 2010.
- Gardel et al. (2004) M. Gardel, J. Shin, F. MacKintosh, L. Mahadevan, P. Matsudaira and D. Weitz, Science, 2004, 304, 1301–1305.
- Mertz et al. (2012) A. Mertz, S. Banerjee, Y. Che, G. German, Y. Xu, C. Hyland, M. Marchetti, V. Horsley and E. Dufresne, Phys Rev Lett, 2012, 108, 198101.
- Banerjee and Marchetti (2012) S. Banerjee and M. C. Marchetti, Phys Rev Lett, 2012, 109, 108101.
- Weeks et al. (1971) J. D. Weeks, D. Chandler and H. C. Andersen, The Journal of chemical physics, 1971, 54, 5237.
- Tambe et al. (2011) D. T. Tambe, C. C. Hardin, T. E. Angelini, K. Rajendran, C. Y. Park, X. Serra-Picamal, E. H. Zhou, M. H. Zaman, J. P. Butler, D. A. Weitz et al., Nature Materials, 2011, 10, 469–475.
- Love (1927) A. E. H. Love, A Treatise on the Mathematical Theory of Elasticity, Cambridge University Press, Cambridge, 4th edn, 1927.
- Gittes et al. (1993) F. Gittes, B. Mickey, J. Nettleton and J. Howard, The Journal of cell biology, 1993, 120, 923–934.
- Brakke (1992) K. A. Brakke, Experimental mathematics, 1992, 1, 141–165.