Pair-Instability Supernovae in the Local Universe
Abstract
The discovery of 150 - 300 stars in the Local Group and pair-instability supernova candidates at low redshifts has excited interest in this exotic explosion mechanism. Realistic light curves for pair-instability supernovae at near-solar metallicities are key to identifying and properly interpreting these events as more are found. We have modeled pair-instability supernovae of 150 - 500 0.1 - 0.4 stars. These stars lose up to 80% of their mass to strong line-driven winds and explode as bare He cores. We find that their light curves and spectra are quite different from those of Population III pair-instability explosions, which therefore cannot be used as templates for low-redshift events. Although non-zero metallicity pair-instability supernovae are generally dimmer than their Population III counterparts, in some cases they will be bright enough to be detected at the earliest epochs at which they can occur, the formation of the first galaxies at 10 - 15. Others can masquerade as dim, short duration supernovae that are only visible in the local universe and that under the right conditions could be hidden in a wide variety of supernova classes. We also report for the first time that some pair-instability explosions can create black holes with masses of 100 .
Subject headings:
early universe – galaxies: high-redshift – stars: early-type – supernovae: general – radiative transfer – hydrodynamics – cosmology:theory – stars: Population II – supernovae: individual (SN 2007bi)1. Introduction
The recent discovery of stars with masses above 150 in the star cluster R136 (Crowther et al., 2010) and the detection of pair-instability supernova (PI SN) candidates SN 2007bi at 0.123 (Gal-Yam et al., 2009; Young et al., 2010) and SN 2213 - 1745 at 2.05 (Cooke et al., 2012) have excited interest in this exotic explosion mechanism and challenged current theories of galactic star formation. In particular, it is not understood how so massive a progenitor can form in metallicities like those of the Small Magellanic Cloud, 0.1 . Models of Population III (Pop III) stellar evolution predict that metal-free stars must have initial masses of 140 - 260 to die as PI SNe (Heger & Woosley, 2002) (although Chatzopoulos & Wheeler, 2012, have now extended the lower mass limit down to 85 if the star is rotating). Stars forming in 0.1 gas may have to be much more massive at birth to die as PI SNe because they can lose most of their mass over their lifetimes to line-driven winds (Schaerer, 2002; Vink et al., 2001). The conundrum lies in the fact that radiative cooling in gas and dust at such metallicities would almost certainly cause it to fragment on mass scales that are an order of magnitude below those required to produce PI SNe.
Understanding the observational signatures of PI SNe at near-solar metallicities is key to identifying and properly interpreting these events as more of them are found, since current and future SN factories like the Palomar Transient Factory (PTF; Law et al., 2009), the Panoramic Survey Telescope & Rapid Response System (Pan-STARRS) (Kaiser et al., 2002), and the Large Synoptic Survey Telescope (LSST; Ivezic et al., 2008) may harvest large numbers of them. Until now, numerical studies have focused on Pop III PI SNe as probes of the properties of the first stars (Herzig et al., 1990; Bromm et al., 2003; Scannapieco et al., 2005; Kitayama & Yoshida, 2005; Whalen et al., 2008c; Fryer et al., 2010; Kasen et al., 2011; de Souza et al., 2011; Vasiliev et al., 2012; Pan et al., 2012a, b; Meiksin & Whalen, 2013; Whalen et al., 2013a, d; de Souza et al., 2013, 2014) (see also Whalen et al., 2013b, c, e; Johnson et al., 2013b; Whalen et al., 2013f, g, 2014, h; Kozyreva et al., 2014a, b). The goal of these studies was also to better understand primeval galaxies and the origin of supermassive black holes (e.g., Whalen & Fryer, 2012; Johnson et al., 2012, 2013c, 2014) (see Whalen, 2013; Glover, 2013, for recent reviews).
But to understand PI SNe in the local universe, one must begin with non-zero metallicity progenitors for two reasons. First, metals substantially alter the internal structure of massive stars and can lead to heavy mass loss. Mass loss in turn can shorten the duration of SN light curves (LCs) by reducing the mass of formed in the explosion and radiation diffusion timescales in the ejecta (Kasen et al., 2011):
| (1) |
On the other hand, the presence of a dense circumstellar envelope can add to the diffusion timescales of photon diffusion from the flow by contributing additional mass in equation (1). Second, Pop III stars explode in low-density relic H II regions (Whalen et al., 2004; Kitayama et al., 2004; O’Shea et al., 2005; Alvarez et al., 2006; Abel et al., 2007; Wise & Abel, 2008; Whalen & Norman, 2008a, b; Whalen et al., 2008a, 2010) while PI SNe in the local universe may occur in dense winds and bubbles blown by the star. Such envelopes can have large effects on the light curves of SNe, either quenching them or brightening them. For example, outbursts prior to the death of the star can eject massive shells with which the SN later collides, producing an event that is far more luminous than the explosion itself. The effects of higher metallicity on radiation flow in the ejecta and surrounding interstellar medium (ISM) are also unknown. They could be important, since variations in opacity of just a factor of 3 or 4 can lead to fluctuations in optical depth and luminosity by factors of 50 or more.
We have now modeled the PI SN explosions of very massive 0.1 - 0.4 stars and calculated their light curves and spectra. In Section 2 we discuss our stellar evolution and SN models, how the SNe were subsequently evolved, and how spectra were obtained from their blast profiles. We study explosions in dense envelopes in Section 3 and explosions in diffuse environments in Section 4. Fallback and black hole formation are examined in Section 5, and we conclude in Section 6.
2. Numerical Algorithm
We compute light curves and spectra in four stages. First, 150 - 500 stars are evolved from the beginning of the main sequence to the end of He burning and onset of the PI in the GENEVA code. We then explode the star in the Kepler code, solving for all nuclear burning and evolving the shock to just below the surface of the star. Shock breakout and expansion into the wind are then modeled with the RAGE radiation hydrodynamics code. Finally, we post process blast profiles from RAGE with the SPECTRUM code to compute spectra and construct light curves.
2.1. GENEVA Stellar Evolution Model
We evolved 150, 200, and 500 stars in the latest version of the GENEVA code (Hirschi et al., 2004; Eggenberger et al., 2008). Our simulations include mass loss and stellar rotation, which are crucial to the evolution of very massive stars. We employ the theoretical prescription for mass loss from O stars of Vink et al. (2001) (which have been empirically corroborated by Mokiem et al., 2007) up to the onset of the Wolf-Rayet (WR) phase. The WR phase is taken to begin when the H mass fraction at the surface of the star falls below 5% when 104 K, at which point we transition to empirical mass loss rates (Nugis & Lamers, 2000). We describe our prescription for mass loss in greater detail in Yusof et al. (2013). Three of our four models (h150, h200, h500s4) have an initial velocity, 0.4 , where is the critical (breakup) velocity. This corresponds to an average velocity on the main-sequence of 318.9, 333.4 and 116.8 km/s for the 150, 200 and 500 stars, respectively. The fourth model (h500s0) is non-rotating. The main effects of rotation are included in our calculations: centrifugal support, mass-loss enhancement and especially mixing in radiative zones (Maeder, 2009). The 150 and 200 stars have 0.14 corresponding to those of the Small Magellanic Cloud. The two 500 stars have metallicities 0.43 corresponding to those of the Large Magellanic Cloud. By the end of their evolution in GENEVA all four stars have shed their hydrogen envelopes and are essentially bare He cores.
2.2. KEPLER Burn Models
The star is evolved from the end of core He burning through explosive O and Si burning and then almost to shock breakout in the one-dimensional (1D) Kepler code (Weaver et al., 1978; Woosley et al., 2002). The explosion is the natural endpoint of stellar evolution in Kepler and is not artificially triggered. Its energy is set by how much O and Si burns, which takes 20 s. We calculate energy production with a 19-isotope network up to the point of oxygen depletion in the core and with a 128-isotope quasi-equilibrium network thereafter. The number of mass zones in the models varied from 1000 - 1200 and was always sufficient to resolve the SN and surrounding star. We summarize the properties of our PI SNe in Table 1. Their explosion energies vary from 3.7 to 65 B (1 B = 1051 erg). The s0 and s4 designations in Table 1 refer to non-rotating and rotating stars, respectively.
2.3. RAGE Simulations
| run | (B) | () | |||
|---|---|---|---|---|---|
| h150 | 150 | 109 | 42.0 | 9.2 | 0.14 |
| h200 | 200 | 130 | 65.0 | 39.2 | 0.14 |
| h500s0 | 500 | 94 | 3.7 | 2.2 | 0.43 |
| h500s4 | 500 | 76 | 10.4 | 0.18 | 0.43 |
Shock breakout and expansion into the wind is modeled with the radiation hydrodynamics code RAGE (Gittings et al., 2008). Our models include multi-species advection, energy deposition by radioactive decay of , grey flux-limited diffusion with LANL OPLIB opacities111http://aphysics2/www.t4.lanl.gov/cgi-bin/opacity/tops.pl (Magee et al., 1995), and 2-temperature physics. We evolve mass fractions for the 15 even-numbered elements that are predominantly synthesized by PI SNe. Both the self-gravity of the ejecta and the gravity of any object formed at the center of the grid due to fallback are included in our simulations. Self-gravity is important when the shock is still deep inside the star because the potential energy of the ejecta is close to its kinetic, internal and radiation energies. Failure to include it causes the shock to break out of the star with far higher energies and luminosities than it actually has. Point-mass gravity is important in weak explosions in which much of the star may remain gravitationally bound and later fall back in on itself.
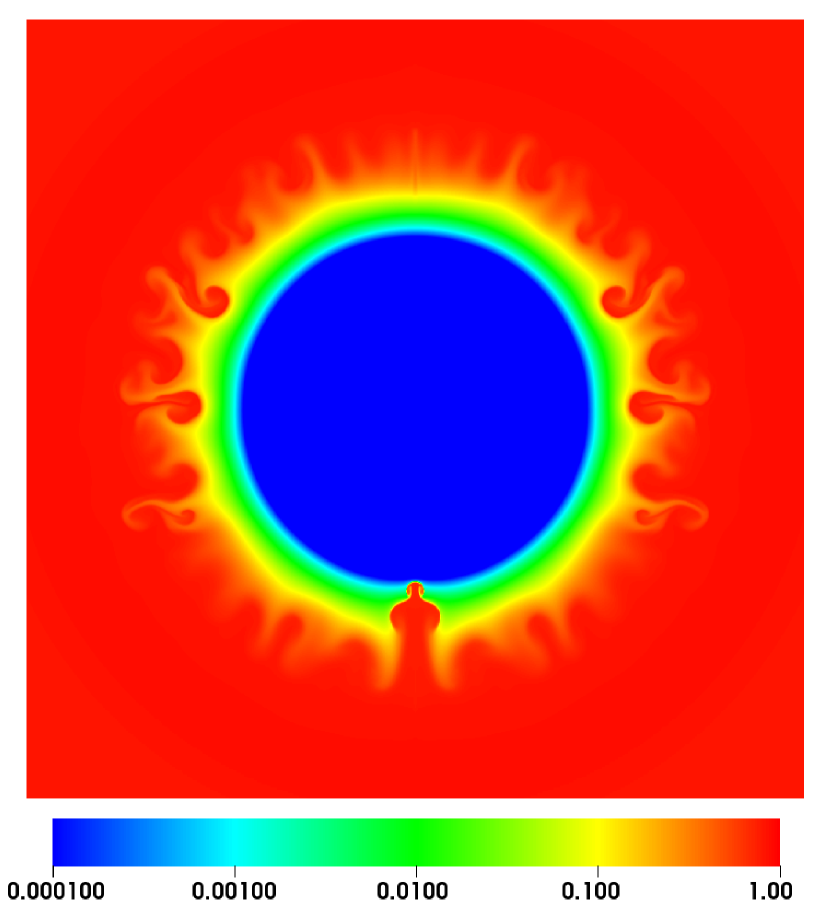
We evolve the explosions on a 1D spherical coordinate grid in RAGE. Several lines of evidence now show that internal mixing in PI SNe, which would break the spherical symmetry of the explosion, usually does not occur (and is minor if it does; Joggerst & Whalen, 2011; Chen et al., 2011, 2014b, 2014a), in contrast to core-collapse explosions in which mixing is rampant prior to shock breakout (e.g., Fryer et al., 2007a; Joggerst et al., 2010). We have run preliminary 2D CASTRO simulations (Almgren et al., 2010) of the explosions in this study that show that if mixing occurs it is minimal, and mostly confined to the O shell (Fig. 1). This is because the stars have shed their hydrogen envelopes prior to the explosion so breakout occurs from a He core, whose radius is just 1% that of the original star. Instabilities, if they form, have little time to grow before the shock reaches the surface. This may not always be the case; stellar rotation has now been shown to induce dynamical instabilities into the explosion in 2D PI SN models (Chatzopoulos et al., 2013).
The RAGE mesh has 100,000 zones and a resolution of 1.2 106 cm for the h150 and h200 models and 2.0 and 6.0 105 cm for the h500s0 and h500s4 models, respectively. Outflow and reflecting boundary conditions for gas and radiation are imposed on the inner boundary, respectively, and outflow conditions are set on both flows at the outer boundary. Because no compact objects are present in the Kepler profiles when they are ported to RAGE we set the point mass at the inner boundary to zero at the start of the run. Any fallback to the center of the grid is then tallied and incorporated into the point mass, whose gravity can evolve during the simulation.
We allocate 25% of the grid to the ejecta at setup. The initial radius of the shock varies with the star but is typically 50 - 80% that of the He core. Up to two levels of adaptive mesh refinement (AMR) are applied in the initial interpolation of the profiles onto the grid and then during the simulation. To speed up the run and accommodate the expansion of the ejecta we resize the mesh by a factor of 2.5 every 106 time steps or when the radiation front has crossed 90% of the grid, whichever happens first. The initial time step on which the new series evolves scales roughly as the ratio of the outer radii of the new and old grids. We again apply up to 2 levels of refinement when mapping the explosion to a new grid and then throughout the run. The explosion is evolved out to 3 yr, until its luminosity has fallen below detection limits.
Radiation energy densities are not explicitly evolved in the Kepler models so we initialize them in RAGE by
| (2) |
where 7.564 10-15 erg cm-3 K-4 is the radiation constant and is the gas temperature. Also, since the gas energy in Kepler includes contributions by ionization states of atoms, we unambiguously construct the specific internal energy from with
| (3) |
where 1.2472 108 erg gm-1 K-1 is the specific heat of the gas.
2.4. SPECTRUM
To calculate a spectrum we first sample the RAGE radiation energy density profile from the outer boundary inward to find the position of the radiation front, which we take to be where rises above 10-4 erg/cm3. This corresponds to a radiation temperature that is slightly higher than that of the surrounding wind (0.01 eV, or 116 K), so that the outer layers of the front can be distinguished from the wind. We then determine the radius of the 40 surface by integrating the optical depth due to Thomson scattering inward from the outer boundary ( 0.288 for pristine H and He gas). This yields the greatest depth in the flow from which most of the photons can escape because is the minimum opacity that the photons would encounter.
Densities, velocities, temperatures and species mass fractions are then extracted from the RAGE profile and interpolated onto a 2D grid in and in SPECTRUM (Frey et al., 2013), whose inner and outer boundaries are zero and 2.0 1017 cm, respectively. We allocate 800 uniform zones in log radius from the center of the grid to the 40 surface. The region from the 40 surface and the radiation front is then partitioned into 6200 uniform zones in radius. The wind between the radiation front and the outer boundary is divided into 500 uniform zones in log radius for a total of 7500 radial bins.
The data in each radial bin is mass averaged so that SPECTRUM captures any sharp features in the RAGE profile. The SPECTRUM grid is uniformly discretized into 160 bins in cos from -1 to 1. Our choice of mesh ensures that regions of the flow from which photons can escape into the ISM are well resolved while those from which they cannot are only lightly sampled. Calculating spectra in this manner allows us to determine how a dense wind shrouding the star absorbs radiation from the explosion, an effect not considered in earlier studies. Light curves are constructed from 200 - 300 spectra. The spectra are usually logarithmically spaced in time from shock breakout to 3 yr.
2.5. Circumstellar Environment
 |
 |
 |
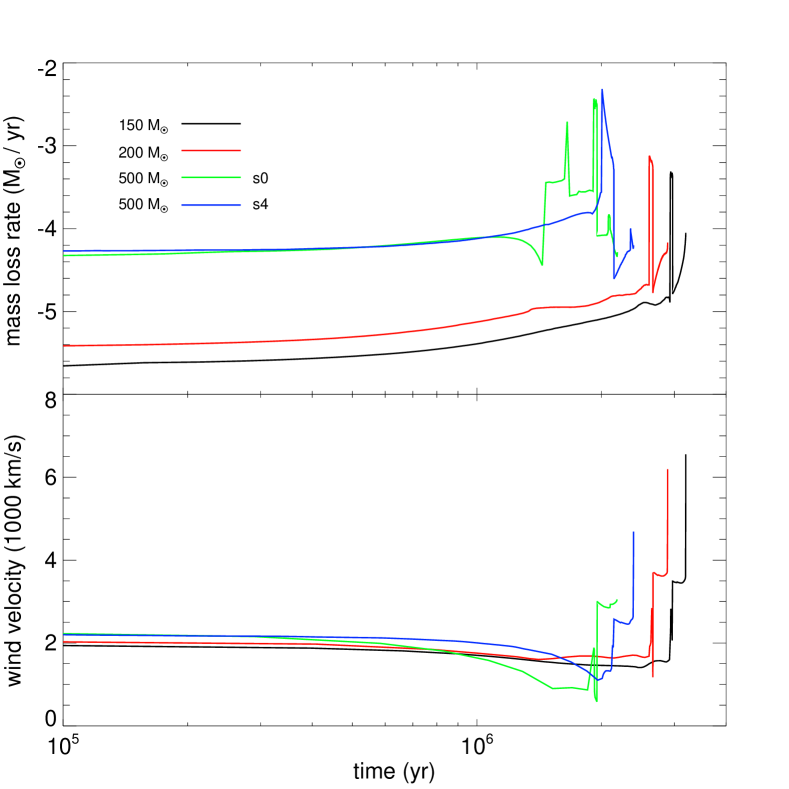
We show mass loss rates and wind velocities for the four progenitors in Fig. 2. The wind velocity, which is taken to be the escape velocity from the surface of the star and varies from 1000 - 6000 km s-1, is time-dependent because the radius of the star, which is also a product of our stellar evolution calculations, evolves over time. The composition of the wind is primordial, 76% H and 24% He by mass. The mass loss rates and wind speeds for the stars are fairly constant for their first 1 - 2 Myr but they all exhibit strong outbursts at the end of their lives.
| () | ( yr-1) | (km s-1) |
|---|---|---|
| 150 | 10-4.8 | 3500 |
| 200 | 10-4.8 | 3600 |
| 500s0 | 10-4.1 | 3000 |
| 500s4 | 10-4.4 | 2500 |
As shown by Mesler et al. (2012) with the ZEUS-MP code (Whalen & Norman, 2006), outbursts and strong winds in principle can form quite complex structures around the star. The collision of the ejecta with such structures could strongly affect its luminosity. But the SN expands to at most 0.3 pc before becoming dim so it is only the mass loss in the few years following the final outburst of each star that sets the circumstellar profile out to this radius. As shown in the bottom panel of Fig. 2, wind speeds for all four stars are relatively constant in the 10 - 100 yr after the outburst. Mass loss rates immediately after the ejections are also relatively constant over these times. The stellar envelope is therefore well-approximated by the usual power-law density profile
| (4) |
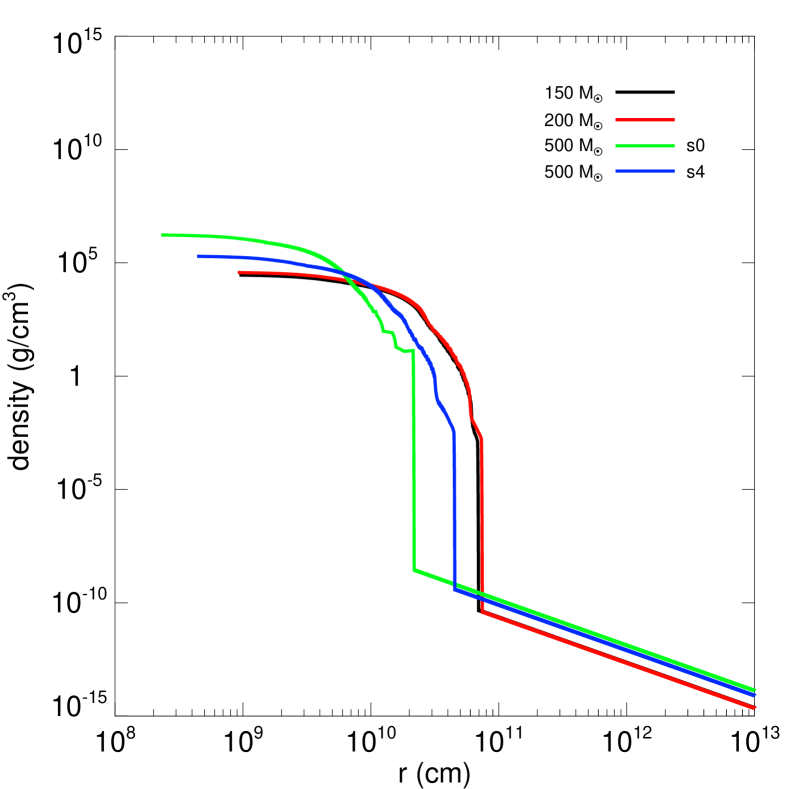
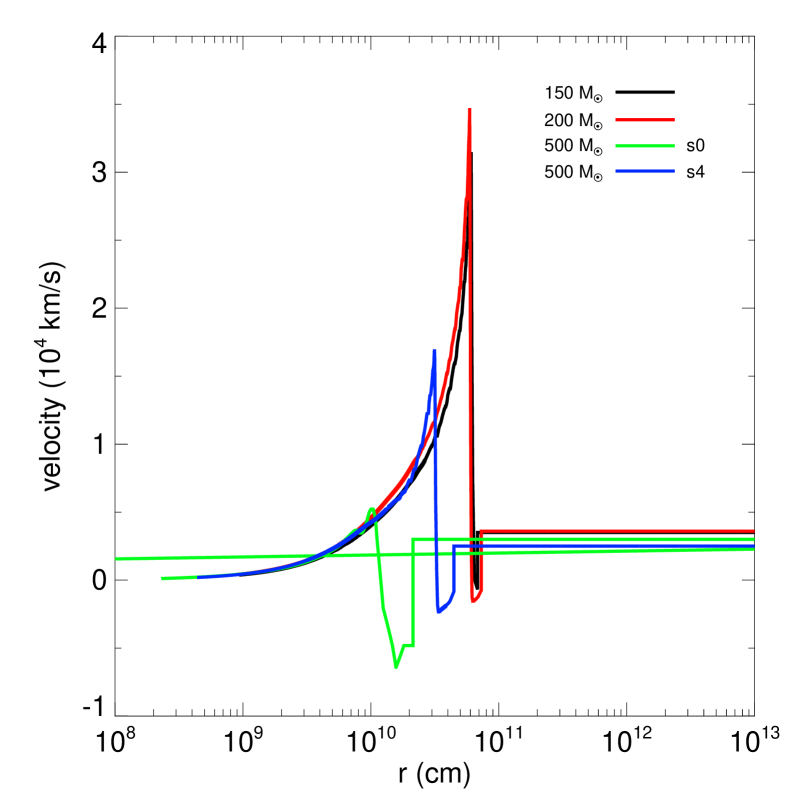
where and are the wind speed and mass loss rate just after the ejection, respectively. We summarize and in Table 2. To soften the density drop at the surface of the star (and thus prevent numerical instabilities at shock breakout) we bridge the star and the wind by an density profile. We show density and velocity profiles for the shock, the star, and the surrounding wind in Fig. 3.
We consider two limiting cases for the supernovae: explosions in the dense winds just described and explosions in diffuse envelopes in which the outburst clears gas from the vicinity of the star. In this latter case we use Eq. 4 for the wind with 1000 km s-1 and an chosen to guarantee that 2 - 3 10-18 g cm-3 at the bottom of the density bridge from the surface of the star. We examine explosions in heavy winds first, taking the h150 PI SN as a fiducial case.
3. Explosions in Dense Envelopes
 |
 |
 |
3.1. Shock Breakout


Velocity, temperature and density plots for shock breakout from the surface of the star are shown in Fig. 4. Prior to breakout the shock is not visible to an external observer because of scattering by free electrons in the upper layers of the star. When the shock breaks through the surface of the star it abruptly accelerates in the steep density gradient there, as shown in the velocities at 0.46 s and 2.2 s. At the same time, photons that were previously trapped in the shock and simply advected along by the flow now break free of it, and a radiation pulse propagates into the wind. The radiation front is visible as the flat plateau in temperature ahead of the shock at 2.2 s and 3.9 s. The temperature of the plateau ( 500 eV at 2.2 s and 300 ev at 3.9 s) is the temperature to which the radiation heats the wind, not the shock itself, which is much hotter ( 2 keV). The temperature of the plateau falls over time because the shock expands and cools and its spectral peak shifts to lower energies.
The breakout pulse is usually thought to be approximately the light crossing time of the star (here, a few seconds for the compact He core), but in reality it is somewhat longer because the photons do not instantly decouple from the shock. Instead, the pulse blows off the outermost layers of the star at very high velocities, as shown at 2.2 and 3.9 s. At 3.9 s the shock is visible in the density profile at 9.5 1010 cm. The wispy outer layers of the star have been driven ahead of the shock by the radiation to 1.4 1011 cm. The shock drives this radiative precursor into the wind until it cools, dims, and can no longer do so, as we show later. Radiation/matter coupling is especially strong in breakout from compact cores because the temperature of the shock is so high, twice that of breakout in the z-series PI SNe in Whalen et al. (2013a), because the shock has done less work on its surroundings. We also note that because the opacities are frequency dependent, photons break free of the flow at different times at different wavelengths. This effect also lengthens the pulse in time (Bayless et al., 2014).
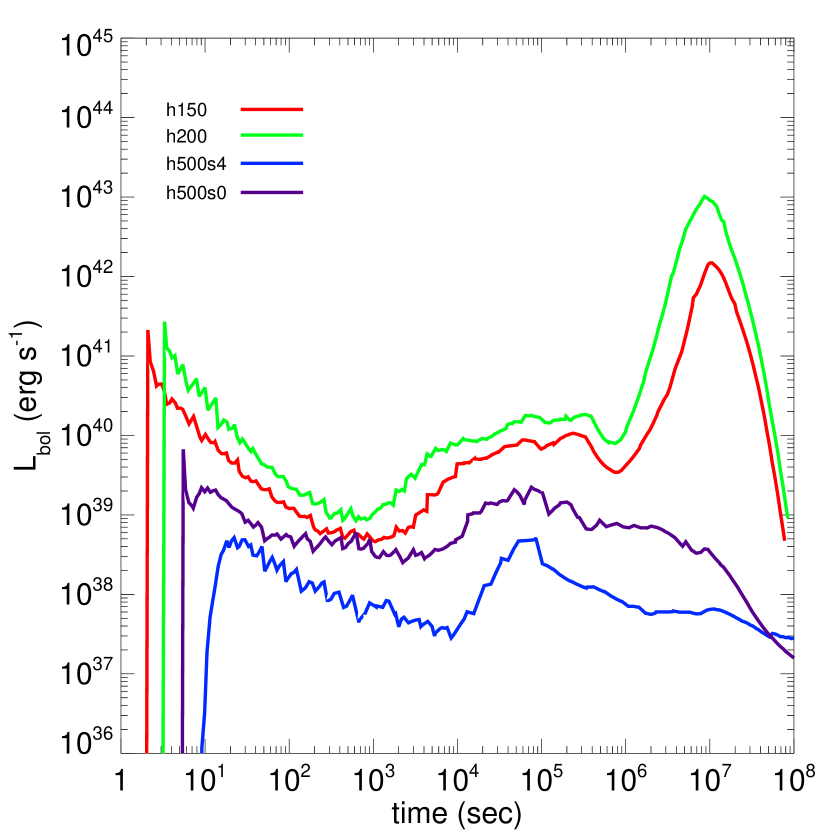
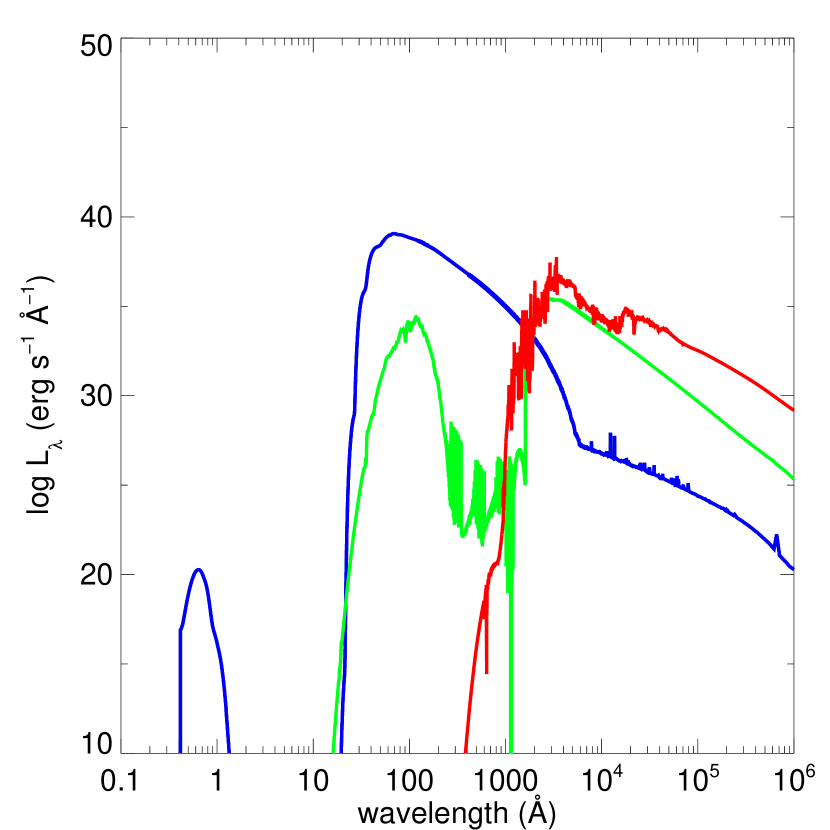
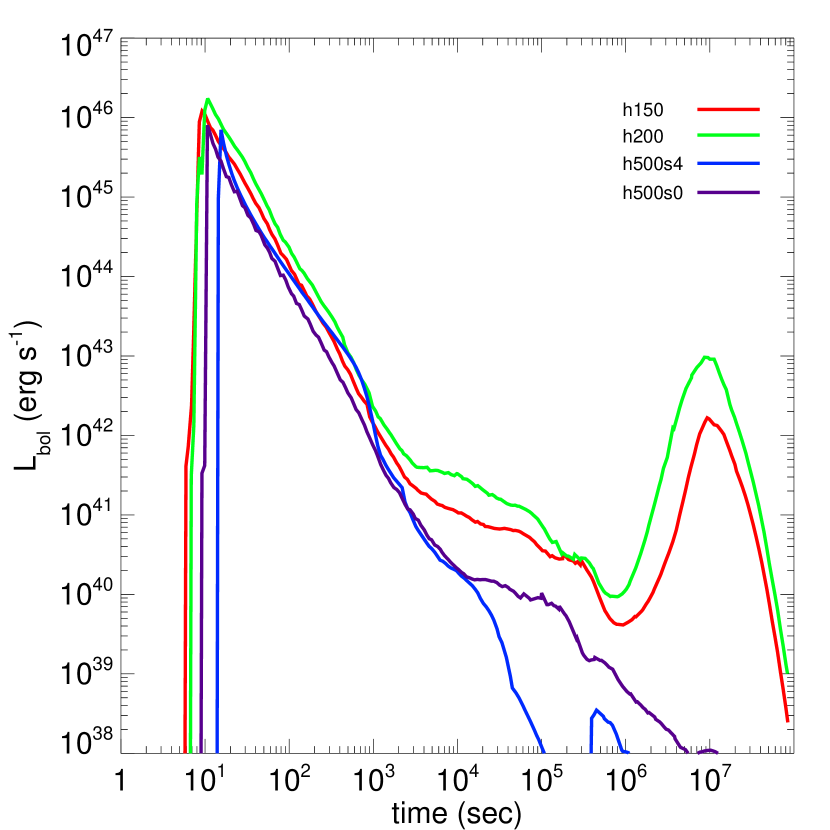
In most SNe the breakout transient is composed primarily of x-rays and hard UV, and in Type Ia and II explosions its luminosity is 1042 - 1045 erg s-1. But the dense wind quenches most of the transient in our first fours explosions, limiting its initial brightness to 1039 - 1041 erg s-1 as shown in the left panel of Fig. 5. Here, the initial flux is mostly UV and optical, with a few hard x-rays as shown in the spectrum at 2.2 s in the right panel of Fig. 5. The radiation pulse briefly ionizes part of the envelope at breakout which then rapidly recombines as the transient dies down, partially shuttering subsequent radiation from the fireball from 2 s to 103 s as shown in the spectra in the right panel of Fig. 5.
At 234 s the only emission from the fireball that escapes the dense shroud is optical, IR, and some UV. But the luminosity again begins to rise as the shock grows in radius and more of its photons escape the wind, as shown from 103 s to 105 s. As the wind beyond the shock becomes thin the UV emission rises again, as shown in the spectrum at 1.40 105 s. Thus, there is an initial, partial breakout of radiation from the envelope at shock breakout and then a second, more protracted breakout as the wind becomes optically thin to the shock. Note that peak initial breakout luminosities rise with explosion energy, and that breakout happens later in more massive progenitors with lower explosion energies because it takes longer for the shock to reach the surface of the star.
3.2. Intermediate / Later Stages of the SN
As the SN expands it plows up the wind and briefly continues to drive the radiative precursor ahead of it. But by 133 s this precursor has collapsed back to the shock, which has cooled to the point that it can no longer sustain the precursor as shown in Fig. 6. As the fireball plows up more wind a reverse shock begins to form, which is visible as the small density bump just behind the shock at 9 1013 cm. This shock partially detaches from the forward shock and begins to step back through the flow in the frame of the ejecta. As it does, the gas that is heated by the reverse shock radiatively cools, and the shock loses pressure support and retreats back into the forward shock. As the forward shock continues to plow up the envelope the cycle repeats. This is the classic radiative instability that has been well studied by Chevalier & Imamura (1982) and Imamura et al. (1984), and the fluctuations in the postshock gas temperatures due to the oscillation of the revere shock are what cause the ripples in the bolometric luminosities from 104 - 105 s.
In a multidimensional simulation, the interface between the ejecta and the envelope in which the radiative instability occurs would likely be broken up by Rayleigh-Taylor (RT) instabilities, and this might reduce or remove altogether the fluctuations in the light curve over this time interval. In principle, such instabilities could also disrupt the structures emitting most of the radiation from the shock and alter the luminosity of the explosion. But because the ripples themselves have small amplitudes, it is not likely that the mean luminosity would change much in their absence. After 105 s the expansion of the ejecta is nearly self-similar.
By a few 106 s the SN ejecta has expanded to the point where its photosphere has descended down to the warm layer, and the h150 and h200 light curves exhibit the classic rebrightening associated with radioactive decay in PI SNe that synthesize large masses of . But rebrightening happens at earlier times in our explosions than in non-rotating Pop III PI SNe, whose progenitors retain their mass. This is due to the lower intervening masses between the layer and surrounding wind, and hence shorter radiation diffusion times. The h200 SN has higher peak luminosities than h150 because it makes four times the , 39 versus 9 . The h500 light curves do not exhibit prominent rebrightening because they create far less , and in the s0 explosion it all falls back into a central BH, as we discuss later. We note that even though the h500 PI SNe do not rebrighten, they do exhibit extended, dim emission due to shock heating as they propagate through the envelope, which lasts for nearly three years in the h500s4 explosion.
3.3. Optical/NIR Light Curves
NIR surveys are required to detect SNe prior to the end of reionization ( 6) because flux blueward of the Lyman limit at higher redshifts is absorbed by the neutral IGM. This also restricts detections of such events in the optical to 6. All-sky surveys offer the best prospects for detecting large numbers of high- SNe because their large survey areas can compensate for low star formation rates (SFRs) at early epochs (e.g., Fig. 3 of Whalen et al., 2013h). But even 30-m class telescopes with narrow fields such as JWST, the Thirty-Meter Telescope (TMT), the Giant Magellan Telescope (GMT) and the European Extremely Large Telescope (E-ELT) are still expected to detect Pop III SNe in appreciable numbers (Hummel et al., 2012). We now examine detection limits in redshift for our PI SNe in the NIR for SNe at 6 and in the optical for events below this redshift.
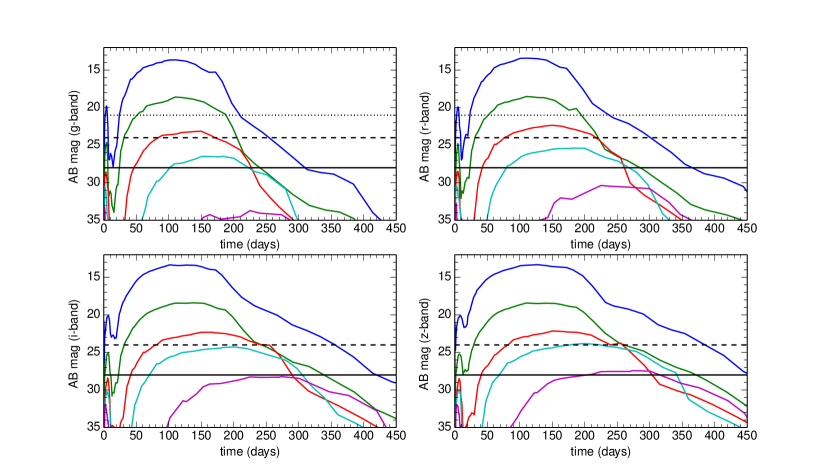
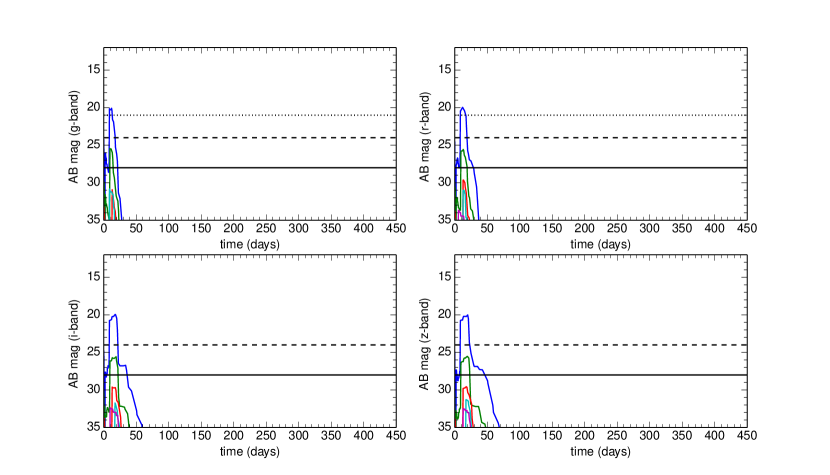
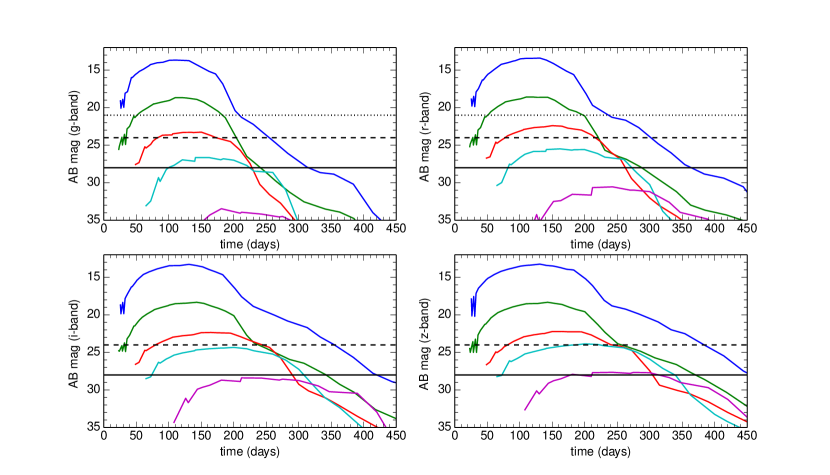
We show g, r, i and z band light curves for the h200 and h500s0 explosions in dense envelopes in Figures 7 and 8, together with sensitivity limits for PTF, Pan-STARRS and LSST. The h200 light curves all exhibit a initial, short-lived peak corresponding to the post-breakout expansion and cooling of the fireball followed by a second brighter and much longer peak due to rebrightening. This explosion will be visible to PTF out to 0.1, to Pan-STARRS out to 0.5 - 1, and to LSST out to 2. On the other hand, the h500s0 PI SN is a much dimmer event, only being marginally visible to PTF and Pan-STARRS out to 0.01 and to LSST out to 0.1. These two fiducial cases underscore the fact that PI SNe of non-zero metallicity stars can be either very bright or dim events, and that in the latter case some of these explosions could be hidden in a wide range of SN classes.
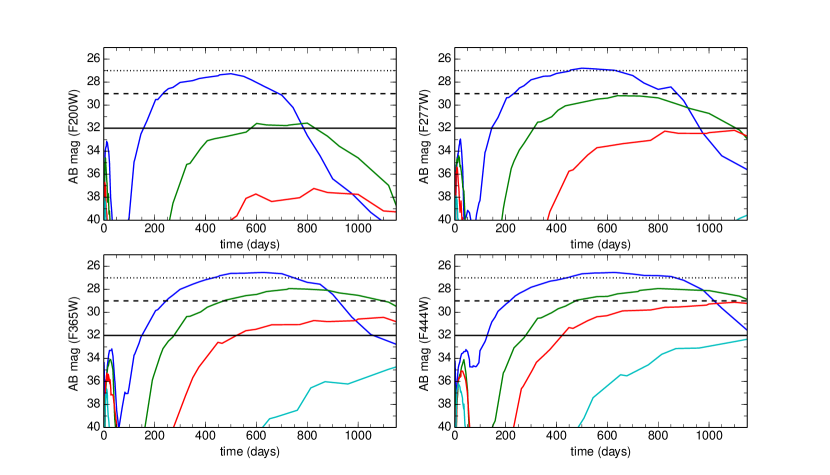
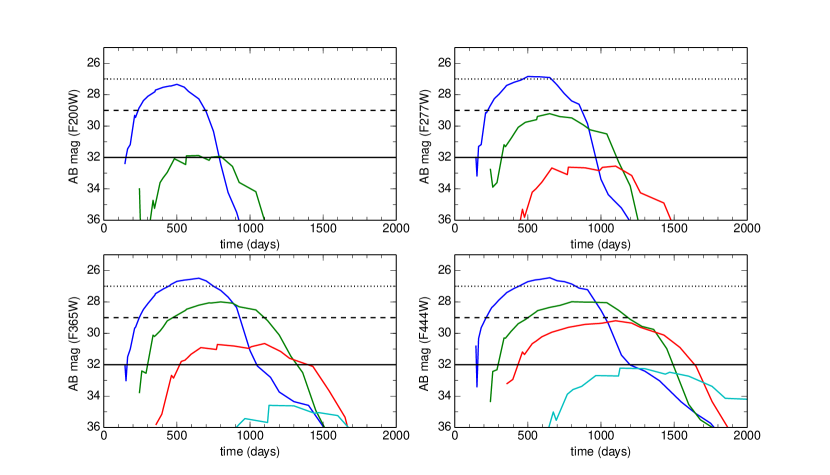
NIR light curves at 2 - 4 m for the h200 run for 4, 7, 10, and 15 are shown in Fig. 8. We find that this explosion will be visible to WFIRST out to 4 - 10 and to JWST out to 10 - 15, the era of first galaxy formation. Some numerical models predict that most massive stars at this latter epoch will be contaminated by metals from the first generations of stars, so these events could be used to probe the stellar populations of the first galaxies. On the other hand, we find that peak AB magnitudes in the NIR for the more massive h500s0 and h500s4 explosions are well below even JWST detection limits at 4.
4. Explosions in Diffuse Envelopes
4.1. Shock Breakout
 |
 |
 |
Velocity, temperature and density profiles for shock breakout in a diffuse wind are shown for the h150 PI SN in Fig. 9. We first note that ambient densities in this model are five orders of magnitude lower than those in the dense envelopes. The initial effect of the much lower density is that the shock heats the surrounding gas to higher temperatures after breakout, nearly 1 keV, and it remains hotter for longer times. The shock cools more rapidly in dense winds due to the work it performs on its surroundings. The shock therefore has a harder spectrum when it breaks out into diffuse envelopes and, as we show later, far higher breakout luminosities because the wind at the base of the bridge is basically optically thin. In these envelopes, shock breakout and radiation breakout occur at the same time and the shock reaches peak luminosity before reaching the bottom of the bridge. Blowoff and the formation of a radiative precursor is again visible in the broken slope of the velocities near their peak at 6.18 and 7.69 s.
 |
 |
 |
 |
 |
 |
4.2. Early and Late Evolution
We show the early and later evolution of the h150 explosion in the left and right panels of Fig. 10. Because of the lower ambient densities, radiation from the shock can sustain the precursor for somewhat longer times, out to 631 s as shown in the density and velocity profiles. After the collapse of the precursor, densities in the shock fluctuate and cause the ripples in the bolometric luminosities out to 1000 s in Fig. 11. The fluctuations here are much stronger because of the lower densities ahead of the shock. They are absent in the h500s0 light curve because it has a much lower explosion energy. As we discuss in the next section, most of the star remains gravitationally bound in this SN, and only its outer layers are blown off. There is not enough flux from the shock to drive fluctuations in the precursor.
After a few days the expansion of the flow is again mostly self-similar, as shown in the right panels in Fig. 10. The SN becomes a free expansion sooner in diffuse envelopes. All four bolometric light curves exhibit the same rebrightening at about a week as in the previous light curves, and for the same reason: the photosphere recedes to deeper, denser and warmer regions of the flow whose structure remains unaffected by the envelope. The h150 and h200 PI SNe are brighter at late times because they produce much more than the two h500 explosions (and because the created by h500s0 again falls back into a black hole, as we discuss below).
4.3. Light Curves
Because the shock breaks out into much lower densities, peak bolometric luminosities range from 7 1045 to 2 1046 erg s-1 for these SNe as shown in Fig. 11. They are about four orders of magnitude brighter than those in dense envelopes. rebrightening is again evident in the h150 and h200 PI SNe but not in the h500 explosions for the reasons discussed above. It reaches the same peak luminosity in dense and diffuse envelopes, and at about the same times. The presence of a dense wind therefore has little effect on rebrightening at later times because the swept up material is at too low a density to impede the escape of photons.
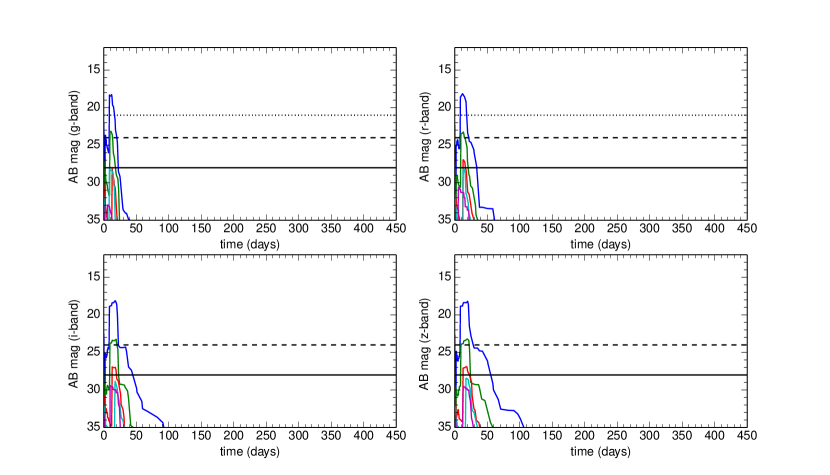
We show g, r, i and z band light curves for the h200 and h500s0 explosions in diffuse envelopes in Figures 12 and 13. The h200 light curves again all have a initial, short-lived peak due to the early expansion and cooling of the ejecta, which we do not show in the plots. We instead focus on the much brighter and longer lived rebrightening phase, which reaches peak magnitudes that are nearly identical to those in the dense winds discussed in the previous section. Thus, although the dense shroud quenches bolometric luminosities at early times it has no effect on them at later times or on their duration. We again find that the h200 PI SN will be visible to PTF out to 0.1, to Pan-STARRS out to 0.5 - 1, and to LSST out to 2. The absence of the dense wind conversely does not enhance the brightness of the h500s0 explosion; it is still a much dimmer event, again only being visible out to 0.01 to PTF, 0.1 to Pan-STARRS and 0.5 to LSST.
We find that whether the envelope is dense or diffuse has little impact on detection limits in the NIR for the h200 explosion. NIR light curves at 2 - 4 m for h200 at 4, 7, 10, and 15 are shown in Fig. 12. We again find that this SN will be visible to WFIRST out to 4 - 10 and to JWST out to 10 - 15, the era of first galaxy formation. The low-density wind likewise does not improve detection limits for the more massive h500s0 and h500s4 PI SNe in the NIR, they are still well below even the sensitivity of JWST at 4.
5. Fallback and Black Hole Production
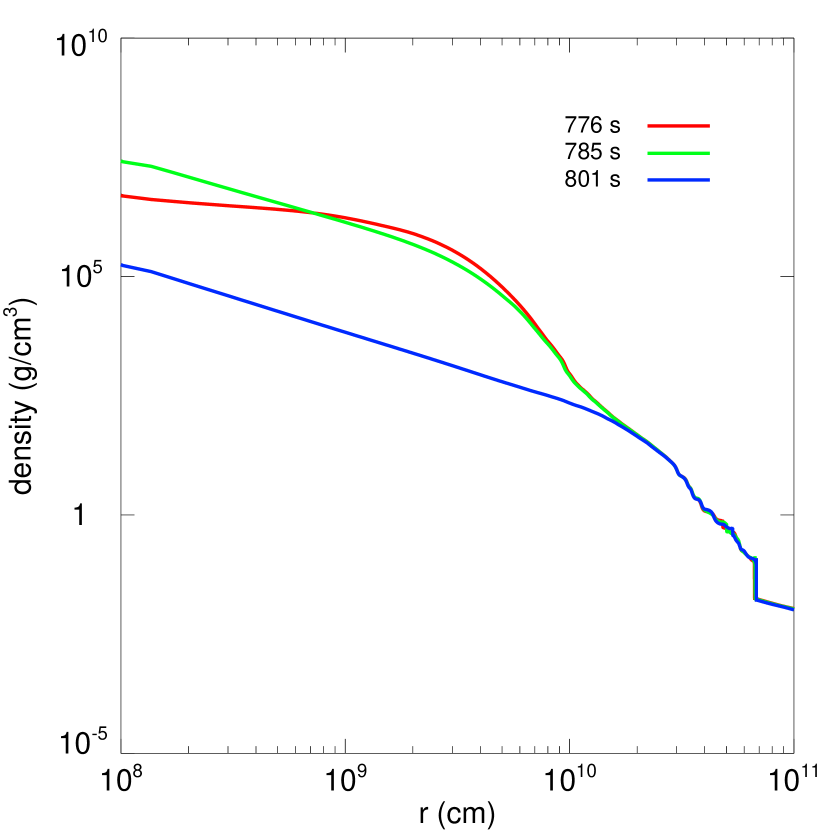
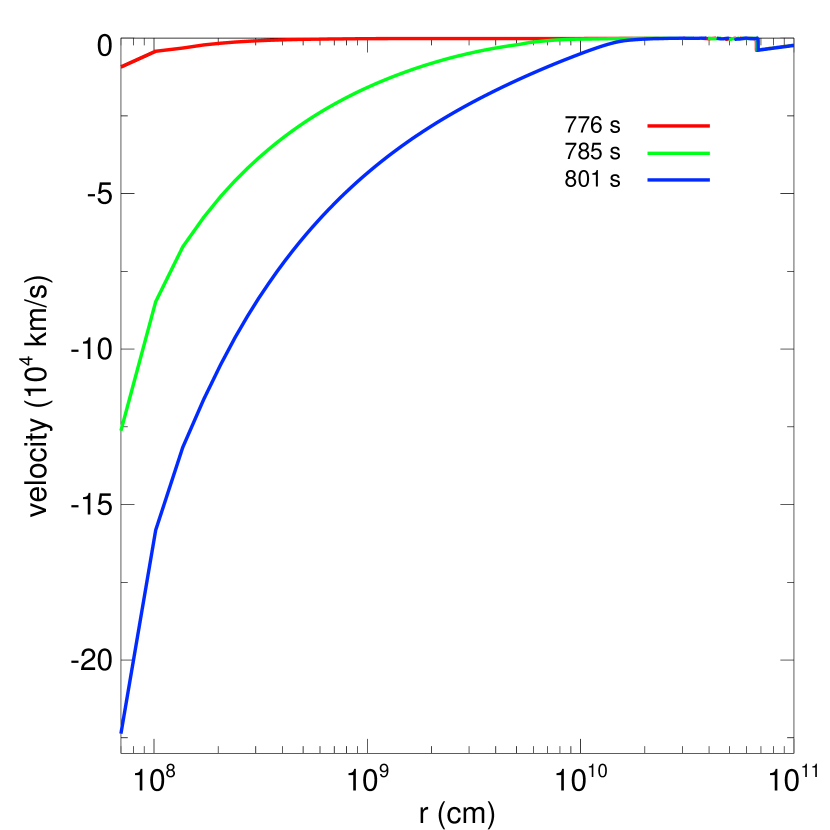
PI SNe are usually thought to completely unbind the star and leave no compact remnant. Here, we report that some PI SNe do create massive black holes. In Fig. 14 we show density and velocity profiles at the center of the h500s0 explosion, which is the weakest of the set. Because this SN has a net energy of only 3.7 1051 erg, most of the material interior to 1011 cm remains gravitationally bound. At 776 s it has come to a halt, and the deepest regions begin to fall back to the center of the grid. By 785 s 30 has fallen back to the center at peak velocities of 12,000 km s-1 and infall rates of 15 s-1, as shown in Fig. 15. By 801 s, 90 has collapsed to the center of the grid. In our model we neglect radiative feedback from the nascent neutron star and black hole, which could regulate fallback rates and contribute to the luminosity of the explosion, so these infall rates should be taken to be upper limits.
The formed during the explosion quickly collapses to form a neutron star as infalling material from above crushes down onto it. Could this weak PI SN create the conditions for a post outburst core-bounce SN? The fate of the infalling mass depends upon the accretion rate onto the newly formed neutron star (Fryer, 1999; Fryer et al., 2012). The accretion rate determines the ram pressure that the SN engine must overcome to drive an explosion. If it is too high, the convective engine is unable to push off the accreting material, and the neutron star gains mass until it collapses to form a black hole. For typical 15 stars, the accretion rate during the engine phase drops below 1 s-1 in the first 100 ms. When it drops below this value, strong SN explosions are expected (Fryer, 1999). In more massive stars, the accretion rate never falls below 1 s-1 (in a 25 star it drops to just above 1 s-1 in the first second and to 2.5 s-1 in a 40 star). These systems are usually thought to have weak or no SN explosions (Fryer, 1999; Fryer et al., 2012). In our model, the accretion rate peaks at 10 s-1, so the neutron star will almost certainly collapse to a black hole without an explosion.
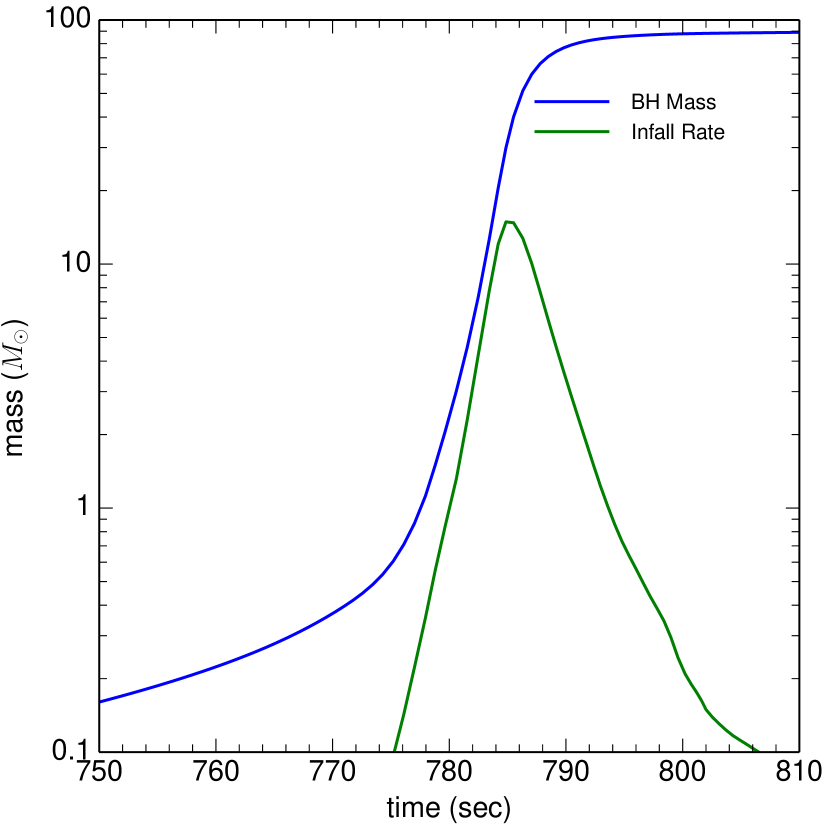
However, if the infalling material has enough angular momentum, this system has accretion rates that are high enough to power a standard collapsar gamma-ray burst (GRB; Popham et al., 1999). If a GRB is produced, a secondary explosion with a distinctive gamma-ray signature might accompany the PI SN. We do not expect the h500s0 model to produce a GRB because its progenitor has no rotation. By 801 s, fallback is complete, and a 90 black hole has formed at the center of the grid.
6. Conclusion
It is clear that there is far more variety to PI SNe and their light curves than previously thought, and that Pop III PI SNe can no longer be considered to represent the population as a whole, particularly at higher metallicities. We find that non-zero metallicity PI SNe in general are dimmer than Pop III events and are only visible at lower redshifts. But some of them, like the h150 and h200 SNe, will be bright enough to be detected at the earliest epochs at which they can occur, the formation of the first galaxies, and can be used to probe the properties of stars in those galaxies. Others, like the h500 explosions, are only visible in the local universe and could be mistaken for a variety of dim CC SNe. Metals lead to drastic departures from Pop III stellar evolution and final structures for the star, and they also give rise to complex circumstellar media. Because the structure of the ejecta and its surroundings can both radically alter the light curve of the explosion, PI SNe at near-solar metallicities cannot be approximated by simply stripping the H envelope from a Pop III star and then exploding it, as has been done in previous studies. The effects of metallicity on the evolution of the star from birth and its ambient medium at later times must be taken into account to properly identify these events in the local universe.
While our prescription for mass loss from our massive PI SN progenitors is a reasonable one, it should not be considered to be comprehensive. There could be violent episodes of mass loss prior to explosion due to vigorous convection or other mechanisms (e.g., gravity waves; see Quataert & Shiode, 2012). Common envelope evolution in binaries is often observed with massive stars and can lead to highly anisotropic mass ejections (Sana & Evans, 2011; Chini et al., 2012). Besides radically altering the environment of the blast, and hence its light curve, these processes can also change the evolution of the star itself. Furthermore, although we do consider explosions in dense envelopes, these envelopes do not contain all the mass lost by the star over its life, and if this loss was isotropic it would present much higher optical depths to the SNe than those considered here. However, the mass loss is likely anisotropic (i.e., Passy et al., 2012), and large solid angles in the sky could have fairly low optical depths to the SN shock. Our luminosities should be considered to be upper limits to the those for such events.
We emphasize that because only a small subset of the PI SNe that are possible have been studied to date, it is premature to dismiss them as candidates for a few recent superluminous SNe (SLSNe) just because their light curves and spectra do not match those of Pop III explosions (e.g., Dessart et al., 2013; Nicholl et al., 2013) (see also Dessart et al., 2012, for an alternate interpretation of SN 2007bi). For example, we have not examined 0.1 PI SNe crashing into dense shells ejected by the star prior to its death. Similar but less energetic Type IIn events have been found to have rapid rise times consistent with SLSNe (Whalen et al., 2013b). Had the progenitors in this study ejected massive shells at later times that were within reach of their ejecta, they might have had light curves that are consistent with the superluminous events in Nicholl et al. (2013), and they may have been observable at much higher redshifts than the explosions in this paper. Such collisions are now being studied with RAGE. The large number of possibilities for PI SN progenitor structure and envelope also highlights the difficulty of matching any one PI SN candidate to current models (see also Bayless et al., 2014). That said, we note that the bolometric light curve for SN 2007bi has now been well reproduced by the PI SN of a low-metallicity 250 star, although it remains to be seen if its spectra are also a match (Kozyreva et al., 2014a).
Our weak pair-instability supernovae, in which much of the falls back, produce dim, short-duration outbursts. A growing list of dim supernovae have been observed, often being classified as thermonuclear flashes on white dwarfs, the so-called ”.Ia supernovae” because they are 1/10th the strength of normal supernovae (e.g., Drout et al., 2013). Many of these events have been explained as CC SNe (Fryer et al., 2007b, 2009; Moriya et al., 2010; Kleiser & Kasen, 2014). But our models show that some PI SNe could also be masquerading as dim supernovae. If PI SNe can explain both superluminous and dim supernovae, it is possible that, under the right conditions (explosion energy and circumstellar medium), they could be hidden in a wide variety of supernova classes.
Rotation can have the same effect as metallicity on PI SN light curves. Yoon et al. (2012), Chatzopoulos & Wheeler (2012), and Chatzopoulos et al. (2013) find that Pop III stars that rotate at 50% of the breakup velocity at their equator can lose mass and explode as PI SNe at 85 - 135 . They, like the stars in this paper, shed their H envelopes and die as bare He cores with explosion energies and breakout radii that are similar to those here. They also can explode in dense winds or shells. We find that these too can range from being rather dim events to being visible in the era of first galaxy formation (Whalen et al., 2006; Smidt et al., 2014).
Two of our stars have metallicities slightly above the maximum predicted for PI SN progenitors by some studies (0.33 ; Langer et al., 2007) and, for now, should be considered to be upper limits for the metallicities of these events. There is a degeneracy between progenitor mass, metallicity, mass loss rate and rotation in light curves for these PI SNe that makes it difficult to predict their frequency. For example, a star with an initial mass below 300 and a lower mass loss rate could end up with a final mass and internal structure similar to that of one of our 500 models and explode with nearly the same energy. Given these degeneracies, this type of explosion might be more common than would be suggested by the number of 400 - 500 stars alone.
Our models demonstrate, for the first time, that some PI SNe do create massive black holes, like the 90 remnant created in the h500s0 explosion. They also reveal that fallback can strongly affect the luminosity of the SN because any the explosion creates is swallowed up by the black hole at early times and therefore cannot power the light curve at later times. The creation of a black hole also admits the possibility of the formation of a black hole accretion disk system, if the core of the star has sufficient angular momentum. Because in excess of 1 can fall into the black hole every second, a small fraction of these events could be accompanied by GRBs (Whalen et al., 2008b; Nakauchi et al., 2012; Mesler et al., 2014) because the star has shed its H envelope and the jet can escape.
The SN factories may ultimately discover many PI SNe, even though they can only detect them at 2, because cosmic star formation rates are so much higher at low redshifts than at high redshifts (Tornatore et al., 2007; Trenti & Stiavelli, 2009; Ishida et al., 2011; Campisi et al., 2011; Robertson & Ellis, 2012; Cooke et al., 2012; Wise et al., 2012; Johnson et al., 2013a; Pawlik et al., 2013; Xu et al., 2013; Hasegawa & Semelin, 2013; Muratov et al., 2013). Indeed, Langer et al. (2007) estimate that there is one non-zero metallicity PI SN per thousand SNe today and as many as one per one hundred at 5 (see also Langer, 2009). The new SN facilities, together with future NIR observatories, will soon probe the stellar populations of both early and mature galaxies with these energetic transients.
References
- Abel et al. (2007) Abel, T., Wise, J. H., & Bryan, G. L. 2007, ApJ, 659, L87
- Almgren et al. (2010) Almgren, A. S., Beckner, V. E., Bell, J. B., Day, M. S., Howell, L. H., Joggerst, C. C., Lijewski, M. J., Nonaka, A., Singer, M., & Zingale, M. 2010, ApJ, 715, 1221
- Alvarez et al. (2006) Alvarez, M. A., Bromm, V., & Shapiro, P. R. 2006, ApJ, 639, 621
- Bayless et al. (2014) Bayless, A. J., Even, W., Frey, L. H., Fryer, C. L., Roming, P. W. A., & Young, P. A. 2014, arXiv:1401.4449
- Bromm et al. (2003) Bromm, V., Yoshida, N., & Hernquist, L. 2003, ApJ, 596, L135
- Campisi et al. (2011) Campisi, M. A., Maio, U., Salvaterra, R., & Ciardi, B. 2011, MNRAS, 416, 2760
- Chatzopoulos & Wheeler (2012) Chatzopoulos, E. & Wheeler, J. C. 2012, ApJ, 748, 42
- Chatzopoulos et al. (2013) Chatzopoulos, E., Wheeler, J. C., & Couch, S. M. 2013, ApJ, 776, 129
- Chen et al. (2011) Chen, K.-J., Heger, A., & Almgren, A. S. 2011, Computer Physics Communications, 182, 254
- Chen et al. (2014a) Chen, K.-J., Heger, A., Woosley, S., Almgren, A., Whalen, D. J., & Johnson, J. L. 2014a, ApJ, 790, 162
- Chen et al. (2014b) Chen, K.-J., Woosley, S., Heger, A., Almgren, A., & Whalen, D. J. 2014b, ApJ, 792, 28
- Chevalier & Imamura (1982) Chevalier, R. A. & Imamura, J. N. 1982, ApJ, 261, 543
- Chini et al. (2012) Chini, R., Hoffmeister, V. H., Nasseri, A., Stahl, O., & Zinnecker, H. 2012, MNRAS, 424, 1925
- Cooke et al. (2012) Cooke, J., Sullivan, M., Gal-Yam, A., Barton, E. J., Carlberg, R. G., Ryan-Weber, E. V., Horst, C., Omori, Y., & Díaz, C. G. 2012, Nature, 491, 228
- Crowther et al. (2010) Crowther, P. A., Schnurr, O., Hirschi, R., Yusof, N., Parker, R. J., Goodwin, S. P., & Kassim, H. A. 2010, MNRAS, 408, 731
- de Souza et al. (2013) de Souza, R. S., Ishida, E. E. O., Johnson, J. L., Whalen, D. J., & Mesinger, A. 2013, MNRAS, 436, 1555
- de Souza et al. (2014) de Souza, R. S., Ishida, E. E. O., Whalen, D. J., Johnson, J. L., & Ferrara, A. 2014, MNRAS, 442, 1640
- de Souza et al. (2011) de Souza, R. S., Rodrigues, L. F. S., Ishida, E. E. O., & Opher, R. 2011, MNRAS, 415, 2969
- Dessart et al. (2012) Dessart, L., Hillier, D. J., Waldman, R., Livne, E., & Blondin, S. 2012, MNRAS, 426, L76
- Dessart et al. (2013) Dessart, L., Waldman, R., Livne, E., Hillier, D. J., & Blondin, S. 2013, MNRAS, 428, 3227
- Drout et al. (2013) Drout, M. R., Soderberg, A. M., Mazzali, P. A., Parrent, J. T., Margutti, R., Milisavljevic, D., Sanders, N. E., Chornock, R., Foley, R. J., Kirshner, R. P., Filippenko, A. V., Li, W., Brown, P. J., Cenko, S. B., Chakraborti, S., Challis, P., Friedman, A., Ganeshalingam, M., Hicken, M., Jensen, C., Modjaz, M., Perets, H. B., Silverman, J. M., & Wong, D. S. 2013, ApJ, 774, 58
- Eggenberger et al. (2008) Eggenberger, P., Meynet, G., Maeder, A., Hirschi, R., Charbonnel, C., Talon, S., & Ekström, S. 2008, Ap&SS, 316, 43
- Frey et al. (2013) Frey, L. H., Even, W., Whalen, D. J., Fryer, C. L., Hungerford, A. L., Fontes, C. J., & Colgan, J. 2013, ApJS, 204, 16
- Fryer (1999) Fryer, C. L. 1999, ApJ, 522, 413
- Fryer et al. (2012) Fryer, C. L., Belczynski, K., Wiktorowicz, G., Dominik, M., Kalogera, V., & Holz, D. E. 2012, ApJ, 749, 91
- Fryer et al. (2009) Fryer, C. L., Brown, P. J., Bufano, F., Dahl, J. A., Fontes, C. J., Frey, L. H., Holland, S. T., Hungerford, A. L., Immler, S., Mazzali, P., Milne, P. A., Scannapieco, E., Weinberg, N., & Young, P. A. 2009, ApJ, 707, 193
- Fryer et al. (2007a) Fryer, C. L., Hungerford, A. L., & Rockefeller, G. 2007a, International Journal of Modern Physics D, 16, 941
- Fryer et al. (2007b) Fryer, C. L., Hungerford, A. L., & Young, P. A. 2007b, ApJ, 662, L55
- Fryer et al. (2010) Fryer, C. L., Whalen, D. J., & Frey, L. 2010, in American Institute of Physics Conference Series, Vol. 1294, American Institute of Physics Conference Series, ed. D. J. Whalen, V. Bromm, & N. Yoshida, 70–75
- Gal-Yam et al. (2009) Gal-Yam, A., Mazzali, P., Ofek, E. O., Nugent, P. E., Kulkarni, S. R., Kasliwal, M. M., Quimby, R. M., Filippenko, A. V., Cenko, S. B., Chornock, R., Waldman, R., Kasen, D., Sullivan, M., Beshore, E. C., Drake, A. J., Thomas, R. C., Bloom, J. S., Poznanski, D., Miller, A. A., Foley, R. J., Silverman, J. M., Arcavi, I., Ellis, R. S., & Deng, J. 2009, Nature, 462, 624
- Gittings et al. (2008) Gittings, M., Weaver, R., Clover, M., Betlach, T., Byrne, N., Coker, R., Dendy, E., Hueckstaedt, R., New, K., Oakes, W. R., Ranta, D., & Stefan, R. 2008, Computational Science and Discovery, 1, 015005
- Glover (2013) Glover, S. 2013, in Astrophysics and Space Science Library, Vol. 396, Astrophysics and Space Science Library, ed. T. Wiklind, B. Mobasher, & V. Bromm, 103
- Hasegawa & Semelin (2013) Hasegawa, K. & Semelin, B. 2013, MNRAS, 428, 154
- Heger & Woosley (2002) Heger, A. & Woosley, S. E. 2002, ApJ, 567, 532
- Herzig et al. (1990) Herzig, K., El Eid, M. F., Fricke, K. J., & Langer, N. 1990, A&A, 233, 462
- Hirschi et al. (2004) Hirschi, R., Meynet, G., & Maeder, A. 2004, A&A, 425, 649
- Hummel et al. (2012) Hummel, J. A., Pawlik, A. H., Milosavljević, M., & Bromm, V. 2012, ApJ, 755, 72
- Imamura et al. (1984) Imamura, J. N., Wolff, M. T., & Durisen, R. H. 1984, ApJ, 276, 667
- Ishida et al. (2011) Ishida, E. E. O., de Souza, R. S., & Ferrara, A. 2011, MNRAS, 418, 500
- Ivezic et al. (2008) Ivezic, Z. et al. for the LSST Collaboration. 2008, arXiv:0805.2366
- Joggerst et al. (2010) Joggerst, C. C., Almgren, A., Bell, J., Heger, A., Whalen, D., & Woosley, S. E. 2010, ApJ, 709, 11
- Joggerst & Whalen (2011) Joggerst, C. C. & Whalen, D. J. 2011, ApJ, 728, 129
- Johnson et al. (2013a) Johnson, J. L., Dalla, V. C., & Khochfar, S. 2013a, MNRAS, 428, 1857
- Johnson et al. (2014) Johnson, J. L., Whalen, D. J., Agarwal, B., Paardekooper, J.-P., & Khochfar, S. 2014, arXiv:1405.2081
- Johnson et al. (2013b) Johnson, J. L., Whalen, D. J., Even, W., Fryer, C. L., Heger, A., Smidt, J., & Chen, K.-J. 2013b, ApJ, 775, 107
- Johnson et al. (2012) Johnson, J. L., Whalen, D. J., Fryer, C. L., & Li, H. 2012, ApJ, 750, 66
- Johnson et al. (2013c) Johnson, J. L., Whalen, D. J., Li, H., & Holz, D. E. 2013c, ApJ, 771, 116
- Kaiser et al. (2002) Kaiser, N., Aussel, H., Burke, B. E., Boesgaard, H., Chambers, K., Chun, M. R., Heasley, J. N., Hodapp, K.-W., Hunt, B., Jedicke, R., Jewitt, D., Kudritzki, R., Luppino, G. A., Maberry, M., Magnier, E., Monet, D. G., Onaka, P. M., Pickles, A. J., Rhoads, P. H. H., Simon, T., Szalay, A., Szapudi, I., Tholen, D. J., Tonry, J. L., Waterson, M., & Wick, J. 2002, in Society of Photo-Optical Instrumentation Engineers (SPIE) Conference Series, Vol. 4836, Society of Photo-Optical Instrumentation Engineers (SPIE) Conference Series, ed. J. A. Tyson & S. Wolff, 154–164
- Kasen et al. (2011) Kasen, D., Woosley, S. E., & Heger, A. 2011, ApJ, 734, 102
- Kitayama & Yoshida (2005) Kitayama, T. & Yoshida, N. 2005, ApJ, 630, 675
- Kitayama et al. (2004) Kitayama, T., Yoshida, N., Susa, H., & Umemura, M. 2004, ApJ, 613, 631
- Kleiser & Kasen (2014) Kleiser, I. K. W. & Kasen, D. 2014, MNRAS, 438, 318
- Kozyreva et al. (2014a) Kozyreva, A., Blinnikov, S., Langer, N., & Yoon, S.-C. 2014a, A&A, 565, A70
- Kozyreva et al. (2014b) Kozyreva, A., Yoon, S.-C., & Langer, N. 2014b, A&A, 566, A146
- Langer (2009) Langer, N. 2009, Nature, 462, 579
- Langer et al. (2007) Langer, N., Norman, C. A., de Koter, A., Vink, J. S., Cantiello, M., & Yoon, S.-C. 2007, A&A, 475, L19
- Law et al. (2009) Law, N. M., Kulkarni, S. R., Dekany, R. G., Ofek, E. O., Quimby, R. M., Nugent, P. E., Surace, J., Grillmair, C. C., Bloom, J. S., Kasliwal, M. M., Bildsten, L., Brown, T., Cenko, S. B., Ciardi, D., Croner, E., Djorgovski, S. G., van Eyken, J., Filippenko, A. V., Fox, D. B., Gal-Yam, A., Hale, D., Hamam, N., Helou, G., Henning, J., Howell, D. A., Jacobsen, J., Laher, R., Mattingly, S., McKenna, D., Pickles, A., Poznanski, D., Rahmer, G., Rau, A., Rosing, W., Shara, M., Smith, R., Starr, D., Sullivan, M., Velur, V., Walters, R., & Zolkower, J. 2009, PASP, 121, 1395
- Maeder (2009) Maeder, A. 2009, Physics, Formation and Evolution of Rotating Stars (Springer Berlin Heidelberg)
- Magee et al. (1995) Magee, N. H., Abdallah, Jr., J., Clark, R. E. H., Cohen, J. S., Collins, L. A., Csanak, G., Fontes, C. J., Gauger, A., Keady, J. J., Kilcrease, D. P., & Merts, A. L. 1995, in Astronomical Society of the Pacific Conference Series, Vol. 78, Astrophysical Applications of Powerful New Databases, ed. S. J. Adelman & W. L. Wiese, 51
- Meiksin & Whalen (2013) Meiksin, A. & Whalen, D. J. 2013, MNRAS, 430, 2854
- Mesler et al. (2012) Mesler, R. A., Whalen, D. J., Lloyd-Ronning, N. M., Fryer, C. L., & Pihlström, Y. M. 2012, ApJ, 757, 117
- Mesler et al. (2014) Mesler, R. A., Whalen, D. J., Smidt, J., Fryer, C. L., Lloyd-Ronning, N. M., & Pihlström, Y. M. 2014, ApJ, 787, 91
- Mokiem et al. (2007) Mokiem, M. R., de Koter, A., Vink, J. S., Puls, J., Evans, C. J., Smartt, S. J., Crowther, P. A., Herrero, A., Langer, N., Lennon, D. J., Najarro, F., & Villamariz, M. R. 2007, A&A, 473, 603
- Moriya et al. (2010) Moriya, T., Tominaga, N., Tanaka, M., Nomoto, K., Sauer, D. N., Mazzali, P. A., Maeda, K., & Suzuki, T. 2010, ApJ, 719, 1445
- Muratov et al. (2013) Muratov, A. L., Gnedin, O. Y., Gnedin, N. Y., & Zemp, M. 2013, ApJ, 773, 19
- Nakauchi et al. (2012) Nakauchi, D., Suwa, Y., Sakamoto, T., Kashiyama, K., & Nakamura, T. 2012, ApJ, 759, 128
- Nicholl et al. (2013) Nicholl, M. et al. 2013, Nature, 502, 346
- Nugis & Lamers (2000) Nugis, T. & Lamers, H. J. G. L. M. 2000, A&A, 360, 227
- O’Shea et al. (2005) O’Shea, B. W., Abel, T., Whalen, D., & Norman, M. L. 2005, ApJ, 628, L5
- Pan et al. (2012a) Pan, T., Kasen, D., & Loeb, A. 2012a, MNRAS, 422, 2701
- Pan et al. (2012b) Pan, T., Loeb, A., & Kasen, D. 2012b, MNRAS, 423, 2203
- Passy et al. (2012) Passy, J.-C., De Marco, O., Fryer, C. L., Herwig, F., Diehl, S., Oishi, J. S., Mac Low, M.-M., Bryan, G. L., & Rockefeller, G. 2012, ApJ, 744, 52
- Pawlik et al. (2013) Pawlik, A. H., Milosavljević, M., & Bromm, V. 2013, ApJ, 767, 59
- Popham et al. (1999) Popham, R., Woosley, S. E., & Fryer, C. 1999, ApJ, 518, 356
- Quataert & Shiode (2012) Quataert, E. & Shiode, J. 2012, MNRAS, 423, L92
- Robertson & Ellis (2012) Robertson, B. E. & Ellis, R. S. 2012, ApJ, 744, 95
- Sana & Evans (2011) Sana, H. & Evans, C. J. 2011, in IAU Symposium, Vol. 272, IAU Symposium, ed. C. Neiner, G. Wade, G. Meynet, & G. Peters, 474–485
- Scannapieco et al. (2005) Scannapieco, E., Madau, P., Woosley, S., Heger, A., & Ferrara, A. 2005, ApJ, 633, 1031
- Schaerer (2002) Schaerer, D. 2002, A&A, 382, 28
- Smidt et al. (2014) Smidt, J., Whalen, D. J., Chatzopoulos, E., Wiggins, B. K., Chen, K.-J., Kozyreva, A., & Even, W. 2014, arXiv:1411.5377
- Tornatore et al. (2007) Tornatore, L., Ferrara, A., & Schneider, R. 2007, MNRAS, 382, 945
- Trenti & Stiavelli (2009) Trenti, M. & Stiavelli, M. 2009, ApJ, 694, 879
- Vasiliev et al. (2012) Vasiliev, E. O., Vorobyov, E. I., Matvienko, E. E., Razoumov, A. O., & Shchekinov, Y. A. 2012, Astronomy Reports, 56, 895
- Vink et al. (2001) Vink, J. S., de Koter, A., & Lamers, H. J. G. L. M. 2001, A&A, 369, 574
- Weaver et al. (1978) Weaver, T. A., Zimmerman, G. B., & Woosley, S. E. 1978, ApJ, 225, 1021
- Whalen et al. (2004) Whalen, D., Abel, T., & Norman, M. L. 2004, ApJ, 610, 14
- Whalen et al. (2010) Whalen, D., Hueckstaedt, R. M., & McConkie, T. O. 2010, ApJ, 712, 101
- Whalen & Norman (2006) Whalen, D. & Norman, M. L. 2006, ApJS, 162, 281
- Whalen & Norman (2008a) —. 2008a, ApJ, 673, 664
- Whalen et al. (2008a) Whalen, D., O’Shea, B. W., Smidt, J., & Norman, M. L. 2008a, ApJ, 679, 925
- Whalen et al. (2008b) Whalen, D., Prochaska, J. X., Heger, A., & Tumlinson, J. 2008b, ApJ, 682, 1114
- Whalen et al. (2008c) Whalen, D., van Veelen, B., O’Shea, B. W., & Norman, M. L. 2008c, ApJ, 682, 49
- Whalen (2013) Whalen, D. J. 2013, Acta Polytechnica, 53, 573
- Whalen et al. (2013a) Whalen, D. J., Even, W., Frey, L. H., Smidt, J., Johnson, J. L., Lovekin, C. C., Fryer, C. L., Stiavelli, M., Holz, D. E., Heger, A., Woosley, S. E., & Hungerford, A. L. 2013a, ApJ, 777, 110
- Whalen et al. (2013b) Whalen, D. J., Even, W., Lovekin, C. C., Fryer, C. L., Stiavelli, M., Roming, P. W. A., Cooke, J., Pritchard, T. A., Holz, D. E., & Knight, C. 2013b, ApJ, 768, 195
- Whalen et al. (2013c) Whalen, D. J., Even, W., Smidt, J., Heger, A., Chen, K.-J., Fryer, C. L., Stiavelli, M., Xu, H., & Joggerst, C. C. 2013c, ApJ, 778, 17
- Whalen & Fryer (2012) Whalen, D. J. & Fryer, C. L. 2012, ApJ, 756, L19
- Whalen et al. (2013d) Whalen, D. J., Fryer, C. L., Holz, D. E., Heger, A., Woosley, S. E., Stiavelli, M., Even, W., & Frey, L. H. 2013d, ApJ, 762, L6
- Whalen et al. (2013e) Whalen, D. J., Joggerst, C. C., Fryer, C. L., Stiavelli, M., Heger, A., & Holz, D. E. 2013e, ApJ, 768, 95
- Whalen et al. (2013f) Whalen, D. J., Johnson, J. L., Smidt, J., Heger, A., Even, W., & Fryer, C. L. 2013f, ApJ, 777, 99
- Whalen et al. (2013g) Whalen, D. J., Johnson, J. L., Smidt, J., Meiksin, A., Heger, A., Even, W., & Fryer, C. L. 2013g, ApJ, 774, 64
- Whalen et al. (2006) Whalen, D. J., Laurent-Muehleisen, S. A., Moran, E. C., & Becker, R. H. 2006, AJ, 131, 1948
- Whalen & Norman (2008b) Whalen, D. J. & Norman, M. L. 2008b, ApJ, 672, 287
- Whalen et al. (2014) Whalen, D. J., Smidt, J., Even, W., Woosley, S. E., Heger, A., Stiavelli, M., & Fryer, C. L. 2014, ApJ, 781, 106
- Whalen et al. (2013h) Whalen, D. J., Smidt, J., Johnson, J. L., Holz, D. E., Stiavelli, M., & Fryer, C. L. 2013h, arXiv:1312.6330
- Wise & Abel (2008) Wise, J. H. & Abel, T. 2008, ApJ, 684, 1
- Wise et al. (2012) Wise, J. H., Turk, M. J., Norman, M. L., & Abel, T. 2012, ApJ, 745, 50
- Woosley et al. (2002) Woosley, S. E., Heger, A., & Weaver, T. A. 2002, Reviews of Modern Physics, 74, 1015
- Xu et al. (2013) Xu, H., Wise, J. H., & Norman, M. L. 2013, ApJ, 773, 83
- Yoon et al. (2012) Yoon, S.-C., Dierks, A., & Langer, N. 2012, A&A, 542, A113
- Young et al. (2010) Young, D. R., Smartt, S. J., Valenti, S., Pastorello, A., Benetti, S., Benn, C. R., Bersier, D., Botticella, M. T., Corradi, R. L. M., Harutyunyan, A. H., Hrudkova, M., Hunter, I., Mattila, S., de Mooij, E. J. W., Navasardyan, H., Snellen, I. A. G., Tanvir, N. R., & Zampieri, L. 2010, A&A, 512, A70+
- Yusof et al. (2013) Yusof, N., Hirschi, R., Meynet, G., Crowther, P. A., Ekström, S., Frischknecht, U., Georgy, C., Abu Kassim, H., & Schnurr, O. 2013, MNRAS, 433, 1114