Sliding not sloshing in Abell 3744: the influence of radio galaxies NGC 7018 and 7016 on cluster gas
Abstract
We present new X-ray (Chandra) and radio (JVLA) observations of the nearby cluster Abell 3744. It hosts two prominent radio galaxies with powers in the range critical for radio-mode feedback. The radio emission from these galaxies terminates in buoyant tendrils reaching the cluster’s outer edge, and the radio-emitting plasma clearly influences the cluster’s X-ray-emitting atmosphere. The cluster’s average gas temperature, of keV, is high for its bolometric luminosity of 3.2 ergs s-1, but the 100 kpc-scale cavity carved out by radio-emitting plasma shows evidence of less than 2 per cent of the excess enthalpy. We suggest instead that a high-velocity encounter with a galaxy group is responsible for dispersing and increasing the entropy of the gas in this non-cool-core cluster. We see no evidence for shocks, or established isobaric gas motions (sloshing), but there is much sub-structure associated with a dynamically active central region that encompasses the brightest radio emission. Gas heating is evident in directions perpendicular to the inferred line of encounter between the infalling group and cluster. The radio-emitting tendrils run along boundaries between gas of different temperature, apparently lubricating the gas flows and inhibiting heat transfer. The first stages of the encounter may have helped trigger the radio galaxies into their current phase of activity, where we see X-rays from the nuclei, jets, and hotspots.
Subject headings:
galaxies: active — galaxies: individual (NGC 7016, NGC 7017, NGC 7018 (catalog )) — galaxies: clusters: individual (Abell 3744 (catalog )) — galaxies: jets — radio continuum: galaxies — X-rays: galaxies: clusters1. Introduction
It is many years since the first description of how radio sources fueled by AGN interact with and inject energy into the surrounding medium (Scheuer 1974). Now, largely due to Chandra, we have many observational examples. X-ray signatures of the mechanisms involved are varied. Gas cavities crafted by current or past radio lobes are common (see McNamara & Nulsen 2007, for a review). AGN-driven radio lobes are seen to shock the gas strongly, as in Cen A and PKS B2152-699 (Kraft et al. 2003; Worrall et al. 2012) or weakly, as in NGC 4636 (Jones et al. 2002). While these phenomena mold the gas surface-brightness distribution, in other interactions it is the gas structures that shape the distribution of radio emission. This may be through the radio structures becoming buoyant, as in NGC 326 (Worrall, Birkinshaw & Cameron 1995) or M 87 (Forman et al. 2007), or because radio plasma is riding on a pressure wave of gas, as in 3C 442A (Worrall et al. 2007). Moreover, as galaxies within groups and clusters interact with one another, their interstellar and intracluster media (ISM and ICM) get churned up through ram-pressure stripping, and wakes are observed as X-ray-gas density enhancements which are sometimes cooler and sometimes hotter than the surrounding gas (e.g., Machacek et al. 2005; Sakelliou et al. 2005; Randall et al. 2008).
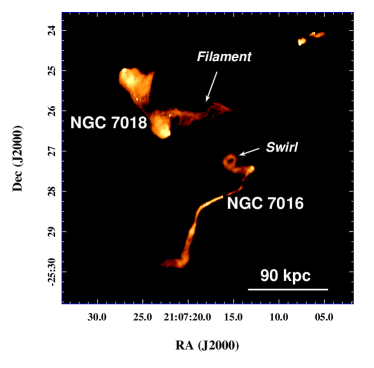
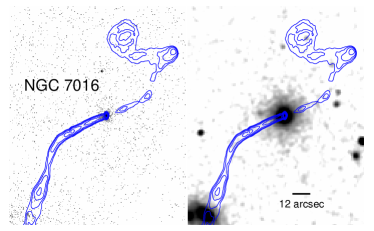
Most of the best X-ray-studied cases are of radio galaxies of relatively low radio power hosted by the brightest central galaxy in the cluster or group environment, and less attention has been paid to cases where there are multiple radio galaxies in relatively close proximity. The radio galaxies hosted by NGC 7016 and NGC 7018 are a remarkable pair (Ekers et al. 1989) which reside in the central regions of the cluster Abell 3744 at (Mazure et al. 1996) and have escaped attention in recent years. They were mapped at high resolution in the radio with the VLA by Cameron (1988), and an image showing the salient features of Figure 1 appears in Bicknell, Cameron & Gingold (1990) in the context of rotation-measure modeling of NGC 7018. The radio source hosted by NGC 7016 has asymmetric bent jets. Lower-resolution radio data show a very long bent extension on the jet side — one of the ‘tendrils’ to which we refer later. On the counterjet side there is extreme looping, making a feature we refer to as the ‘swirl’. The radio source hosted by the eastern nucleus of the dumbbell galaxy NGC 7018 is a classical double, of Fanaroff & Riley (1974) type II (FR II) morphology but unusual extended structure. We refer to the bright western extension from the southern lobe as the ‘filament’. At lower radio resolution, two long extensions (tendrils) are seen to the W and NW.
While the complicated radio structures suggest interaction with the cluster atmosphere, little has been published on Abell 3744’s X-ray properties. It is detected in the ROSAT All-Sky Survey (RASS) and is one of the 447 members of the REFLEX cluster catalog (Böhringer et al. 2004). However, it lies amongst the 12 per cent least luminous REFLEX clusters, with a cataloged 0.1–2.4-keV luminosity of only ergs s-1, and has not appeared in samples for deeper study. The ROSAT High Resolution Imager pointed at the field for 16.8 ks, and although investigation of the archival data shows a clear detection of the centers of both galaxies, the data are insufficiently sensitive for investigation of cluster substructure. In this paper we present new sensitive Chandra observations of the system, together with new radio data obtained with the Jansky Very Large Array (JVLA). §2 describes the new observations and data processing. §3 and §4 describe the cluster and galaxy/group X-ray features, respectively. In §5 we highlight the fact that the two radio galaxies lie within the range of power that dominates jet-mediated feedback in the Universe as a whole. After examining available galaxy velocity data in §6, with reference to the distribution of cluster gas and possible evidence for a merger, we discuss in §7 relationships between the radio and X-ray structures and likely underlying causes. §8 summarizes our results. We adopt a luminosity distance for Abell 3744 of Mpc (appropriate for a Hubble constant of 70 km s-1 Mpc-1), and 1 arcmin is equivalent to 45.3 kpc at the source. Flux densities and spectral indices are related in the sense .
2. Observations & analysis
2.1. X-ray
We made a 75 ks observation of the system in full-window and VFAINT data mode with the Advanced CCD Imaging Spectrometer (ACIS) on board Chandra on 2010 September 11 (OBSID 12241). NGC 7016 was positioned close to the nominal aimpoint of the front-illuminated I3 chip. The other three CCDs of ACIS-I and the S2 chip of ACIS-S were also on during the observations, giving a frame time of 3.14 s. Details of the instrument and its modes of operation can be found in the Chandra Proposers’ Observatory Guide111http://cxc.harvard.edu/proposer. Results presented here use ciao v4.5 and the caldb v4.5.6 calibration database. We re-calibrated the data to take advantage of the sub-pixel event reposition routine (edser), following the software threads from the Chandra X-ray Center (CXC)222http://cxc.harvard.edu/ciao, to make new level 2 events files. Only events with grades 0,2,3,4,6 were retained. After screening to exclude intervals of high background at a threshold appropriate for use of the blank-sky background files, the calibrated dataset has an exposure time of 71.553 ks.
Since the cluster fills a large part of the detector array, background was measured from blank-sky fields following procedures described in the CXC software threads. After cleaning the background data using the same criteria as for the source data, and reprojecting to the same coordinate system, a small normalization correction was applied (2%) so that the count rates matched in the -keV energy band where particle background dominates.
The ciao wavdetect task was used to find point sources with a threshold set to give 1 spurious source per field. Their regions were subsequently masked from the data for the analysis of extended structure. All spectral fits are performed in xspec on binned spectra using statistics over the energy range keV. The models include Galactic absorption of cm-2 (Dickey & Lockman 1990). Parameter uncertainties are 90% confidence for 1 interesting parameter unless otherwise stated.
2.2. Radio
We made sensitive, high-resolution, observations of the field containing NGC 7016 and NGC 7018 using the JVLA in its A configuration at L (1.4 GHz) and C (5 GHz) bands (Table 1). At the time of the observations, only part of the full bandwidth of the JVLA correlator was available. The data were calibrated and flagged for extensive interference before being passed through the normal clean and gain self-calibration cycles in casa. For more diffuse structures we also downloaded archival L-band data taken in C configuration with the VLA, and mapped them using standard procedures in AIPS. Details of the heritage of the data sets and properties of the resulting maps are given in Table 1. For L to C-band spectral-index measurements we made a version of the C-band map with the same restoring beam as the L-band JVLA map.
| Program | Observation Date | Frequency (GHz) | Configuration | Restoring Beam (arcsec)2 | Noise (mJy beam-1) | RefsaaPublications also using data from these programs: 1 = Birkinshaw & Worrall, in preparation. 2 = Bicknell et al. (1990) |
|---|---|---|---|---|---|---|
| AB1389 | 2011 Jun 27 | 1.39 | JVLA-A | 0.066 | 1 | |
| AB1389 | 2011 Jun 27 | 4.96 | JVLA-A | 0.056 | 1 | |
| AC105 | 1984 Mar 31 | 1.525 | VLA-C | 0.16 | 2 |
3. X-rays from the cluster gas
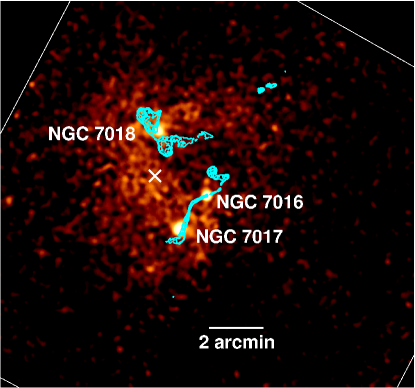
Figure 5 is a smoothed, exposure-corrected 0.3-5 keV image of the Chandra data, after removal of point sources but not the atmospheres of the three labeled NGC galaxies. 1.4-GHz radio contours are overlayed. The gaseous atmosphere of NGC 7017 is seen in projection on the S jet of NGC 7016.
The extended gas distribution very obviously deviates from spherical symmetry. Interestingly, the filament and swirl (Fig. 1) both correspond to regions where the X-ray emission is less prominent.
3.1. Integrated properties
Despite the lack of spherical symmetry, we have characterized the overall extent of the cluster atmosphere by fitting a -model profile to a background-subtracted exposure-corrected radial profile centered on the position (the approximate centroid of the diffuse emission contained within a circle of radius 227 arcsec) shown as a cross in Figure 5. The result is shown in Figure 3. We note the core radius of 220 arcsec inferred by Bicknell et al. (1990) based on earlier, less sensitive, ROSAT data falls within the error bound for .


We have fitted the spectrum of the brightest extended emission in Figure 5 to a single-temperature thermal (APEC) model absorbed by gas in the line of sight. Emission from the three galaxy/group atmospheres has been excluded. We find very similar results for an on-source circle of radius 227 arcsec centered on as for a polygon of similar area tracing better a contour of constant surface brightness. The spectral contours for the circular extraction region and two outer annuli (radii 227 and 300 arcsec, and 300 and 960 arcsec) are shown in Figure 4. There is a weak trend for the best-fit temperature to decrease with increasing radius. The 90% confidence contour for the 227-arcsec-radius circle and contour for the outer annulus do not touch, giving less than 3 per cent probability of the spectral parameters being the same in these regions. The measurable difference is only in temperature, with the abundances consistent with a constant value of roughly 0.3 times solar (i.e., = 0.3).

Beyond a radius of 330 arcsec some of the cluster lies off the ACIS CCDs. We have therefore estimated the total cluster luminosity using a spectral fit to the emission within this circle, with point sources and galaxy emission excluded, and have extrapolated to account for missing flux based on the radial profile. The spectrum gives an acceptable fit to a model with keV ( error, see also Fig. 4). The radial profile (Fig. 3) finds that the counts within 330 arcsec should be multiplied by a factor of 2.39 0.09 to account for emission out to , corresponding to arcsec for the measured temperature based on Vikhlinin et al. (2006). The result is a bolometric luminosity for the cluster gas of (3.2 0.2) erg s-1 ( error). The luminosity is too low to be a good match to the luminosity-temperature relations of clusters — see e.g., figure 5 of Giles et al. (2012) — or, in other words, the temperature is too hot by keV for the luminosity. From the sample of Maughan et al. (2012) at , the cluster with X-ray properties most closely resembling those of Abell 3744 is RXJ2247+0337 at , with keV and a luminosity of erg s-1 ( errors). That cluster is described as being neither relaxed nor having a cool core — an appropriate description also of Abell 3744.
Abell 3744 appears as RXC J2107.2-2526 in the REFLEX cluster catalog (Böhringer et al. 2004). The 0.1-2.4 keV cluster luminosity of erg s-1 is based on 100 detected counts and used an iterative method with an embedded temperature-luminosity relationship which will have settled on a lower temperature than now measured. A better-constrained value for the 0.1-2.4 keV luminosity to based on the Chandra data (calculated as above) is () erg s-1.
We find that the total gas mass out to arcsec is () M⊙, and under the assumption of isothermal gas in hydrostatic equilibrium we can use equations 30 and 32 of Worrall & Birkinshaw (2006) to estimate a total mass within this radius of () M⊙. The relatively low gas-mass fraction is driven by the unexpectedly high temperature that is measured (total mass is proportional to temperature while the gas mass is largely independent of it). The central proton number density in the X-ray-emitting gas is relatively low, at about 940 m-3, which from figure 5 of Worrall & Birkinshaw (2006) we see corresponds to a long cooling time of about 48 billion years.
3.2. Inner arm and cavity structures
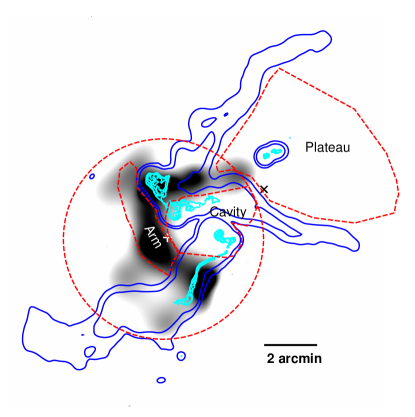


The gas morphology indicates a cavity encompassing the filament of NGC 7018 and the swirl of NGC 7016, and so temperature structure in the inner regions might be expected. However, here we find no obvious statistically-significant temperature structure and no cool core. In Figure 5 we mark regions selected based on X-ray and radio morphology that lie within the 227-arcsec-radius circle and that we refer to as the ‘arm’ and ‘cavity’, and in Figure 6 we show their spectral contours for temperature and abundance666The statistics for the cavity (1910 net counts) are slightly better than for the arm (1528 net counts) despite lower surface brightness. This is because the arm has reduced exposure through lying over chip gaps for part of the telescope wobble.. The axes of Figure 6 are the same as in Figure 4.

The lower average X-ray surface brightness towards the cavity with respect to the arm (a factor of roughly 0.6) is difficult to understand for gas of constant temperature. The apparent opening to the SW seen in Figure 5 is very well aligned with the run of the chip gap, and so, despite exposure corrections having been applied, it is not possible to conclude that the region is unbounded in that direction. We have therefore investigated what scale of spherical cavity is consistent with the data. To do this we have extracted a radial profile centered roughly on the cavity, at . As shown in Figure 7, the central data are clearly depressed relative to the extrapolation of the best-fit model fitted at angular radii larger than 120 arcsec (dashed line).
Since the angular scale of the counts deficit lies within the core radius, we have tested the simple model of a central evacuated spherical region by subtracting the profile of counts that would otherwise lie there (normalized to the central volume density of the model) from the profile of the model. Figure 7 shows that such a central spherical evacuated region is consistent with observations if of angular radius roughly 100 arcsec.
It is not obvious how to construct a static cavity of this type in a gas of constant pressure. It would either need to be a dynamical effect, or there needs to be a source of additional pressure in the cavity. It is likely that extra pressure is provided by radio-emitting relativistic particles (note from Fig. 5 that radio emission covers the cavity but not the arm), in which case a power-law X-ray component from inverse-Compton scattering (discussed in §7.1) might be detectable. To test how well a power law can be accommodated within the region where the radio emission is brightest, we have defined a further region, extending that covered by the cavity and guided by the radio contours. A spectral fit to either a single-component thermal or power-law model is acceptable, at dof = 105.1/94 and 106.7/95, respectively. When the two models are combined and the power-law slope is fixed to , we find dof = 97.8/93 and the flux contribution of the power law is per cent (90% confidence). While we would not claim this as strong evidence for a power-law component, it is consistent with a contribution of inverse Compton emission, as discussed further in §7.1.
3.3. The X-ray ‘plateau’
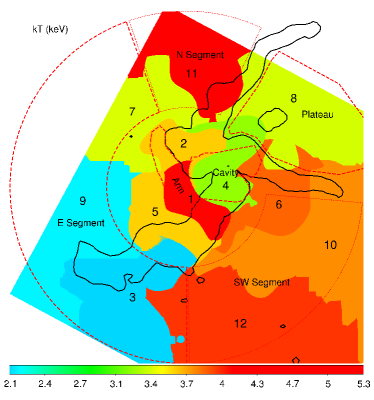
The residuals in the radial-profile fit (Fig. 3) show structure at radii between 100 and 400 arcsec. Profiles of different pie slices were made, from which it became apparent that the main feature was an X-ray excess that lies between NGC 7018’s tendrils of 1.5-GHz radio emission (Fig. 5) outside the gas cavity. We refer to this gas feature as the ‘plateau’ and it is marked in Figure 5. Radial profiles for specific pie slices (Figure 8) show excess counts in the profile corresponding to the position angles of the plateau.

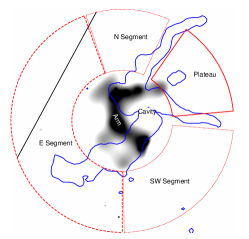
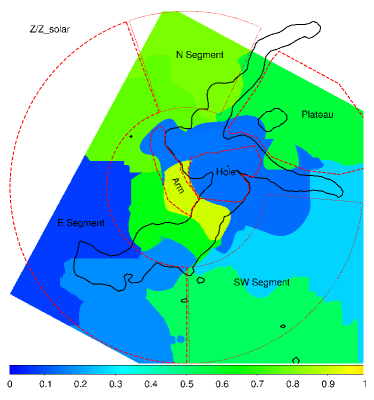
After identifying the plateau as a distinct morphological structure, we investigated the spectral properties of the gas on these larger scales in more detail. While the gas in the plateau fits a temperature similar to the average for the cluster, gas to the east at radii beyond 227 arcsec was found to be cooler, and that to both sides between the plateau and E segment was found to be hotter. In particular, the temperature of gas in the E segment (Fig. 8) is cooler than that from the combined N and SW segments at high significance (Fig. 9).

To probe further the locations of temperature changes, we have used the contbin777http://www-xray.ast.cam.ac.uk/papers/contbin/ software of Sanders (2006) to define spectral regions from our adaptively-smoothed image, and map xspec model-fitting results onto the image. We used a constant signal to noise (S/N) based on our adaptively smoothed exposure-corrected (but not background subtracted) map, which provided regions for spectral fitting with a S/N ranging between 21 and 40. The S/N was on purpose chosen to be slightly lower than that in the regions of Figure 9, in order to investigate to what extent the sector boundaries of Figures 8 and 9 were supported by a less subjective examination of the data. The fitted spectral model is a single-temperature thermal, and we show results for and metallicity in Figure 10.
Spectral results are listed by region in Table 2. The fits to the individual regions are acceptable. When the outer regions of most extreme temperature (3,6, 9, 11) are combined, we find an unacceptable fit to a single-temperature model, as expected from Figure 9 which shows that gas in the E separates in temperature from that in the N and SW. Our main conclusions are that gas to the E is cool ( about 2.1 keV) and of metallicity less than about 0.36. Gas within a radius of 227 arcsec and in the plateau is of intermediate temperature ( about 3.6 keV) and average cluster metallicity, except in a region corresponding to the brightest radio emission from NGC 7017 and NGC 7018, where a possibly depressed abundance might be due to dilution with non-thermal power-law emission (§3.2 and 7.1). Gas wedged between the plateau and the cool gas to the E is significantly hotter ( about 5 keV) and generally of normal metallicity.
| Region | (keV)aa90% errors for one interesting parameter. | aa90% errors for one interesting parameter. | dof | Probability bbNull hypothesis probability. Unacceptable when 3,6,9,11 are combined. |
|---|---|---|---|---|
| 1 | 103.5/92 | 0.19 | ||
| 2 | 103.8/108 | 0.60 | ||
| 3 | 73.9/79 | 0.64 | ||
| 4 | 155.9/138 | 0.14 | ||
| 5 | 86.5/113 | 0.97 | ||
| 6 | 56.3/56 | 0.46 | ||
| 7 | 120.2/102 | 0.11 | ||
| 8 | 85.6/88 | 0.55 | ||
| 9 | 114.8/95 | 0.08 | ||
| 10 | 101.4/105 | 0.58 | ||
| 11 | 73.2/67 | 0.28 | ||
| 12 | 57.8/66 | 0.75 | ||
| 3+6+9+11 | 342.4/292 | 0.02 |
4. X-rays from the galaxies/groups
We have extracted spectra of the X-ray atmospheres surrounding the three galaxies marked on Figure 5 using local background from a surrounding annulus rather than the blank-sky background, as the galaxies and their group atmospheres are embedded within cluster gas. NGC 7016 and NGC 7018 both lie on the I3 CCD of ACIS, and NGC 7017 is on I2. We have used 2MASS J-band data accessed with skyview888http://skyview.gsfc.nasa.gov/skyview.html to associate X-ray and radio features with their host galaxies.
4.1. NGC 7016
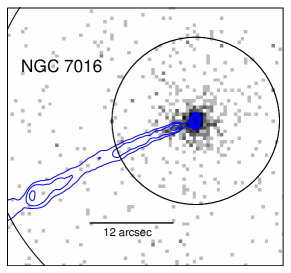
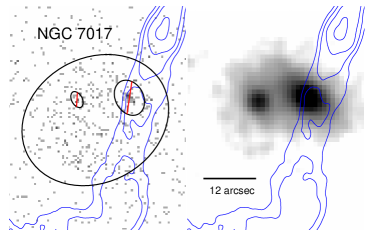
NGC 7016 is a relatively isolated galaxy (Fig. 11). The 886 net counts from a 12-arcsec-radius source-centered circle (Fig. 12) give a poor fit to a thermal model alone (dof = 79.9/30), but the fit is acceptable when a power law (with no excess absorption) is added to account for emission from the active nucleus. The abundance is poorly constrained and was fixed at 0.3 times solar in the two-component fit. Results are given in Table 3. The temperature is cooler than that of the surrounding cluster, as expected for a galaxy atmosphere.
From a smaller circle of radius 1.5 arcsec, again centered on the radio-core position of , the counts are more highly dominated by the power-law component and spatially sharply peaked, but the fit was still improved by a small contribution from thermal gas (from dof = 26.9/17 to 10.7/15). The power-law parameter values were consistent with those from the larger extraction region, demonstrating an active-nucleus origin of the non-thermal emission. The power-law X-ray flux density (Table 3) and 4.96-GHz core flux density of 58.3 mJy lie within the scatter of the correlation of unabsorbed nuclear emission components of Evans et al. (2006), arguing in favor of a common non-thermal origin. An extension of the X-ray emission in the direction of the radio jet (Fig. 12) strongly suggests X-ray synchrotron emission from an inner radio jet, found by Chandra to be a common feature of FR I radio galaxies (Worrall, Birkinshaw & Hardcastle 2001).
4.2. NGC 7017
There is a bright pair of galaxies associated with NGC 7017 (Fig. 13), although their velocity difference of km s-1 (Quintana & Ramírez 1995) is large. The centers of each were detected as X-ray point sources by wavdetect. We excluded the counts in circles of radii 3 and 1.2 arcsec around the centers of the western and eastern galaxy, respectively, and 176 net counts were then detected from an ellipse of semi-axis lengths of 17.4 and 14.2 arcsec shown in Figure 13. A good fit to a thermal model (Table 3) was found.
4.3. NGC 7018
NGC 7018 is also a galaxy pair. The eastern member hosts the radio-galaxy nucleus, and here point-like nuclear X-ray emission that strongly outshines diffuse gas emission is seen (Fig. 14). 709 net counts from a circle of radius 5.6 arcsec centered on can be fitted well to a power-law model with no excess absorption (Table 3). As for NGC 7016 the power-law X-ray flux density (Table 3) and 4.96-GHz core flux density of 36.0 mJy lie within the scatter of the correlation of unabsorbed nuclear emission components of Evans et al. (2006), arguing in favor of a common non-thermal origin.
Quintana & Ramírez (1995) find a velocity difference of only km s-1 between the radio host galaxy and its western companion. Diffuse X-ray emission, associated largely with the companion galaxy, is seen to the west of the radio nucleus. 385 net counts were extracted from an ellipse of semi-axis lengths 20.6 and 11.7 arcsec, excluding the circle described above and shown in Figure 14. The data give a good fit to a thermal model (Table 3). We note that there appears to be a weak excess of radio emission associated with the western galaxy.
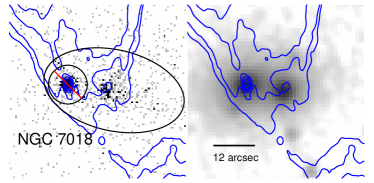
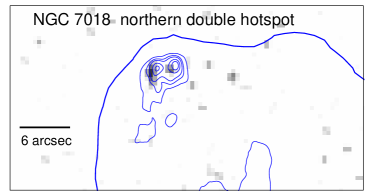
The radio core of NGC 7018 is within its northern lobe. While a broad trunk of radio emission connects it to the southern lobe, the jet to the north is narrow and more distinct, terminating in a double hotspot (Fig. 1). There is excess X-ray emission to the north of the nucleus associated with the tip of the inner jet (Fig. 14; 14 counts detected in a circle of radius 2 arcsec where an average of 2.5 is expected based on local background). The northern hotspot region is also detected in X-rays, with 18 counts detected in a circle of radius 3.5 arcsec where 5 counts are expected based on local background. Hotspot counts appear to be associated with each component of the double system, with a small misalignment between X-ray and radio that is probably within the tolerance of off-axis mapping uncertainties in the radio (Fig. 15). The southern hotspot region is undetected in X-rays.
| Region | aaRedshift from NED of galaxy with the brightest X-ray emission (western component of NGC 7017 and eastern component of NGC 7018). | (keV) | (cm-5)bb, where are densities of hydrogen nuclei and electrons, respectively, is volume and is luminosity distance. | (nJy) | /dof | ||
|---|---|---|---|---|---|---|---|
| NGC 7016 | 0.03685 | (fixed) | 29.9/29 | ||||
| NGC 7017 | 0.03465 | - | - | 7.2/8 | |||
| NGC 7018-nucleus | 0.03842 | - | - | - | 26.9/25 | ||
| NGC 7018-gas | - | - | - | 17.5/14 |
4.4. NW radio source
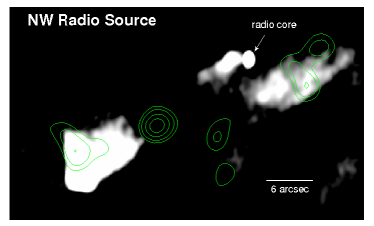
The small radio source in the NW of the field of Figure 1 has a curious structure, as shown in Figure 16. wavdetect finds an X-ray source at the NW tip of the SE lobe with about 7 excess counts (0.3-5 keV). This seems to be chance coincidence, since it does not match the location of the radio core or any other radio feature. There is possible excess X-ray emission associated with bright parts of the lobes, but it is not possible to establish a level of significance since X-ray counts are generally sparse in this part of the image. There is no strong 2MASS association of the radio source.
5. The radio-galaxy morphologies
The flux density of NGC 7018 at 1.525 GHz is roughly 6.2 Jy, of which about 80 per cent lies in the classical-double structure and the rest in its tendrils: a NW tail of the N lobe and the W extension of the radio filament of the S lobe. While data at lower frequencies have been published, the large beam sizes confuse the structures, and total flux densities combine emission from NGC 7016 and NGC 7018. Adopting a spectral index of we extrapolate to find a 178-MHz power for the double source NGC 7018 of W Hz-1 sr-1, placing it in the range where Fanaroff and Riley types I and II (FR Is and FR IIs) overlap in luminosity (Fanaroff & Riley 1974). These are the sources with the correct range of power to dominate jet-mediated feedback in the Universe as a whole, and so are of particular importance (Worrall 2009). The best-studied example is PKS B2152-699, where not only have the lobes evacuated cavities in the X-ray-emitting gas, but also relatively strong (Mach number between 2 and 3) shocks are seen, and the kinetic and thermal energy of shocked gas dominates over the cavity power (Worrall et al. 2012). In NGC 7018 the S lobe may have helped to bore out the large X-ray cavity in which it resides (Fig. 5, and see below), but there is no evidence for shocked gas. There are differences in radio morphology that may explain why strong shocks are not detected around NGC 7018. In particular, NGC 7018 has bright terminal hotspots rather than the lobe-embedded hotspots seen in PKS B2152-699, perhaps suggesting that strong shocks are detected more readily either during a phase of the source’s evolution or at preferred source orientations. X-ray study of more sources of these radio powers are needed to resolve the issues.
NGC 7016, with a total flux density of 4.9 Jy at 1.525 GHz, is almost as bright as NGC 7018, although it exhibits no FR II morphology. Just over half of the flux density is from the region beyond the sharp southern bend of the SE jet that is seen well in the high-resolution radio data, and about 64 per cent of that is in the region of the tendril that lies beyond the extent of the jet in our high-resolution map.
6. Galaxy velocities
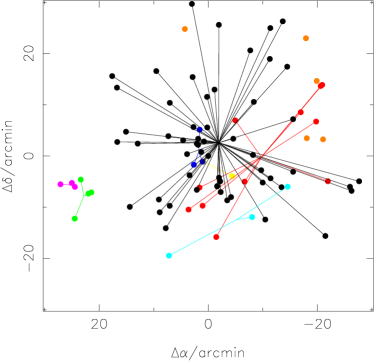
The gas of Abell 3744 is highly disturbed. Merging can produce irregularities, and so we have examined the available galaxy velocities. In order to search for sub-clumps we used velocities listed in NED for galaxies within 30 arcmin of NGC 7016, noting that the mean redshift of and velocity dispersion of km s-1 of 72 galaxies in the field, and likely associated with the cluster, are in good agreement with the redshift, and dispersion of 559 km s-1, found by Mazure et al. (1996). We applied an algorithm that looks for objects close to one another in three dimensions, ignoring velocity differences less than 800 km s-1. The search scale for these associations begins at 1 kpc and increases slowly to 1 Mpc, and pairs are combined into lumps on each scale at their mean position and velocity. The input parameters were then adjusted to check for stability in the results.
As shown in Figure 17, the dominant structure is a cluster of 56 galaxies centered at , about 4 arcmin west of the nucleus of NGC 7018, with mean velocity 11290 km s-1 and velocity dispersion 350 km s-1. The cluster includes NGC 7016 (11046 km s-1) and both nuclei of NGC 7018 (11517 and 11694 km s-1), which are among the bright galaxies in the cluster, but none of which is clearly identifiable as a central brightest cluster galaxy. Several groups can also be identified, including one of velocity 13030 km s-1 associated with the eastern component of NGC 7017 (12892 km s-1) and two other galaxies. This group, at roughly , is closer to the center of the gas distribution than that of the cluster galaxies. Both centers are marked in Figure 5. The second largest grouping is of eleven galaxies centered about 8 arcmin to the WSW, at with velocity 12140 km s-1. The sparseness of velocity information for galaxies that might be in these distinct groups makes it difficult to interpret the neighborhoods of NGC 7016 and NGC 7018 with certainty, but interactions of the group associated with the western component of NGC 7017 and the main cluster also seems plausible. This component of NGC 7017 is the brightest galaxy in the field but, at a velocity of 10387 km s-1, appears to be dynamically distinct from the main cluster, and may have an associated infalling group of galaxies without measured velocities.
The position of the main galaxy centroid explains the excess plateau gas, although not why it is so well positioned between the radio tendrils (Fig. 10). The velocity data are suggestive that a merger interaction between a group or groups with significant velocity offsets from the main cluster is responsible for the non-uniformities in gas distribution and temperature.
7. Discussion
7.1. Radio emission shaping the X-ray cavity
The X-ray cavity is a region of distinctly reduced X-ray surface brightness in the direction where the radio emissions from NGC 7018 and NGC 7016 overlap. Due to coincidence in projection, we assume the cavity is co-located within the core radius of the cluster, and we have demonstrated that the contrast in X-ray surface brightness is consistent with such an interpretation.
Many clusters and groups are now known to harbor gas cavities containing the radio plasma of active galaxies (e.g., Bîrzan et al. 2004). Since the pressure in relativistic plasma should not be less than that of surrounding X-ray gas, insight can be gained into the extent to which the relativistic plasma departs from a state of minimum energy or requires extra pressure to be provided by non-radiating particles or a reduced filling factor (e.g., Dunn, Fabian & Taylor 2005; Bîrzan et al. 2008; O’Sullivan et al. 2011). Where a detection of inverse-Compton radiation from the cavities can be used to measure the magnetic field, the minimum-energy assumption is tested, and results concerning the other pressure components are more secure (e.g., Worrall et al. 2012). In Abell 3744, while there is not a clean spectral separation of inverse-Compton and thermal emission in the cavity, the suggestion of lower metallicity implies that inverse Compton emission is not completely negligible, providing a modeling constraint.
The average gas pressure surrounding the X-ray cavity can be calculated from the X-ray radial profile, giving9991 Pa = 10 dynes cm-2 Pa ( error). A sphere of radius 100 arcsec evacuated of X-ray-emitting gas provides a model for the cavity that is consistent with the surface-brightness distribution (Fig. 7). We model the cavity’s radio emission from our map using data from program AC105 as synchrotron radiation from electrons with a power-law distribution of extending to a minimum Lorentz factor of , to find a minimum-energy field strength 1010101 nT = 10 G in the cavity of nT (no protons) or 1.0 nT (equal energy in protons and electrons). We don’t have radio data to constrain , but the adopted value is supported by the X-ray data if modeled as power-law emission from inverse Compton scattering by the electron population (§3.2). The resulting pressure is a factor of 5.0 (3.5) too low to match that in surrounding X-ray gas, where here and in what follows the first value is for no protons and the second for equal energy in protons and electrons.
While the cavity pressure can be increased by adding further non-radiating particles or reducing the filling factor, the prediction for inverse Compton scattering on the cosmic microwave background radiation is still then less than 6 per cent of the X-ray counts from the cavity, not explaining the reduced metallicity when the spectrum is fitted entirely to thermal emission. In contrast, a small departure from minimum energy in the sense of a reduced magnetic field can both provide the required pressure and explain the metallicites. Specifically, reducing the magnetic field strength to 30 (37) per cent of the minimum-energy value, i.e., to 0.26 (0.37) nT, matches the pressure and provides an increase in electron number density (to match the radio synchrotron emission) such that 52 (27) per cent of the 0.3–5-keV X-ray counts from this region would be from inverse Compton emission. A modest departure from minimum energy is consistent with findings elsewhere, and in particular with the lobes of radio galaxies for which X-ray inverse Compton is detected and modeled using the same value of as adopted here (Croston et al. 2005). We then note that the cavity shape would need to be somewhat spheroidal and elongated along the line of sight, to explain the surface brightness contrast of Figure 7 in the presence of extra (inverse Compton) X-ray counts in the cavity.
The sound speed in X-ray gas of temperature (keV) is roughly km s-1, meaning that radio plasma should have been developing and filling the cavity for at least yrs for the cavity not to have collapsed. This is within the lifetime of typical radio galaxies based on spectral aging measurements (e.g. Alexander & Leahy 1987). NGC 7018, whose southern lobe is currently at the edge of the cavity, would have taken a comparable time ( yr) to cross the cavity at a speed characteristic of the cluster velocity dispersion, and faster speeds are expected here, near the cluster center. Thus it seems likely that the radio plasma of NGC 7018 is primarily responsible for carving out the cavity. In contrast, the radio emission of NGC 7016 is broken into the swirl inside the cavity. While this might be due to collision with radio plasma of NGC 7018, it may also result from interaction with a wake left by the motion of NGC 7018 and its companion galaxy (see e.g., Worrall & Birkinshaw 2005).
If NGC 7018 is responsible for the cavity, its lobes should be at least mildly overpressured with respect to the surrounding gas. The S lobe lies at the entrance to the cavity where the average gas pressure (calculated using the X-ray radial profile for an off-center angular distance of 65 arcsec) is Pa ( error). We model the lobe using our 1.39-GHz JVLA data with parameters as for the cavity111111The visibilities in the C-band data miss too much of the larger-scale lobe structure to provide a good value for ., but with a sphere of radius 18 arcsec, to find a minimum-energy field strength of (2.6) nT and a pressure of Pa, slightly above that in the external gas. If the magnetic field is below the minimum-energy value by the amount we argue is likely for the cavity, then the S lobe is overpressured by a factor of 4.9 with respect to its surrounding gas. Such an overpressure would lead to a shock of Mach number 2 being driven into the external medium (e.g., equation 49 of Worrall & Birkinshaw 2006) and direct heating in the immediate vicinity of the lobe, not ruled out by the data due to masking by much foreground and background gas along the line of sight. Direct evidence of shock heating is difficult to verify around cluster-embedded radio lobes, but there is growing evidence for moderately strong shocks around intermediate-power radio galaxies like NGC 7018 (Worrall et al. 2012).
7.2. X-ray gas shaping radio features
It is striking that the radio filament of the S lobe of NGC 7018 (Fig 1) runs along the northern inside edge of the cavity (Fig 5). The structure contains strands, and the brightening is suggestive of preferential particle acceleration along the interface between the cavity and the external X-ray gas — something which in principle could be tested by radio spectral index mapping.
The tendrils of NGC 7018 run along the outside of the plateau and look like they are buoyant, so that their deprojected pressures should match those in the plateau, as measured using the spectral fit and profile in Figure 8. To test this we take rectangular sections at the end of each tendril modeled as cylinders of radius 21 arcsec and lengths 126 and 162 arcsec centered at distances from the center of the gas distribution of 380 and 530 arcsec for the SW and NW tendrils, respectively. If the tendrils are in the plane of the sky, the external pressure in the SW and NW is and Pa, respectively. For minimum energy the two tendrils then agree in being under-pressured by a factor of 5.5 (3.9), where again the two values correspond to a lepton-only plasma or one where the lepton energy density is matched by that in protons. If in the plane of the sky with no significant entrainment, pressure balance can be restored if the magnetic field is 29 (35) percent of the minimum-energy value. These departures from minimum energy are remarkably similar to those required in the cavity, and by the region in the NW tendril the magnetic field strength so estimated would have dropped to about half that in the cavity. However, while there may be reasons for dynamic structures to depart from minimum energy, it is more appealing for these buoyant flows to have reached a state of minimum energy. The tendrils extend into the region where the X-ray gas pressure is falling with radius, , as roughly , and they would be in pressure balance with this gas if lying at about degrees to the line of sight. The actual value of is likely to be set by the unknown direction of the velocity vector of NGC 7018, such that the buoyant tendrils trail, and such values of are plausible. Some increase in internal pressure in the tendrils through gas entrainment is also likely, allowing to increase from these estimates. Not being in the plane of the sky has the advantage of explaining the rather dramatic fading of the tendrils which occurs at larger for smaller . Strong fading is expected sufficiently far out in the cluster outer atmosphere that the tendrils are no longer supported, and the relativistic plasma expands adiabatically. This is easily accommodated by a further steepening in the radial profiles beyond the values of for which we are able to make measurements in the current data.
The broad tendril to the SE is the extension of the brighter (approaching) jet of NGC 7016. The two jet bends, first to the south and then to the east (Fig. 1) and presumably the result of shocks, are sufficiently large in projection to suggest that this jet is at a relatively small angle to the line of sight. We test a cylinder of radius 33 arcsec and length 98 arcsec (position angle 70 degrees) at 340 arcsec from the center of the gas distribution where the external pressure (in the cooler gas here) is Pa. As for NGC 7018’s tendrils, there is an underpressure by a factor of a few that can be restored if the radio emission is lying at 24 (31) degrees to the line of sight.
7.3. Merging and gas flows
X-ray cavities are sufficiently common that they are regarded as an important heat source, with enough power to balance radiative cooling in dense cluster cores (e.g., Dunn et al. 2005; Rafferty et al. 2006). In the case of the Abell 3744’s cavity, we can estimate the change in enthalpy as , where is the pressure of the X-ray gas, is the volume of the cavity, and is the ratio of specific heats for relativistic gas. The resulting value is roughly J. In §3.1 we pointed out that in its integrated properties the cluster is too hot by keV for its luminosity, based on scaling relations. This is equivalent to an excess enthalpy of , where is the total gas mass, is the particle mass, and is the ratio of specific heats for the X-ray-emitting gas. The resulting value is roughly J. A staggering 85 cavities like those attributed to NGC 7018 would be needed to explain the excess heat in Abell 3744 that causes it to deviate from scaling relations.
The most likely source of the excess heat is therefore a merger. The temperature structure seen in Figure 10 points to such a merger being roughly along a NW-SE direction, such that gas heated in collisions escapes to the sides. It is also consistent with the velocity data discussed in §6 and the two centers marked as crosses in Figure 5. If we take the merging group to have about 5 per cent of the mass of Abell 3744, based on the number of galaxies within known velocities, and use the radial-velocity offset of roughly 1700 km s-1 as the total velocity difference, then the conversion of 20 per cent of the kinetic energy of the group would be sufficient to produce the required excess heating. That is, the heating requires only a minor merger event. The absence of a shock feature in the X-ray image is not unexpected if this merger is indeed responsible for the heating, since such shocks are only seen when the merger is in the plane of the sky, and the radial velocity difference would be excessive if the merger axis is far from the line of sight in the present case.
Numerical simulations have shown that mergers lead to persistent (gigayears) relative motion of gas streams which are in pressure equilibrium (sloshing), and this can explain X-ray features seen rather commonly in relaxed cool-core galaxy clusters and known as cold fronts, where a large density discontinuity is in pressure balance due to the dense gas being cooler (Ascasibar & Markevitch 2006; Markevitch & Vikhlinin 2007). Abell 3744 is far from relaxed, and shows no obvious evidence of sloshing. We clearly see density substructure, but the temperature and density features lie in different parts of the gas, the former having a closer relationship to the location of the radio tendrils. The most likely explanation is that we are witnessing a relatively recent merger encounter, one which may also have helped trigger the radio galaxies into their current phase of activity.
7.4. Sliding and lubrication
The excess X-ray emission in the region we name the ‘plateau’ can be understood since the centroid of the distribution of galaxies with reported velocities (biased towards the more massive ones) lies in this neighborhood. Its temperature is unremarkable compared with that in the X-ray brightest region, including the temperatures in the arm and surrounding the cavity. What is remarkable is that the radio tendrils of NGC 7018 appear to border the hottest gas (Fig. 10), and envelop the roughly cylindrical gas region seen in Figure 5 that forms the bright X-ray bridge between the arm and the plateau. It is tempting to invoke cause and effect, such that the radio plasma of NGC 7018 helps to reduce thermal transport between the warmer and cooler gas, and to reduce momentum transport and hence viscous drag, so that X-ray gases of different temperatures can slide by one another with little heat exchange or mixing. The regions in the temperature map were defined automatically from the smoothed X-ray data, with no reference to the radio structures. It is also notable that the southern tendril of NGC 7016 lies along a temperature boundary.
The morphology of the radio and X-ray extensions suggest that the radio extensions of NGC 7018’s lobes were caused by the relative motion of the host galaxy and the gas extending into the plateau. The attachment of radio plasma to this infalling gas would cause the extension of the radio lobes into the tendrils and cause the gas bridge to become at least partially enveloped by the radio plasma. Because the radio plasma is moderately strongly magnetized, it will act as an effective barrier to transport between the inner arm and the general cluster environment. Not only are the particle gyroradii smaller (by a factor of about 10) in the radio plasma than in the general cluster environment, but the field will also tend to be ordered by the stretching along the radio tendrils. This will reduce the (perpendicular) thermal conductivity between the two gas regions.
The degree of thermal protection offered by the radio features depends both on the reduction in transport through the radio plasma and the fraction of the interface between regions of different temperature covered by the radio plasma. Taking Spitzer conductivity
(Spitzer 1962) appropriate for intracluster gas, and modeling the gas as a cylinder of radius kpc, the timescale for a temperature difference to be erased is of the order
or about 100 Myr, taking the proton density, , to be roughly 940 m-3 (§3.1). This is significantly shorter than the time (about 300 Myr) taken for the gas to travel from NGC 7018 to the plateau at the sound speed. However, it appears that at least half the surface area is covered by radio plasma. If this radio plasma cuts by a factor of about 10, then effective heat transport occurs over only about half the surface of the cylinder and its thermal lifetime is raised by a factor of order 3. The associated drop in viscosity may also help the gas to slide in towards the plateau.
7.5. The X-ray hotspots of NGC 7018
There is good evidence of X-ray emission from both the east and west components of the northern double hotspot of NGC 7018, each with similar ratios of X-ray to radio flux density. The X-ray emission is about two orders of magnitude higher than expected due to inverse-Compton scattering if the electrons and magnetic field are at minimum energy. This result is in common with many other Chandra-observed hotspots, particularly those in FR II radio galaxies at the lower end of the spectrum of total radio power (Hardcastle et al. 2004), The large reduction in magnetic field (about a factor of 24 for NGC 7018) and the subsequent high increase in source energy needed to explain the X-ray emission by the inverse-Compton mechanism led Hardcastle et al. (2004) to suggest that the electron spectrum extends to high enough energies in such hotspots for synchrotron radiation to dominate the X-ray output. In NGC 7018’s hotspots, if the electron spectrum breaks from a power law slope of (giving the observed ) by =1 at a Lorentz factor of , the synchrotron radiation from 100-TeV electrons could be responsible for the X-rays in both components in minimum-energy magnetic fields of about 10 nT. While this is an attractively simple explanation, we note that Werner et al. (2012) have used Spitzer data to claim that a single-component broken-power-law synchrotron spectrum can be excluded for 80 per cent of 24 hotspots they study. They point to the work of De Young (2002) as possible support for magnetic fields in hotspots not having increased to minimum-energy levels.
An alternative reason that hotspots on the jet side of a source (as in NGC 7018) may be unusually X-ray bright is if relativistic beaming is a factor. An applicable mechanism suggested by Georganopoulos & Kazanas (2003) is that for a jet approaching a hotspot with high bulk Lorentz factor the available photon fields for Compton scattering will be boosted by the strongly directional (particularly in the jet frame) radio synchrotron emission from the terminal hotspot, resulting in inverse Compton X-rays beamed in the forward direction of the jet and offset (upstream) from the peak of the radio emission. At high redshift the spatial separation of components necessary to test this mechanism is not possible, although a claim at low redshift has been made for PKS B2152-699 (Worrall et al. 2012). In NGC 7018 there is some evidence for an offset between radio and X-ray emission, although we cannot rule out residual uncertainties in our 5-GHz radio mapping 3.5 arcmin off axis as responsible. A non-detection of the southern hotspot region, at the termination of the jet pointed away from the observer, is consistent with beaming playing a part in the detection of the X-ray hotspots, although statistics are such that the formal upper limit on the X-ray flux is at a similar level to the detections in the north, and so without more sensitive X-ray data firm conclusions cannot be drawn.
8. Summary
We have presented results using new Chandra and JVLA observations of Abell 3744, together with archival lower-resolution VLA data. We find the cluster to be far from relaxed, and devoid of a cool core. The gas is too hot on average by keV for the cluster to agree with temperature-luminosity correlations, and while there is a 100 kpc-scale cavity carved out by radio-emitting plasma, the excess enthalpy is insufficient to explain the heating.
Much of what is observed seems likely to have been caused by the recent merger of a small subgroup of galaxies with fast relative motion at relatively small angle to the line of sight in a roughly SE-NW projected direction. This can easily produce enough heating, and seems to explain the temperature distribution, where hotter gas lies in directions perpendicular to the inferred line of encounter. Existing galaxy-velocity data provide some support for this minor-merger hypothesis, but a more detailed survey of galaxy velocities in the field is needed to provide a more complete test.
While the X-ray data provide no evidence for shocks (understandable since velocity data suggest the encounter is not in the plane of the sky), or isobaric density drops (cold fronts) that would be explainable by gas sloshing, there is much interplay between the X-ray gas and the relativistic plasma hosted by NGC 7016 and NGC 7018. This radio-emitting plasma terminates in buoyant tendrils reaching the cluster’s extremities. In the case of NGC 7018, a tendril trails from each radio lobe, almost certainly as a result of the galaxy’s motion and consequent drag. In contrast, the counter jet of NGC 7016 runs into the X-ray cavity, where it produces a dramatic swirl perhaps due to collision with the radio plasma from NGC 7018 or in the wake of its motion, but a tendril extends from the highly bent southeastern jet. An important and noticeable feature of the tendrils is that they run along boundaries between gas of different temperatures. Because the radio plasma is moderately strongly magnetized, it will act as an effective barrier to transport between gas layers and reduce the effective viscosity, helping to preserve post-merger gas flows.
The radio galaxies hosted by NGC 7016 and NGC 7018 both have powers in the range that dominates output in the Universe as a whole, and so are most important for understanding radio-mode feedback. The most apparent ways in which this feedback is mediated by these sources is through the large X-ray cavity and the capacity for the tendrils to allow the sliding of gas flows and the containment of temperature structures. In other respects the X-ray properties of the radio galaxies are normal for their radio powers. The power-law X-ray emission from both nuclei is unabsorbed and lies within the scatter of radio/X-ray correlations, arguing in favor of a common non-thermal origin for the radio and X-ray core emission. Resolved X-ray emission is detected from the brighter jet in each source. X-rays are detected from both components of the northern double hotspot of NGC 7018, which we have discussed in some detail given the on-going debate concerning the flow-speed into hotspots and the origin of their X-ray emission.
Abell 3744 provides a particularly interesting case study of plasma dynamics, minor-merging, and radio-galaxy feedback in a non-cool core cluster, worthy of deeper study.
References
- Alexander & Leahy (1987) Alexander, P., & Leahy, J.P. 1987, MNRAS, 225, 1
- Ascasibar & Markevitch (2006) Ascasibar, Y., & Markevitch, M. 2006, ApJ, 650, 102
- Bicknell et al. (1990) Bicknell, G.V., Cameron, R.A., & Gingold, R.A. 1990, ApJ, 357, 373
- Bîrzan et al. (2004) Bîrzan, L., Rafferty, D.A., McNamara, B.R., Wise, M.W., & Nulsen, P.E.J. 2004, ApJ, 607, 800
- Bîrzan et al. (2008) Bîrzan, L., McNamara, B.R., Nulsen, P.E.J., Carilli, C.L., & Wise, M.W. 2008, ApJ, 686, 859
- Böhringer et al. (2004) Böhringer, H., Schuecker, P, Guzzo, L, et al. 2004, A&A, 425, 367
- Cameron (1988) Cameron, R.A. 1988, Ph.D., thesis, Australian National University
- Croston et al. (2005) Croston, J.H., Hardcastle, M.J., Harris, D.E., Belsole, E., Birkinshaw, M., & Worrall, D.M. 2005, ApJ, 626, 733
- De Young (2002) De Young, D.S. 2002, New Astron. Rev., 46, 393
- Dickey & Lockman (1990) Dickey, J.M., & Lockman, F.J. 1990, ARA&A, 28, 215
- Dunn et al. (2005) Dunn, R.J.H., Fabian, A.C., & Tayor, G.B. 2005, MNRAS, 364, 1343
- Ekers et al. (1989) Ekers, R.D., Wall, J.V., Shaver, P.A., et al. 1989, MNRAS, 236, 737
- Evans et al. (2006) Evans, D.A., Worrall, D.M., Hardcastle, M.J., Kraft, R.P., & Birkinshaw, M. 2006, ApJ, 642, 96
- Fanaroff & Riley (1974) Fanaroff, B.L., & Riley, J.M. 1974, MNRAS, 167, 31P
- Forman et al. (2007) Forman, W.R., Jones, C., Churazov, E., et al. 2007, ApJ, 665, 1057
- Georganopoulos & Kazanas (2003) Georganopoulos, M., & Kazanas, D. 2003, ApJ, 589, L5
- Giles et al. (2012) Giles, P.A., Maughan, B.J., Birkinshaw, M., Worrall, D.M., & Lancaster, K. 2012, MNRAS, 419, 503
- Hardcastle et al. (2004) Hardcastle, M.J., Harris, D.E., Worrall, D.M., & Birkinshaw, M. 2004, ApJ, 612, 729
- Jones et al. (2002) Jones, C., Forman, W., Vikhlinin, A., Markevitch, M., David, L., Warmflash, A., Murray, S., & Nulsen, P.E.J. 2002, ApJ, 567, L115
- Kraft et al. (2003) Kraft, R.P., Vázquez, S., Forman, W.R., Jones, C., Murray, S.S., Hardcastle, M.J., Worrall, D.M., & Churazov, E. 2003, ApJ, 592, 129
- Machacek et al. (2005) Machacek, M.E., Nulsen, P., Stirbat, L., Jones, C., & Forman, W.R. 2005, ApJ, 630, 280
- Markevitch & Vikhlinin (2007) Markevitch, M., & Vikhlinin, A. 2007, Phys. Rep., 443, 1
- Maughan et al. (2012) Maughan, B.J., Giles, P.A., Randall, S.W., Jones, C., & Forman, W.R. 2012, MNRAS, 421, 1583
- Mazure et al. (1996) Mazure, A., Katgert, P., den Hartog, R., et al. 1996, A&A, 310, 31
- McNamara & Nulsen (2007) McNamara, B.R., & Nulsen, P.E.J. 2007, ARA&A, 45, 117
- O’Sullivan et al. (2011) O’Sullivan, E., Worrall, D.M., Birkinshaw, M., Trinchieri, G., Wolter, A., Zezas, A., & Giacintucci, S. 2011, MNRAS, 496, 2916
- Quintana & Ramírez (1995) Quintana, H., & Ramírez, A. 1995, ApJS, 96, 343
- Rafferty et al. (2006) Rafferty, D.A., McNamara, B.R., Nulsen, P.E.J., & Wise, M.W. 2006, ApJ, 652, 216
- Randall et al. (2008) Randall, S., Nulsen, P., Forman, W.R., Jones, C., Machacek, M., Murray, S.S., & Maughan, B. 2008, ApJ, 688, 208
- Sakelliou et al. (2005) Sakelliou, I., Acreman, D.M., Hardcastle, M.J., Merrifield, M.R., Ponman, T.J., & Stevens, I.R. 2005, MNRAS, 360, 1069
- Sanders (2006) Sanders, J.S. 2006, MNRAS, 371, 829
- Scheuer (1974) Scheuer, P.A.G. 1974, MNRAS, 166, 513
- Spitzer (1962) Spitzer, L. 1962, Physics of fully ionized gases (New York: Wiley-Interscience)
- Vikhlinin et al. (2006) Vikhlinin, A., Kratsov, A., Forman, W., Jones, C., Markevitch, M., Murray, S.S., & Van Speybroeck, L. 2006, ApJ, 640, 691
- Werner et al. (2012) Werner, M.W., Murphy, D.W., Livingston, J.H., Gorjian, V., Jones, D.L., Meier, D.L., & Lawrence, C.R. 2012, ApJ, 759, 86
- Worrall (2009) Worrall, D.M. 2009, A&ARv, 17, 1
- Worrall & Birkinshaw (2005) Worrall, D.M., & Birkinshaw, M. 2005, MNRAS, 360, 926
- Worrall & Birkinshaw (2006) Worrall, D.M., & Birkinshaw, M. 2006, Lect. Notes Phys., 693, 39
- Worrall et al. (1995) Worrall D.M., Birkinshaw, M., & Cameron, R.A. 1995, ApJ, 449, 93
- Worrall et al. (2001) Worrall D.M., Birkinshaw, M., & Hardcastle, M.J. 2001, MNRAS, 326, L7
- Worrall et al. (2007) Worrall D.M., Birkinshaw, M., Kraft, R.P., & Hardcastle, M.J. 2007, ApJ, 658, L79
- Worrall et al. (2012) Worrall D.M., Birkinshaw, M., Young, A.J., Momtahan, K., Fosbury, R.A.E., Morganti, R., Tadhunter, C.N., & Verdoes Kleijn, G. 2012, MNRAS, 424, 1346