The clustering of galaxies in the SDSS-III Baryon Oscillation Spectroscopic Survey: single-probe measurements from CMASS anisotropic galaxy clustering
Abstract
With the largest spectroscopic galaxy survey volume drawn from the SDSS-III Baryon Oscillation Spectroscopic Survey (BOSS), we can extract cosmological constraints from the measurements of redshift and geometric distortions at quasi-linear scales (e.g. above 50 Mpc). We analyze the broad-range shape of the monopole and quadrupole correlation functions of the BOSS Data Release 12 (DR12) CMASS galaxy sample, at the effective redshift , to obtain constraints on the Hubble expansion rate , the angular-diameter distance , the normalized growth rate , and the physical matter density . We obtain robust measurements by including a polynomial as the model for the systematic errors, and find it works very well against the systematic effects, e.g., ones induced by stars and seeing. We provide accurate measurements , , , = , , , , where is the comoving sound horizon at the drag epoch and Mpc is the sound scale of the fiducial cosmology used in this study. The parameters which are not well constrained by our galaxy clustering analysis are marginalized over with wide flat priors. Since no priors from other data sets, e.g., cosmic microwave background (CMB), are adopted and no dark energy models are assumed, our results from BOSS CMASS galaxy clustering alone may be combined with other data sets, i.e., CMB, SNe, lensing or other galaxy clustering data to constrain the parameters of a given cosmological model. The uncertainty on the dark energy equation of state parameter, , from CMB+CMASS is about 8 per cent. The uncertainty on the curvature fraction, , is 0.3 per cent. We do not find deviation from flat CDM.
keywords:
cosmology: observations - distance scale - large-scale structure of Universe - cosmological parameters1 Introduction
The cosmic large-scale structure from galaxy redshift surveys provides a powerful probe of dark energy and the cosmological model that is highly complementary to the cosmic microwave background (CMB) (e.g., Hinshaw et al. 2012; Ade et al. 2013a), supernovae (SNe) (Riess et al., 1998; Perlmutter et al., 1999), and weak lensing (e.g., see Van Waerbeke & Mellier 2003 for a review).
The scope of galaxy redshift surveys has dramatically increased in the last decade. The 2dF Galaxy Redshift Survey (2dFGRS) obtained 221,414 galaxy redshifts at (Colless et al., 2001, 2003), and the Sloan Digital Sky Survey (SDSS, York et al. 2000) collected 930,000 galaxy spectra in the Seventh Data Release (DR7) at (Abazajian et al., 2009). WiggleZ collected spectra of 240,000 emission-line galaxies at over 1000 square degrees (Drinkwater et al., 2010; Parkinson et al., 2012), and the Baryon Oscillation Spectroscopic Survey (BOSS, Dawson et al. 2013) of the SDSS-III (Eisenstein et al., 2011) is surveying 1.5 million luminous red galaxies (LRGs) at over 10,000 square degrees. The newest BOSS data set has been made publicly available in SDSS data release 12 (DR12, Alam et al. 2015; BOSS collaboration). The planned space mission Euclid111http://sci.esa.int/euclid will survey over 60 million emission-line galaxies at over 15,000 deg2 (e.g. Laureijs et al. 2011), and the upcoming ground-based experiment DESI222http://desi.lbl.gov/ (Dark Energy Spectroscopic Instrument) will survey 20 million galaxy redshifts up to and 600,000 quasars () over 14,000 deg2 (Schlegel et al., 2011). The proposed WFIRST333http://wfirst.gsfc.nasa.gov/ satellite would map 17 million galaxies in the redshift range over 3400 deg2, with a larger area possible with an extended mission (Green et al., 2012).
Large-scale structure data from galaxy redshift surveys can be analyzed using either the power spectrum or the two-point correlation function. Although these two methods are Fourier transforms of one another, the analysis processes, the statistical uncertainties, and the systematics are quite different and the results cannot be converted using Fourier transform directly because of the finite size of the survey volume. The SDSS-II Luminous Red Galaxy (LRG) (Eisenstein et al., 2001) data have been analyzed, and the cosmological results delivered, using both the power spectrum (see, e.g., Tegmark et al. 2004; Hutsi 2005; Padmanabhan et al. 2007; Blake et al. 2007; Percival et al. 2007, 2010; Reid et al. 2010; Montesano et al. 2011), and the correlation function method (see, e.g., Eisenstein et al. 2005; Okumura et al. 2008; Cabre & Gaztanaga 2009; Martinez et al. 2009; Sanchez et al. 2009; Kazin et al. 2010a; Chuang, Wang, & Hemantha 2012; Samushia et al. 2011; Padmanabhan et al. 2012; Xu et al. 2013; Oka et al. 2014; Hemantha et al. 2014). Similar analysis have been also applied on the SDSS-III BOSS galaxy sample (Anderson et al., 2012; Manera et al., 2013a; Nuza et al., 2013; Reid et al., 2012; Samushia et al., 2013a; Tojeiro et al., 2012; Anderson et al., 2014; Chuang et al., 2013; Sanchez et al., 2013a; Kazin et al., 2013; Wang, 2014; Anderson et al., 2014; Beutler et al., 2014; Samushia et al., 2014; Tojeiro et al., 2014; Reid et al., 2014; Alam et al., 2015; Gil-Marin et al., 2015a, b; Cuesta et al., 2016).
Galaxy clustering allows us to differentiate smooth dark energy and modified gravity as the cause for cosmic acceleration through the simultaneous measurements of the cosmic expansion history and the growth rate of cosmic large scale structure, (Guzzo et al., 2008; Wang, 2008; Blake et al., 2012). However, to measure , one must determine the galaxy bias , which requires measuring higher-order statistics of the galaxy clustering (see Verde et al. 2001). Song & Percival (2009) proposed using the normalized growth rate, , which would avoid the uncertainties from the galaxy bias. Percival & White (2009) developed a method to measure and applied it on simulations. Wang (2012) estimated expected statistical constraints on dark energy and modified gravity, including redshift-space distortions and other constraints from galaxy clustering, using a Fisher matrix formalism.
In principle, the Hubble expansion rate , the angular-diameter distance , the normalized growth rate , and the physical matter density can be well constrained by analyzing the galaxy clustering data alone. Eisenstein et al. (2005) demonstrated the feasibility of measuring and an effective distance, , from the SDSS DR3 (Abazajian et al., 2005) LRGs, where corresponds to a combination of and . Chuang & Wang (2012) measured and simultaneously using the galaxy clustering data from the two dimensional two-point correlation function of SDSS DR7 (Abazajian et al., 2009) LRGs. Chuang & Wang (2013a, b) improved the method and modelling to measure , , , and from the same data.
Samushia et al. (2011) determined from the SDSS DR7 LRGs. Blake et al. (2012) measured , , and from the WiggleZ Dark Energy Survey galaxy sample. Reid et al. (2012) and Chuang et al. (2013) measured , , and from the SDSS BOSS DR9 CMASS.
In this study, we apply the similar approach as Chuang & Wang (2013a, b) and Chuang et al. (2013) to determine , , and , which extracts a summary of the cosmological information from the large-scale structure of the SDSS BOSS DR12 CMASS alone by using very wide flat priors on the cosmological parameters which are not well constrained by galaxy clustering. We make some modifications from the methodologies used in previous works. First, we extract the cosmological information only using the correlation function at very large scales, i.e. Mpc to minimize the uncertainties from the effect at smaller scales, e.g., nonlinear effect, nonlinear redshift space distortion, and scale-dependent bias. Note that this strategy can only be applied to the analyses in configuration space since in Fourier space the uncertainties at small scales will propagate to wide range. We will validate our method using mock catalogues. Second, it is known that some observational systematics can distort the observed galaxy clustering at the large scales we are interested in (e.g., Ross et al. 2012). Although we apply the systematics weights to minimize their impact (see (Reid et al., 2016)), it is not granted that we have removed them completely. In this study, we include a polynomial as the model correcting observational systematic errors, e.g., ones induced by stars and seeing. We will show that our measurements are robust even in the case that we do not use the systematic weight corrections. One can combine our single-probe measurements with other data sets (i.e. CMB, SNe, etc.) to constrain the cosmological parameters of a given dark energy model.
This paper is organized as follows. In Section 2, we introduce the SDSS-III/BOSS DR12 CMASS galaxy sample and mock catalogues used in our study. In Section 3, we describe the details of the methodology that constrains cosmological parameters from our galaxy clustering analysis. In Section 4, we present our single-probe cosmological measurements. In Section 5, given some simple dark energy models, we present the cosmological constraints from our measurements and the combination with other data sets. In Section 6, we compare our measurements with the prediction of Planck assuming CDM and other measurements obtained from galaxy clustering data. We summarize and conclude in Section 7.
2 Data sets
2.1 The CMASS Galaxy Catalogues
The Sloan Digital Sky Survey (SDSS; Fukugita et al. 1996; Gunn et al. 1998; York et al. 2000; Smee et al. 2012) mapped over one quarter of the sky using the dedicated 2.5 m Sloan Telescope (Gunn et al., 2006). The Baryon Oscillation Sky Survey (BOSS, Eisenstein et al. 2011; Bolton et al. 2012; Dawson et al. 2013) is part of the SDSS-III survey. It is collecting the spectra and redshifts for 1.5 million galaxies, 160,000 quasars and 100,000 ancillary targets. The Data Release 12 (Alam et al., 2015; BOSS collaboration) has been made publicly available444http://www.sdss3.org/. We use galaxies from the SDSS-III BOSS DR12 CMASS catalogue in the redshift range . CMASS samples are selected with an approximately constant stellar mass threshold (Eisenstein et al., 2011); We are using 800853 CMASS galaxies. The effective redshifts of the sample are . The details of generating this sample are described in Reid et al. (2016).
2.2 The Mock Catalogues
For the data release 9, 10, and 11, PTHalos mock catalogues Manera et al. (2013a, b) were used for constructing the covariance matrix of the clustering measurements. For the data release 12 (this study), we use 2000 BOSS DR12 MultiDark-PATCHY (MD-PATCHY) mock galaxy catalogues (Kitaura et al., 2016) for validating our methodology and estimating the covariance matrix in this study. These mock catalogues were constructed using a similar procedure described in Rodriguez-Torres et al. 2015 where they constructed the BOSS DR12 lightcone mock catalogues using the MultiDark -body simulations (Klypin et al., 2014). However, instead of using -body simulations, the 2000 MD-PATCHY mocks catalogues were constructed using the PATCHY approximate simulations. These mocks are produced using ten boxes at different redshifts that are created with the PATCHY-code (Kitaura et al., 2014). The PATCHY-code can be composed into two parts: 1) computing approximate dark matter density field; and 2) populating galaxies from dark matter density field with the biasing model. The dark matter density field is estimated using Augmented Lagrangian Perturbation Theory (ALPT; Kitaura et al. (2013)) which combines the second order perturbation theory (2LPT) and spherical collapse approximation. The biasing model includes deterministic bias and stochastic bias (see Kitaura et al. (2014, 2015) for details). The velocity field is constructed based on the displacement field of dark matter particles. The modeling of finger-of-god has also been taken into account statistically. The mocks match the clustering of the galaxy catalogues for each redshift bin (see Kitaura et al. (2016) for details). The mock catalogues were constructed assuming CDM Planck cosmology with {}, and a Hubble constant () given by . As shown in a mock catalogue comparison study (Chuang et al. 2015), PATCHY mocks are accurate within 5% on scales larger than 5 Mpc/h (or smaller than 0.5 h/Mpc in Fourier space) for monopole and within 10-15% for quadrupole. Kitaura et al. (2016) had also demonstrated the accuracy of BOSS PATCHY mock catalogues which are in very good agreement with the observed data in terms of 2- and 3-point statistics.
3 Methodology
In this section, we describe the measurement of the multipoles of the correlation function from the observational data, construction of the theoretical prediction, and the likelihood analysis that leads to constraining cosmological parameters and dark energy.
3.1 Measuring the Two-Dimensional Two-Point Correlation Function
We convert the measured redshifts of the BOSS CMASS galaxies to comoving distances by assuming a fiducial model, i.e., flat CDM with and which is the same model adopted for constructing the mock catalogues (see Kitaura et al. 2016). We use the two-point correlation function estimator given by Landy & Szalay (1993):
| (1) |
where is the separation of a pair of objects and is the cosine of the angle between the directions between the line of sight (LOS) and the line connecting the pair the objects. DD, DR, and RR represent the normalized data-data, data-random, and random-random pair counts, respectively, for a given distance range. The LOS is defined as the direction from the observer to the centre of a galaxy pair. Our bin size is Mpc and . The Landy and Szalay estimator has minimal variance for a Poisson process. Random data are generated with the same radial and angular selection functions as the real data. One can reduce the shot noise due to random data by increasing the amount of random data. The number of random data we use is about 50 times that of the real data. While calculating the pair counts, we assign to each data point a radial weight of , where is the radial number density and Mpc3 (see Feldman et al. 1994). We include the combination of the observational weights assigned for each galaxy by
| (2) |
where is the final weight to assign on a galaxy ; is for removing the correlation between CMASS galaxies and both stellar density and seeing; and correct for missing objects due to the redshift failure and fiber collision. The details are described in Reid et al. (2016) (see also Ross et al. 2012). Later, we will also test the impact of systematics by removing from the analysis.
3.2 Theoretical Two-Dimensional Two-Point Correlation Function
The theoretical model for linear and quasi-linear scales can be constructed by first and higher order perturbation theory. One can compute the model by adding the first order nonlinear corrections to the linear theoretical model. There is no other fitting parameter besides the cosmological parameters (which will be introduced later in this paper). The procedure of constructing theoretical model for quasi-linear scales in redshift space is the following: First, we adopt the cold dark matter model and the simplest inflation model (adiabatic initial condition). Thus, we can compute the linear matter power spectra, , by using CAMB (Code for Anisotropies in the Microwave Background, Lewis, Challinor, & Lasenby 2000). The linear power spectrum can be decomposed into two parts:
| (3) |
where is the “no-wiggle” or pure CDM power spectrum calculated using Eq.(29) from Eisenstein & Hu (1998). is the “wiggled” part defined by Eq. (3). The nonlinear damping effect of the “wiggled” part, in redshift space, can be well approximated following Eisenstein, Seo, & White (2007) by
| (4) |
where is the cosine of the angle between and the LOS, is the growth rate, and is computed following Crocce & Scoccimarro (2006) and Matsubara (2008) by
| (5) |
The dewiggled power spectrum is
| (6) |
Besides the nonlinear redshift distortion introduced above, we include the linear redshift distortion as follows in order to obtain the galaxy power spectrum in redshift space at large scales (Kaiser, 1987),
| (7) |
where is the linear galaxy bias and is the linear redshift distortion parameter.
We compute the theoretical two-point correlation function, , for quasi-linear scales by Fourier transforming the non-linear power spectrum . This task is efficiently performed by using Legendre polynomial expansions and one-dimensional integral convolutions as introduced in Chuang & Wang (2013b). Power spectrum analysis is more sensitive to the nonlinear effects than the correlation function analysis since the uncertainty at small scales would propagate to wider range of k. To have some idea, one can compare Fig 4 and Fig 7 in Chuang et al. (2015) and will find that different mock catalogues have similar performance in configuration space but are very different in k-space. As shown in the Eisenstein, Seo, & White (2007), the damping of BAO is the major correction of the nonlinear effects in the configuration space at the scales interested, e.g. Mpc. In Fig 7 of Samushia et al. (2014), they showed that the growth rate measured using linear redshift distortion model could be biased by 3% when using the scales larger than Mpc. The accuracy is acceptable since the uncertainty of our measurement is about 12%.
3.3 Measure Multipoles of the Two-Point Correlation Function
The traditional multipoles of the two-point correlation function, in redshift space, are defined by
| (8) |
where is the Legendre Polynomial (0 and 2 here). We integrate over a spherical shell with radius , while actual measurements of are done in discrete bins. To compare the measured and our theoretical model, the last integral in Eq.(8) should be converted into a sum,
| (9) |
where Mpc in this work.
We are using the scale range Mpc and the bin size is 5 Mpc. The data points from the multipoles in the scale range considered are combined to form a vector, , i.e.,
| (10) |
where is the number of data points in each measured multipole; here . The length of the data vector depends on the number of multipoles used.
3.4 Model for Systematic Errors
It is well known that the observations could be contaminated by systematic effects. To obtain the robust and conservative measurements, we include a model for systematics. The model is a simple polynomial given by
| (11) |
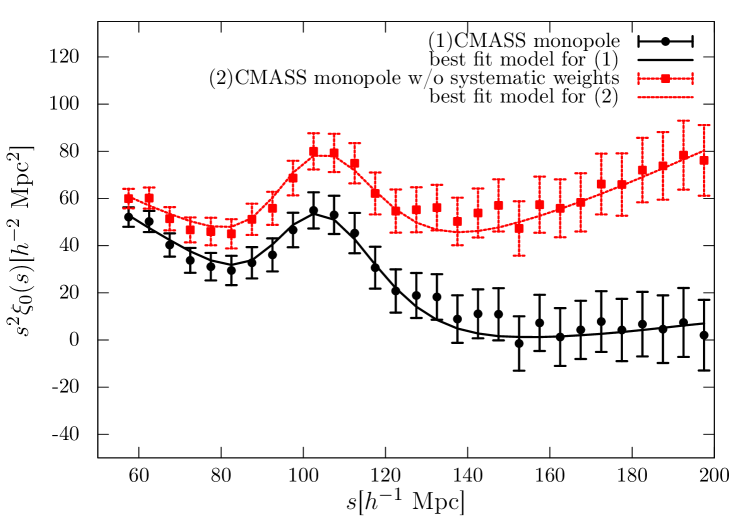
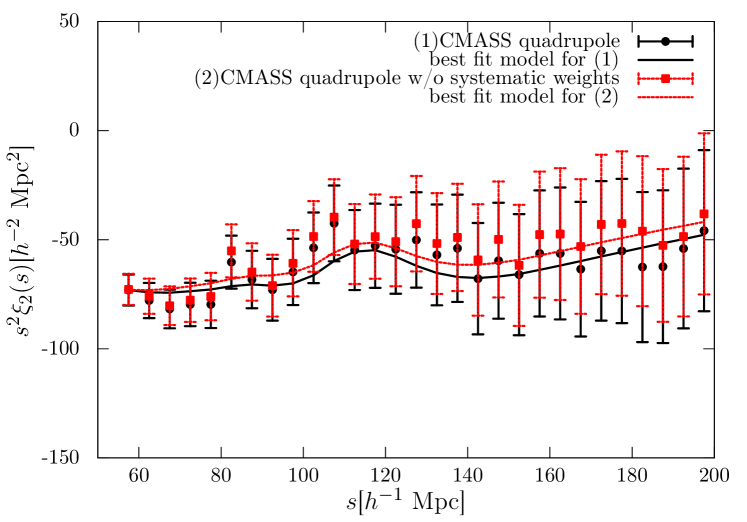
Since the quadrupole is insensitive to the systematics effects of which we are aware (see Fig. 1 or more details in Ross et al. 2012), we include the systematics model for only the monopole of the theoretical model by
| (12) |
where is the monopole derived from in Sec. 3.2. Note that is in the same form as the smooth function used in the BAO-only analyses (e.g., see Xu et al. 2013; Anderson et al. 2014). In those analyses, two smooth functions have been applied to remove the full shape information of monopole and quadrupole respectively. However, if we added the smooth function to quadrupole, we would not be able to measure . Fortunately, the quadrupole is insensitive to the systematics as shown in Fig. 1, so that we do not remove its full shape information and thus we can measure .
3.5 Covariance Matrix
We use the 2000 mock catalogues created by Kitaura et al. 2016 for the BOSS DR12 CMASS galaxy sample to estimate the covariance matrix of the observed correlation function. We calculate the multipoles of the correlation functions of the mock catalogues and construct the covariance matrix as
| (13) |
where
| (14) |
is the number of the mock catalogues, is the number of data bins, is the mean of the element of the vector from the mock catalogue multipoles, and is the value in the elements of the vector from the mock catalogue multipoles. The data vector is defined by Eq.(10). We also include the correction, , introduced by Hartlap et al. (2007).
3.6 Likelihood
The likelihood is taken to be proportional to (Press et al., 1992), with given by
| (15) |
where is the length of the vector used, is the vector from the theoretical model, and is the vector from the observed data.
As explained in Chuang & Wang (2012), instead of recalculating the observed correlation function while computing for different models, we rescale the theoretical correlation function to avoid rendering the values arbitrary. This approach can be considered as an application of Alcock-Paczynski effect (Alcock & Paczynski, 1979). The rescaled theoretical correlation function is computed by
| (16) |
where is defined in Sec. 3.2 and can be rewritten as
| (17) | |||||
where is the vector computed by eq. (9) from the rescaled theoretical correlation function, eq. (16), taking into account the modeling of observational systematics, eq. (11). is the vector from observed data measured with the fiducial model (see Chuang & Wang 2012 for more details regarding the rescaling method).
3.7 Markov Chain Monte-Carlo Likelihood Analysis
We perform Markov Chain Monte-Carlo likelihood analyses using CosmoMC (Lewis & Bridle, 2002). The parameter space that we explore spans the parameter set of , , , , , , , , , , . The quantities and are the matter and baryon density fractions, is the power-law index of the primordial matter power spectrum, is the dimensionless Hubble constant ( km s-1Mpc-1), and is the normalization of the power spectrum. The linear redshift distortion parameter can be expressed as . Thus, one can derive from the measured and . Among these parameters, only , , , , are well constrained using the BOSS galaxy sample alone in the scale range of interest. We marginalize over the other parameters, , , , , , , with the flat priors , , , , , , where the flat priors of and are centered on the Planck measurements with a width of ( is taken from Ade et al. 2013b). These priors are sufficiently wide to ensure that CMB constraints are not double counted when our results are combined with CMB data (Chuang, Wang, & Hemantha, 2012).
On the scales we use for comparison with the BOSS galaxy data, the theoretical correlation function only depends on cosmic curvature and dark energy through the parameters , , , and assuming that dark energy perturbations are unimportant (valid in the simplest dark energy models). Thus we are able to extract constraints from clustering data that are independent of dark energy.
4 Results
Fig.1 shows the effective monopole () and quadrupole () measured from the BOSS CMASS galaxy sample compared with the theoretical models given the parameters measured. For the CMASS sample, we also present the correlation function measured from the sample without including systematics weights for stars and seeing. We do not test with the systematics weights for fiber collisions and redshift failures because those only affect smallest scales (i.e. Mpc, see Ross et al. 2012). We will show that the measurements from our methodology are robust against these systematics. The minimum per degree of freedom is 0.95 for the correlation function computed including the systematics weights; the one without including the systematics weights is 1.05.
4.1 Measurements of Cosmological Parameters
With the increasing volume of the galaxy survey, one can obtain the cosmological constraints using the scales which can be modelled simply by perturbation theory (see Sec. 3.2). We now present the dark energy model independent measurements of the parameters , , , , and , obtained by using the method described in previous sections. We also present the derived parameters including , , and with
| (18) |
where is the comoving sound horizon at the drag epoch calculated using eq. (6) by CAMB and Mpc is the of the fiducial cosmology used in this study (same as the one used by the mock catalogues). is the effective distance which can be measured from the spherical averaged correlation function or power spectrum (e.g. see Eisenstein et al. 2005).
While and measurements are mainly determined by the BAO feature, is basically determined by the overall shape. In table 3, one can see that the correlations between and both and are small. Since the measurement of monopole is sensitive to the systematics (see Fig. 1), the measurement of would be also sensitive to the systematics and the constraint is weak. However, we still include while using our results to take into account the correlations between and .
Table 1 present our test using the mock catalogues. We apply our methodology on the mean of 2000 correlation functions from the mock catalogues and restore their input values within 0.4 which shows that one can obtain reasonable results even with such simple model we are using. Note that the simplicity/speed of the model is critical for this work since we are scanning very large parameter space (with wide flat priors) and including the nuisance parameters for modeling the observational systematics. We will investigate more accurate models in the future work (Chuang et al. in prep.)
Table 2 lists the mean, rms variance, and 68% confidence level limits for , , , , and derived in an MCMC likelihood analysis from the measured of the DR12 CMASS correlation function.
Table 3 presents the normalized covariance matrix for this parameter set measured using . The correlation between and or are close to zero. However, the correlation coefficient of and is about -0.5. Therefore, we include to our product while the constraint of is weak comparing to the one from CMB.
| mean of mocks | Input values | deviation | |
|---|---|---|---|
| fiducial results | no sys. weights | difference | |
|---|---|---|---|
4.2 Using Our Results from Galaxy Clustering only
In this section, we describe the steps to combine our results with other data sets assuming some dark energy models. Here, we use the results from CMASS quasi-linear scales as an example. For a given model and cosmological parameters, one can compute , , , . From Table 2 and 3, one can derive the covariance matrix, , of these three parameters. Then, can be computed by
| (19) |
where
| (20) |
and
| (21) |
where can be derived from table 2 and 3. Note table 3 shows the normalized covariance matrix , and can be derived by , where or are the standard deviations of the fiducial results in table 2.
5 Assuming Dark Energy Models
In this section, we present examples of combining our CMASS clustering results with the Planck CMB data (Adam et al., 2015) assuming specific dark energy models.
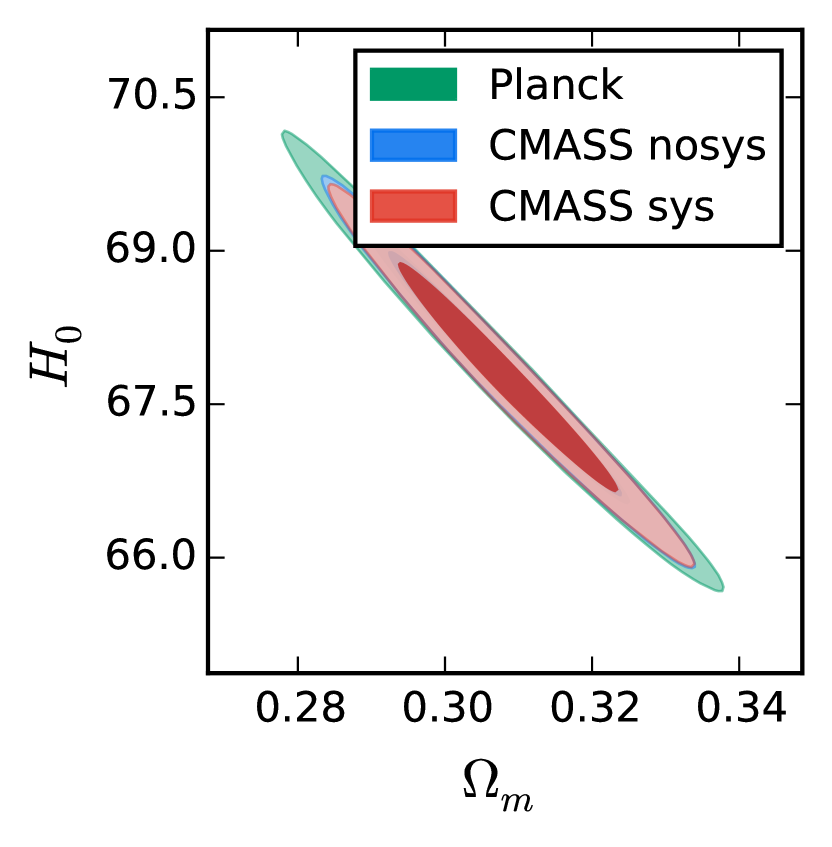
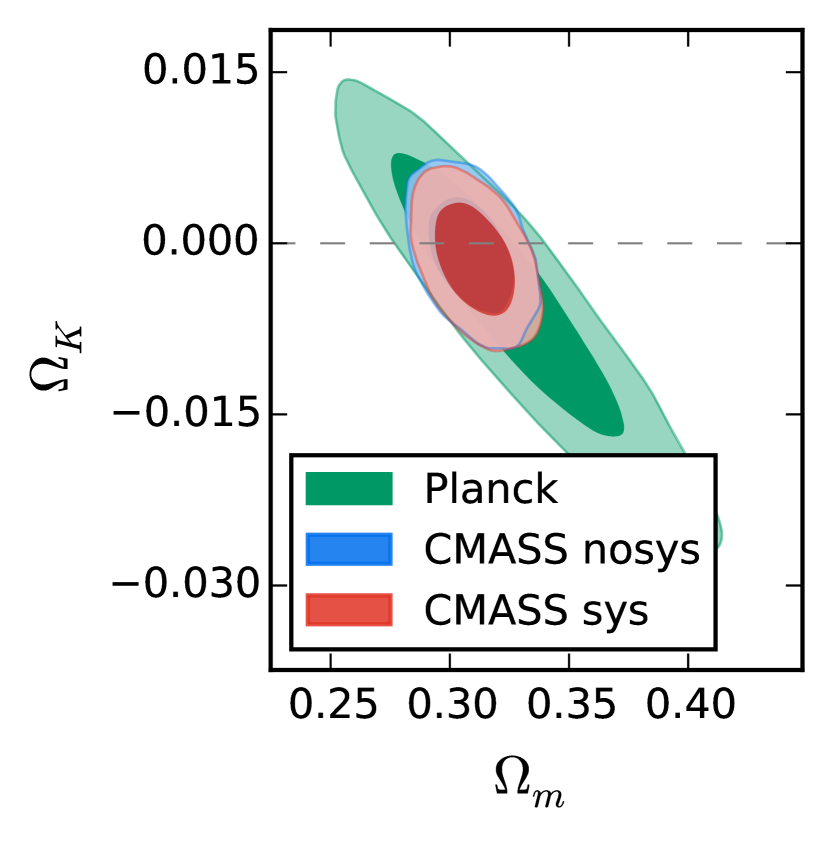
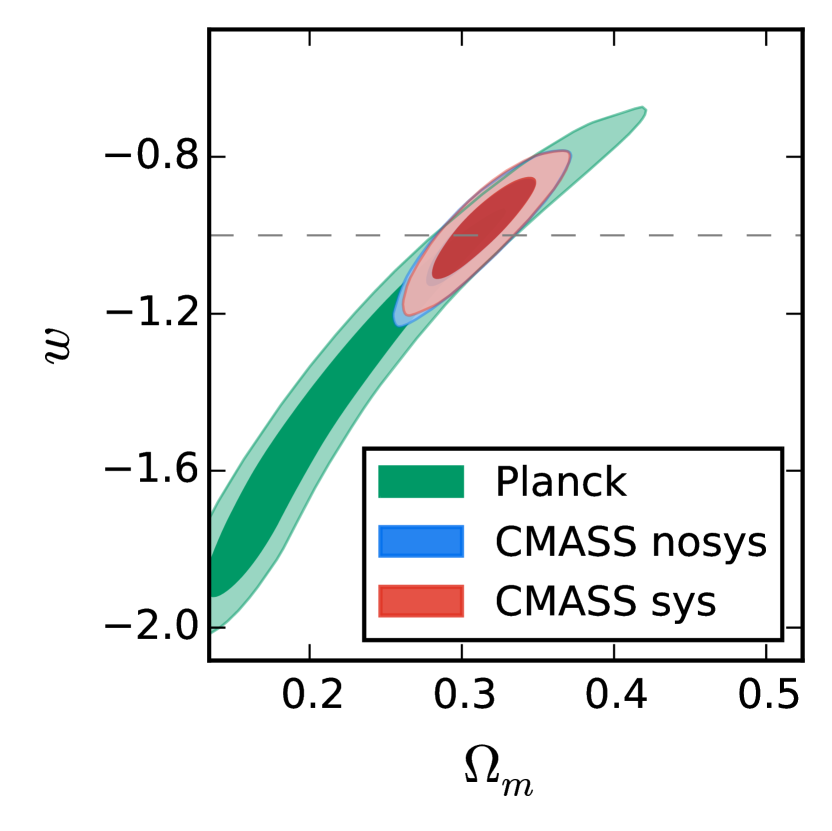
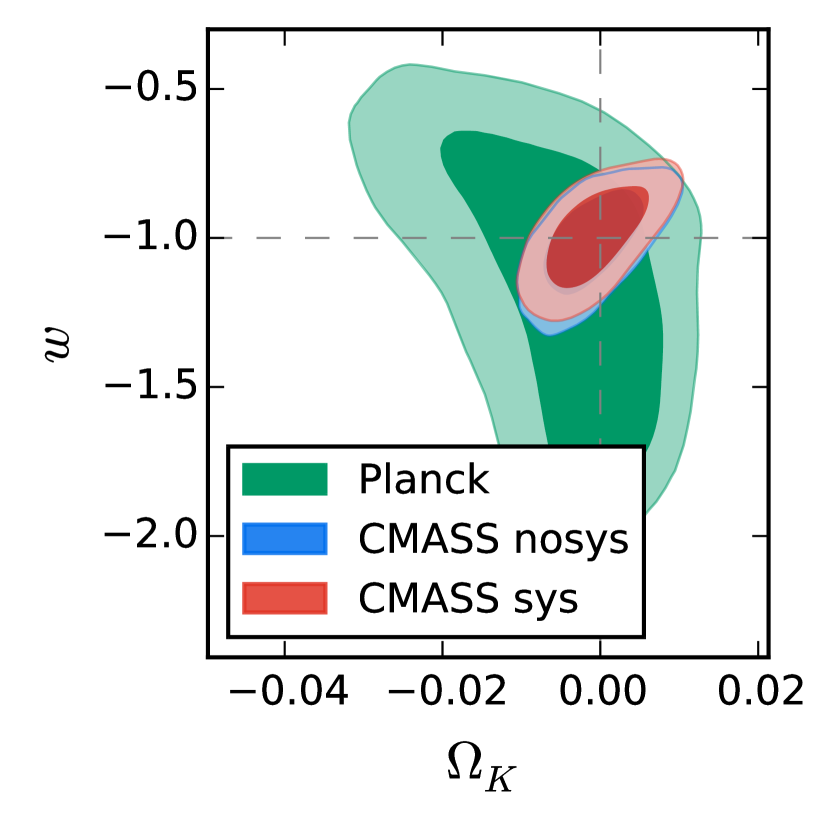
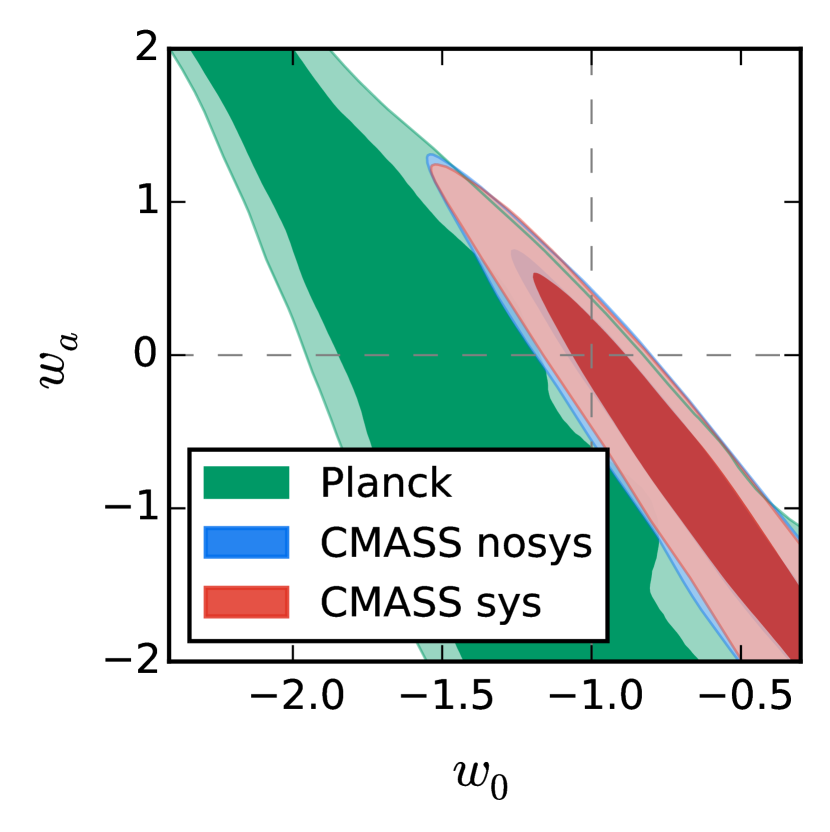
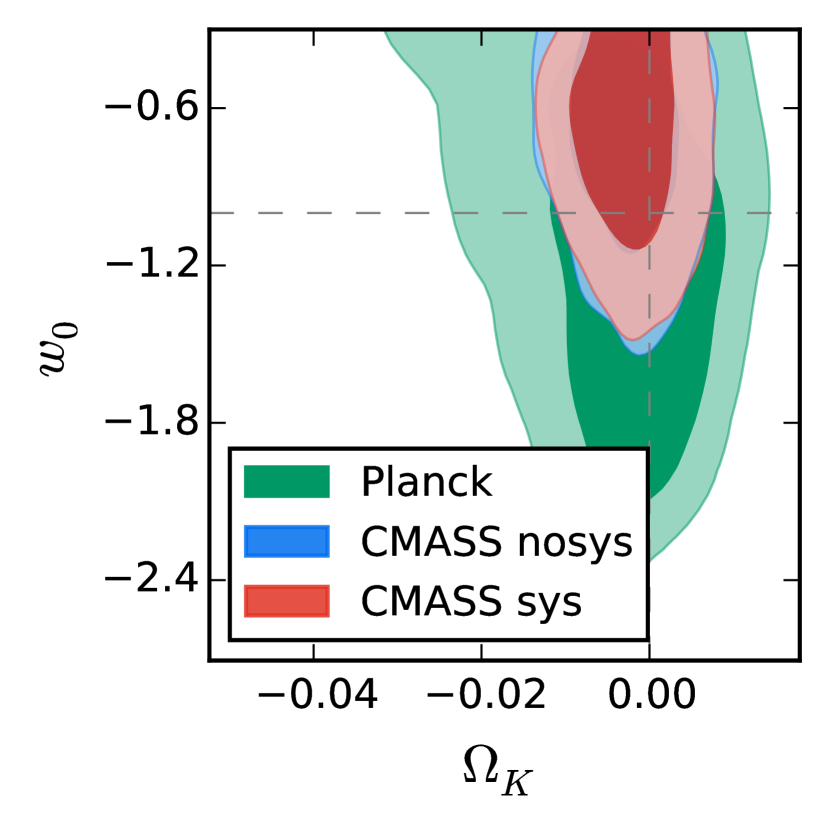
Table 4 shows the cosmological constraints assuming CDM, oCDM (non-flat CDM), CDM (constant equation of state of dark energy), oCDM, CDM, and oCDM. Table 5 shows the cosmological constraints obtained from the correlation function without observational systematics corrections. We find it agrees very well with Table 4. We also present the 2D marginalized contours comparing with Planck CMB data (Adam et al., 2015) in Fig. 2, 3, 4, 5, 6, and 7. One can see that the constraints obtained from our measurements without including observational systematics weights agree very well with the corrected ones. In addition, we do not find any deviation from CDM by testing various models.
| or | ||||||
|---|---|---|---|---|---|---|
| CDM | ||||||
| oCDM | ||||||
| CDM | ||||||
| oCDM | ||||||
| CDM | ||||||
| oCDM |
| or | ||||||
|---|---|---|---|---|---|---|
| CDM | ||||||
| oCDM | ||||||
| CDM | ||||||
| oCDM | ||||||
| CDM | ||||||
| oCDM |
6 COMPARISON WITH OTHER WORKS
The constraints on and are dominated by the 2-dimensional BAO feature. As shown in Fig. 13 of Anderson et al. (2014), the measurements were similar between the results from the analyses with (green) and without (blue and red) the full shape information. Note, in the same plot, the constraints from Reid et al. (2012) (purple) and Sanchez et al. (2013a) (black) were tighter because they either included much smaller scales or used stronger dark energy model assumption. The recent BAO-only measurements are replying on the BAO reconstruction methodologies, e.g., see Anderson et al. (2014); Cuesta et al. (2016); Gil-Marin et al. (2015a). In those analyses, the BAO feature was enhanced but the full shape information was removed. Therefore, the information obtained from the BAO-only measurements is different from ours. BAO-only analyses do not provide measurements which could be useful for testing gravity theory, e.g., see Samushia et al. (2013a, 2014); Beutler et al. (2014); Alam et al. (2015). Gil-Marin et al. (2015b) extracted the cosmological information from the full shape information using similar data sample as ours, but they performed the analysis in the Fourier space. The systematics considered in our studies have only impact on the small k-mode that they do not use. However, the nonlinear evolution and nonlinear redshift space distortion at small scales in configuration space would propagate to larger range of k-mode in Fourier space.
The redshift range used in our analysis for DR12 CMASS () is slightly different from the range used by Gil-Marin et al. (2015b) (). We intend to use larger volume of the sample to increase the statistics power since we drop smaller scales (Mpc) to minimize scale-dependent effects and measure unbiased growth rate as mentioned. If we rescale our measurements to the same effective redshift z=0.57 of Gil-Marin et al. (2015b), we obtain km/s, and ( is insensitive to the effective redshift). Despite of the different redshift range and methodology used, our measurements are in good agreement with the results from Gil-Marin et al. (2015b), km/s, , and .
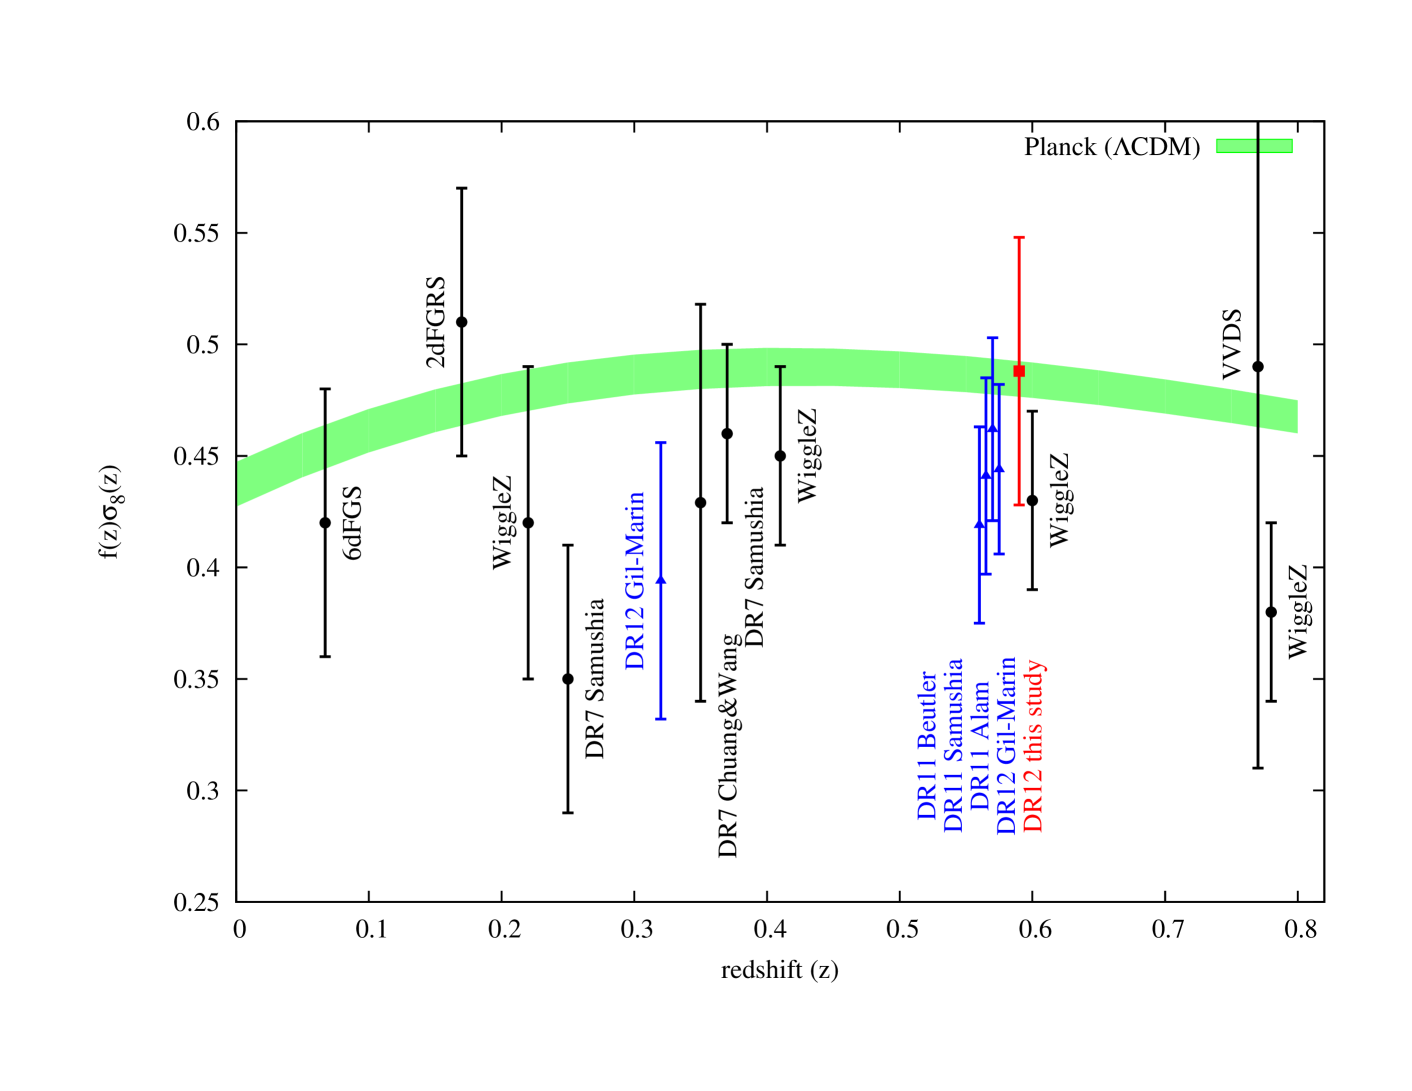
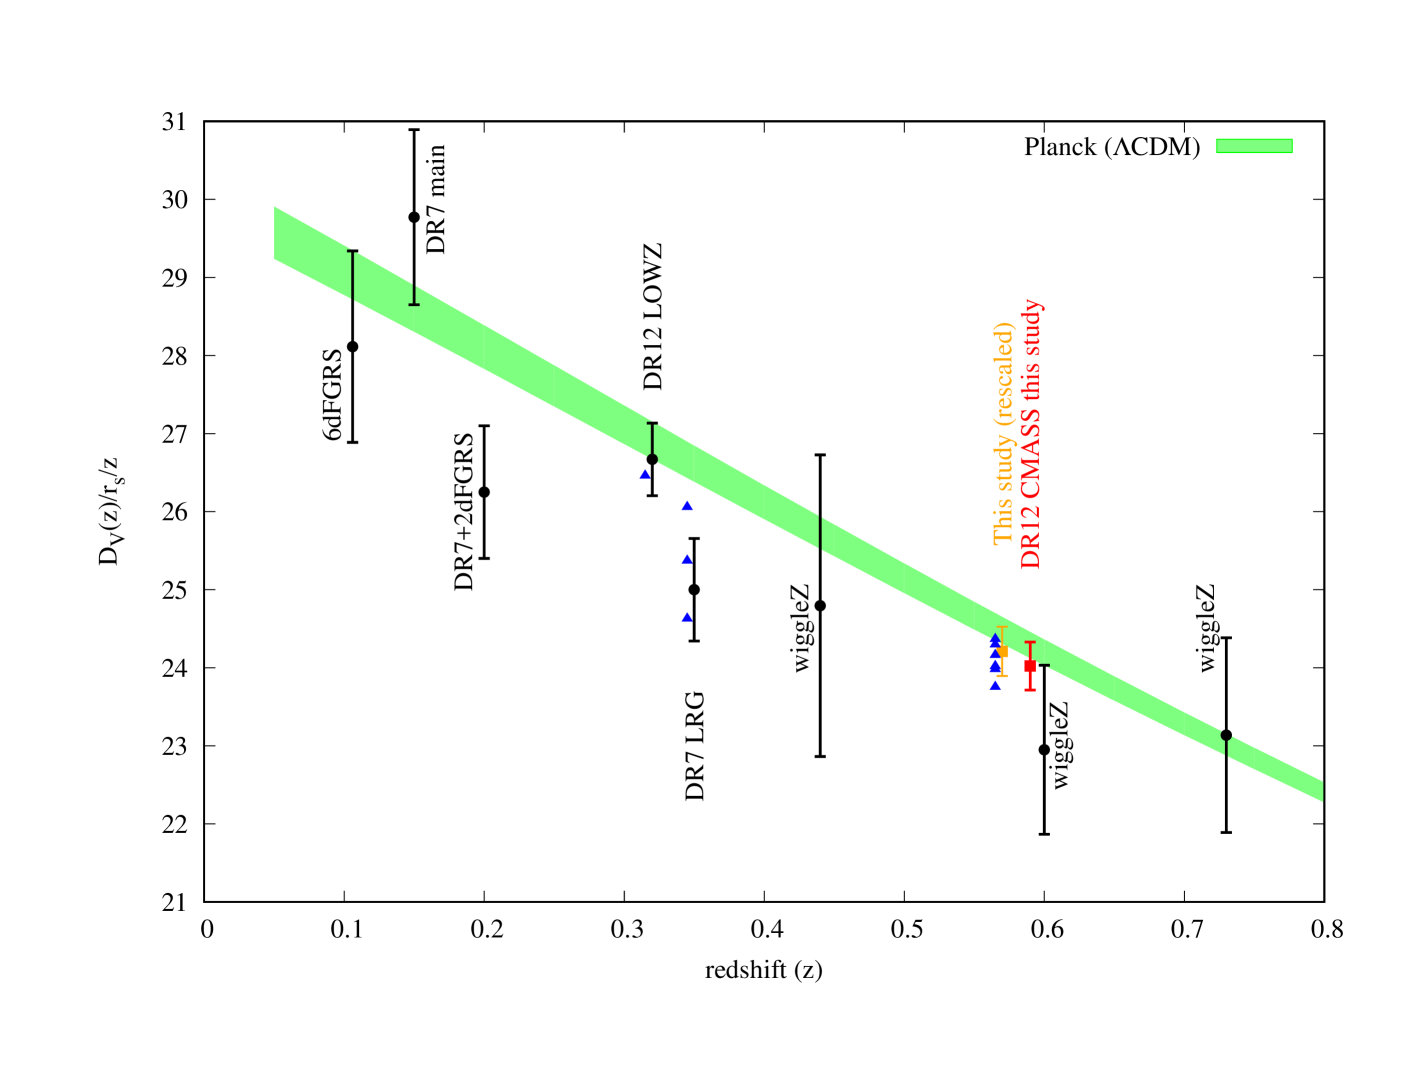
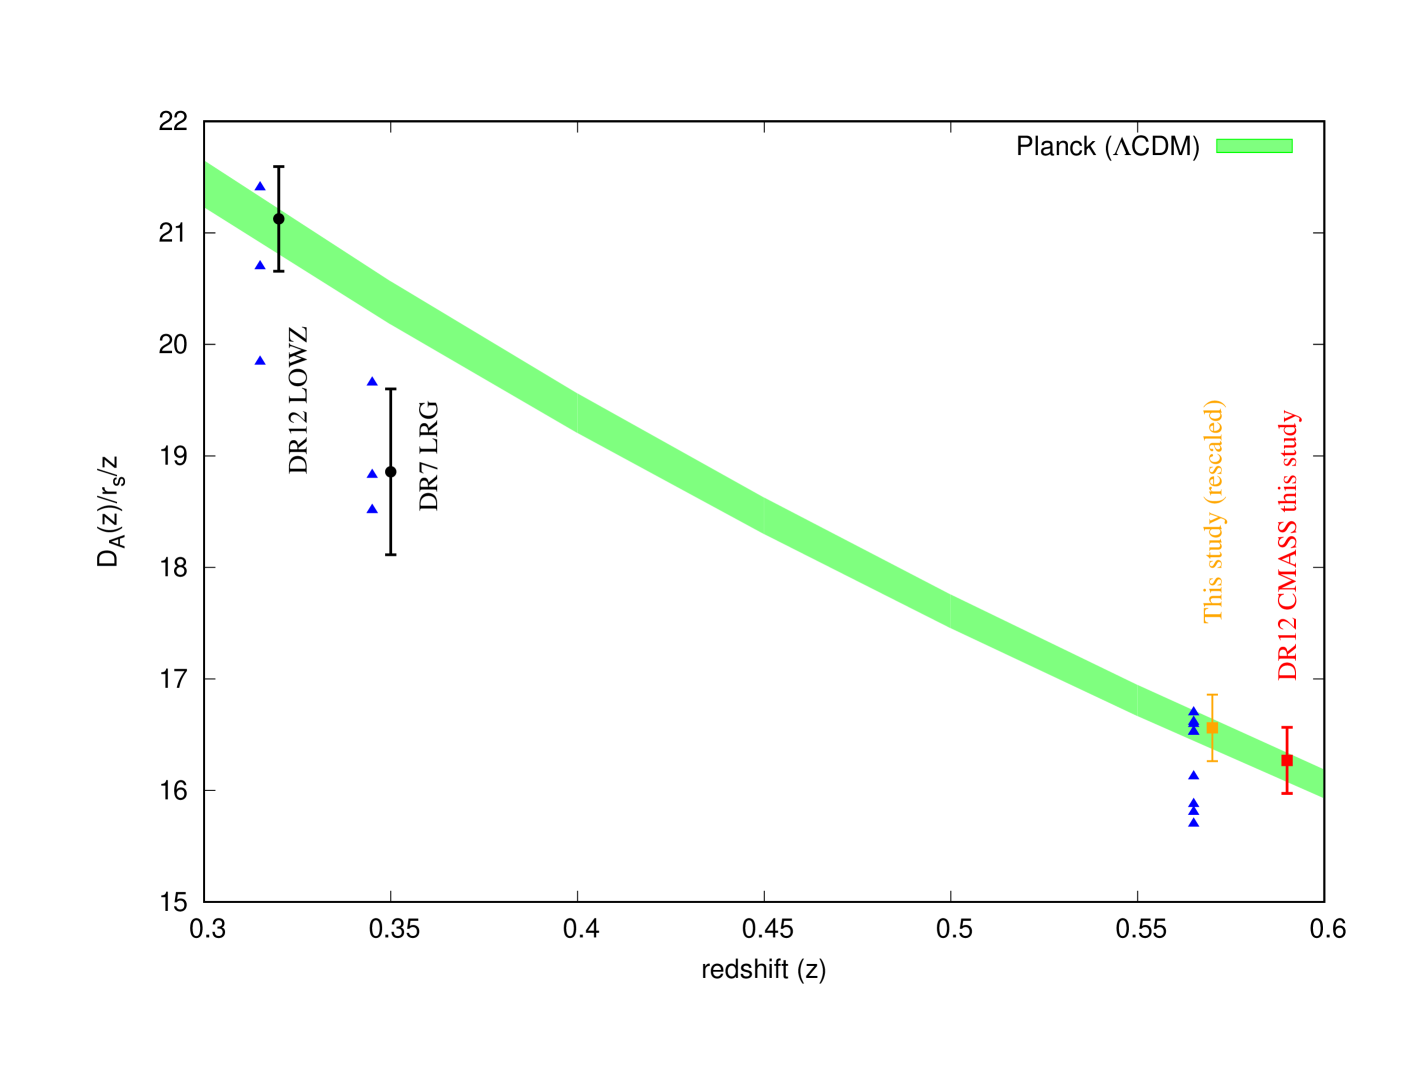
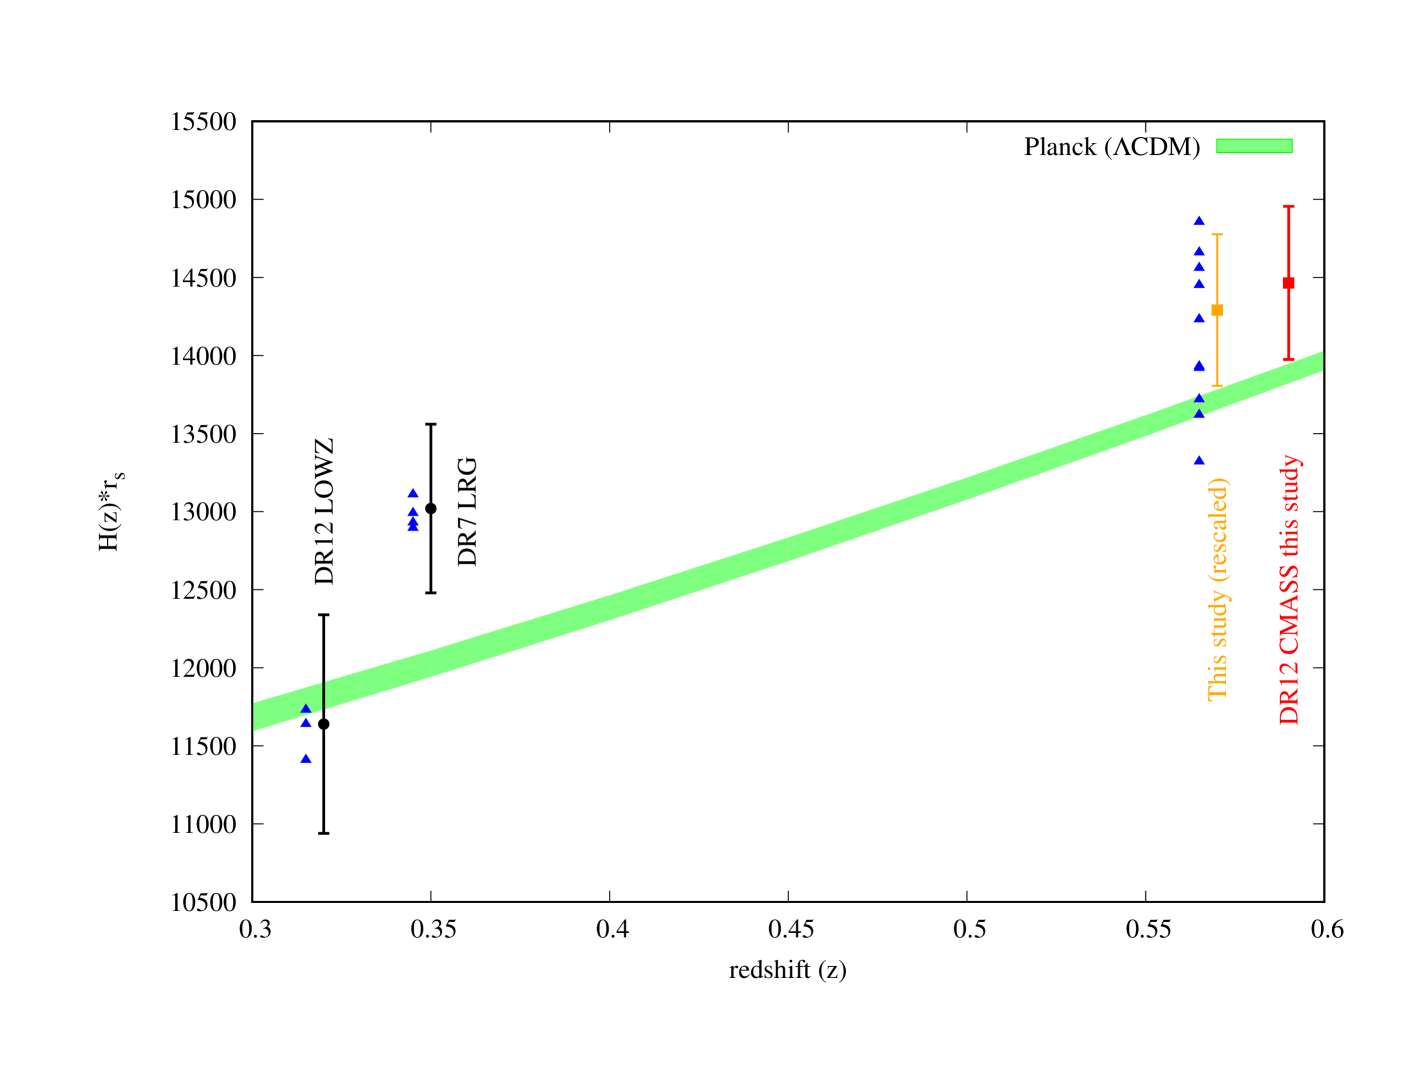
In Fig. 8, 9,10, and 11, we compare the constraints of , , , and from CMB data (Planck assuming LCDM) with the measurements from galaxy clustering analyses. We have included the measurements from VIMOS-VLT Deep Survey (VVDS;Guzzo et al. 2008), 2dFGRS (Percival et al., 2004), Six-degree-Field Galaxy Survey (6dFGS; Beutler et al. 2012), WiggleZ (Blake et al., 2011a, b), SDSS-II/DR7 (Percival et al., 2010; Chuang, Wang, & Hemantha, 2012; Samushia et al., 2011; Chuang & Wang, 2012, 2013a, 2013b; Ross et al., 2015; Padmanabhan et al., 2012; Xu et al., 2013; Seo et al., 2012; Hemantha et al., 2014) SDSS-III/BOSS (Anderson et al., 2012; Reid et al., 2012; Anderson et al., 2014; Chuang et al., 2013; Sanchez et al., 2013a; Kazin et al., 2013; Wang, 2014; Anderson et al., 2014; Beutler et al., 2014; Samushia et al., 2014; Tojeiro et al., 2014; Reid et al., 2014; Alam et al., 2015; Gil-Marin et al., 2015a, b; Cuesta et al., 2016)
In Fig. 9, 10, and 11, when there are multiple measurements that are corresponding the same redshifts, we show the mean and error bar for one of them (indicated in the captions) and show only the means with triangles for the rest of the measurements. We also slightly shift the redshift to make the figures more clear. One can see that the measurements of and from different analyses but at the same redshift agree with each other. However, the measurements of and have larger scatter. This is expected since measurement is driven by the BAO feature in the monopole and is mainly determined by the amplitude of quadrupole. But, and is correlated with the shape of BAO feature which has larger uncertainties among different models. In addition, we rescale our measurements of , , and , from the effective redshift (the points with red solid error bars) to (the orange points with thiner error bars) for the convenience of comparison with previous works. One can see our measurements are in agreement with others.
7 Summary
We present measurements of the anisotropic galaxy clustering from the DR12 CMASS samples of the SDSS-III Baryon Oscillation Spectroscopic Survey (BOSS). We analyze the broad-range shape of quasi-linear scales, which can be modeled by perturbation theory, of the monopole and quadrupole correlation functions to obtain cosmological constraints, at the effective redshift of the sample, on the Hubble expansion rate , the angular-diameter distance , the normalized growth rate , and the physical matter density . We obtain more robust measurements by including a polynomial as the model for the systematic errors. We find it works very well against the systematics effects, e.g. effects from stars and seeing. The parameters which are not well constrained by our galaxy clustering analysis are marginalized over with wide flat priors. Since no priors from other data sets (i.e., CMB) are adopted and no dark energy models are assumed, our results from BOSS CMASS galaxy clustering may be combined with other data sets, i.e., CMB, SNe, lensing or other galaxy clustering data to constrain the parameters of a given cosmological model. Our main results can be summarized as follows.
(i) Our measurements for DR12 CMASS (), using the range Mpc Mpc, are , , , = , , , , where is the comoving sound horizon at the drag epoch and is the of the fiducial cosmology used in this study.
(ii) In the case of the cosmological model assuming CDM, our single-probe constraints from CMASS quasi-linear scales, combined with CMB (Planck), yield the values for and kmMpc-1; considering oCDM (non-flat CDM), we obtain the curvature density fraction, ; adopting a constant dark energy equation of state and a flat universe (CDM), the constraint on dark energy equation of state parameter is .
(iii) Using our methodology and the correlation function measured without including the systematics weights corrections, we obtain the same results as the ones including the systematics weights corrections. We conclude that our measurements are robust against the known observational systematics.
8 Acknowledgement
C.C. would like to thank Savvas Nesseris for useful discussions.
C.C. and F.P. acknowledge support from the Spanish MICINN’s Consolider-Ingenio 2010 Programme under grant MultiDark CSD2009-00064 and AYA2010-21231-C02-01 grant. C.C. were also supported by the Comunidad de Madrid under grant HEPHACOS S2009/ESP-1473. MPI acknowledges support from MINECO under the grant AYA2012-39702-C02-01.
We acknowledge the use of the CURIE supercomputer at Très Grand Centre de calcul du CEA in France through the French participation into the PRACE research infrastructure, the SuperMUC supercomputer at Leibniz Supercomputing Centre of the Bavarian Academy of Science in Germany, the TEIDE-HPC (High Performance Computing) supercomputer in Spain, and the Hydra cluster at Instituto de Física Teórica, (UAM/CSIC) in Spain.
Funding for SDSS-III has been provided by the Alfred P. Sloan Foundation, the Participating Institutions, the National Science Foundation, and the U.S. Department of Energy Office of Science. The SDSS-III web site is http://www.sdss3.org/.
SDSS-III is managed by the Astrophysical Research Consortium for the Participating Institutions of the SDSS-III Collaboration including the University of Arizona, the Brazilian Participation Group, Brookhaven National Laboratory, Carnegie Mellon University, University of Florida, the French Participation Group, the German Participation Group, Harvard University, the Instituto de Astrofisica de Canarias, the Michigan State/Notre Dame/JINA Participation Group, Johns Hopkins University, Lawrence Berkeley National Laboratory, Max Planck Institute for Astrophysics, Max Planck Institute for Extraterrestrial Physics, New Mexico State University, New York University, Ohio State University, Pennsylvania State University, University of Portsmouth, Princeton University, the Spanish Participation Group, University of Tokyo, University of Utah, Vanderbilt University, University of Virginia, University of Washington, and Yale University.
References
- (1)
- Anderson et al. (2013) Anderson, L. et al. [SDSS Collaboration],
- Abazajian et al. (2005) K. Abazajian et al. [SDSS Collaboration], Astron. J. 129, 1755 (2005) [astro-ph/0410239].
- Abazajian et al. (2009) Abazajian, K. N., et al. [SDSS Collaboration], Astrophys. J. Suppl. 182, 543 (2009) [arXiv:0812.0649 [astro-ph]].
- Adam et al. (2015) R. Adam et al. [Planck Collaboration], arXiv:1502.01582 [astro-ph.CO].
- Ade et al. (2013a) Ade, P. A. R. et al. [Planck Collaboration], arXiv:1303.5062 [astro-ph.CO].
- Ade et al. (2013b) Ade, P. A. R. et al. [Planck Collaboration], arXiv:1303.5076 [astro-ph.CO].
- Ahn et al. (2012) Ahn, C. P. et al. [SDSS Collaboration], Astrophys. J. Suppl. 203, 21 (2012) [arXiv:1207.7137 [astro-ph.IM]].
- Ahn et al. (2013) Ahn, C. P. et al. [SDSS Collaboration], arXiv:1307.7735 [astro-ph.IM].
- Aihara et al. (2011) H. Aihara et al. [SDSS Collaboration], Astrophys. J. Suppl. 193, 29 (2011) [Erratum-ibid. 195, 26 (2011)] [arXiv:1101.1559 [astro-ph.IM]].
- Alam et al. (2015; BOSS collaboration) S. Alam et al. [SDSS-III Collaboration], Astrophys. J. Suppl. 219, no. 1, 12 (2015) doi:10.1088/0067-0049/219/1/12 [arXiv:1501.00963 [astro-ph.IM]].
- Alam et al. (2015) S. Alam, S. Ho, M. Vargas-Magaña and D. P. Schneider, Mon. Not. Roy. Astron. Soc. 453, 1754 (2015) doi:10.1093/mnras/stv1737 [arXiv:1504.02100 [astro-ph.CO]].
- Alcock & Paczynski (1979) Alcock, C., and Paczynski, B., Nature 281, 358 (1979).
- Anderson et al. (2012) Anderson, L.; Aubourg, E.;Bailey, S.; Bizyaev, D.; Blanton, M.; Bolton, A. S.; Brinkmann, J.; and Brownstein, J. R. et al., Mon. Not. Roy. Astron. Soc. 428, 1036 (2013) [arXiv:1203.6594 [astro-ph.CO]].
- Anderson et al. (2014) L. Anderson et al., Mon. Not. Roy. Astron. Soc. 439, no. 1, 83 (2014) doi:10.1093/mnras/stt2206 [arXiv:1303.4666 [astro-ph.CO]].
- Anderson et al. (2014) L. Anderson et al. [BOSS Collaboration], Mon. Not. Roy. Astron. Soc. 441, no. 1, 24 (2014) doi:10.1093/mnras/stu523 [arXiv:1312.4877 [astro-ph.CO]].
- Bennett et al. (2012) Bennett, C. L.; Larson, D.; J. Weiland, L.; Jarosik, N.; Hinshaw, G.; Odegard, N.; Smith, K. M.; and Hill, R. S. et al., arXiv:1212.5225 [astro-ph.CO].
- Beutler et al. (2012) Beutler, F. et al., Mon. Not. Roy. Astron. Soc. 423, 3430 (2012) [arXiv:astro-ph/1204.4725].
- Beutler et al. (2014) F. Beutler et al. [BOSS Collaboration], Mon. Not. Roy. Astron. Soc. 443, no. 2, 1065 (2014) doi:10.1093/mnras/stu1051 [arXiv:1312.4611 [astro-ph.CO]].
- Blake et al. (2007) Blake, C.; Collister, A.; Bridle, S.; and Lahav, O., Mon. Not. Roy. Astron. Soc. 374, 1527 (2007) [arXiv:astro-ph/0605303].
- Blake et al. (2011a) Blake, C. et al., Mon. Not. Roy. Astron. Soc. 418, 1707 (2011) [arXiv:astro-ph/1108.2635].
- Blake et al. (2011b) Blake, C. et al., Mon. Not. Roy. Astron. Soc. 418, 1725 (2011) [arXiv:astro-ph/1108.2637].
- Blake et al. (2012) Blake, C.; Brough, S.; Colless, M.; Contreras, C.; Couch, W.; Croom, S.; Croton, D.; and Davis, T. et al., Mon. Not. Roy. Astron. Soc. 425, 405 (2012) [arXiv:1204.3674 [astro-ph.CO]].
- Bolton et al. (2012) Bolton, A. S.; Schlegel, D. J.; Aubourg, E.; Bailey, S.; Bhardwaj, V.; Brownstein, J. R.; Burles, S.; and Chen, Y. -M. et al., Astron. J. 144, 144 (2012) [arXiv:1207.7326 [astro-ph.CO]].
- Cabre & Gaztanaga (2009) Cabre, A.; and Gaztanaga, E., Mon. Not. Roy. Astron. Soc. 393, 1183 (2009) [arXiv:0807.2460 [astro-ph]].
- Chuang, Wang, & Hemantha (2012) Chuang, C. -H.; Wang, Y.; and Hemantha, M. D. P., Mon. Not. Roy. Astron. Soc. 423, 1474 (2012) [arXiv:1008.4822 [astro-ph.CO]].
- Chuang & Wang (2012) Chuang, C. -H. and Wang, Y. Mon. Not. Roy. Astron. Soc. 426, 226 (2012) [arXiv:1102.2251 [astro-ph.CO]].
- Chuang & Wang (2013a) Chuang, C. -H. and Wang, Y. Mon. Not. Roy. Astron. Soc. 431, 2634 (2013) [arXiv:1205.5573 [astro-ph.CO]].
- Chuang & Wang (2013b) Chuang, C. -H. and Wang, Y. Mon. Not. Roy. Astron. Soc. 435, 255 (2013) [arXiv:1209.0210 [astro-ph.CO]].
- Chuang et al. (2013) C. -H. Chuang, F. Prada, A. J. Cuesta, D. J. Eisenstein, E. Kazin, N. Padmanabhan, A. G. Sanchez and X. Xu et al., Mon. Not. Roy. Astron. Soc. 433, 3559 (2013) [arXiv:1303.4486 [astro-ph.CO]].
- Chuang et al. (2015) C. H. Chuang et al., Mon. Not. Roy. Astron. Soc. 452, no. 1, 686 (2015) doi:10.1093/mnras/stv1289 [arXiv:1412.7729 [astro-ph.CO]].
- Colless et al. (2001) Colless, M., et al. [The 2DFGRS Collaboration], Mon. Not. Roy. Astron. Soc. 328, 1039 (2001) [arXiv:astro-ph/0106498].
- Colless et al. (2003) Colless, M.; Peterson, B. A.; Jackson, C.; Peacock, J. A.; Cole, S.; Norberg, P.; Baldry, I. K.; and Baugh, C. M. et al., astro-ph/0306581.
- Crocce & Scoccimarro (2006) Crocce, M., and Scoccimarro, R., Phys. Rev. D 73, 063520 (2006) [arXiv:astro-ph/0509419].
- Cuesta et al. (2016) A. J. Cuesta et al., Mon. Not. Roy. Astron. Soc. 457, 1770 (2016) doi:10.1093/mnras/stw066 [arXiv:1509.06371 [astro-ph.CO]].
- Dawson et al. (2013) Dawson , K. S.et al. [BOSS Collaboration], Astron. J. 145, 10 (2013) arXiv:1208.0022 [astro-ph.CO].
- Drinkwater et al. (2010) Drinkwater, M. J.; Jurek, R. J.; Blake, C.; Woods, D.; Pimbblet, K. A.; Glazebrook, K.; Sharp, R.; and Pracy, M. B. et al., Mon. Not. Roy. Astron. Soc. 401, 1429 (2010) [arXiv:0911.4246 [astro-ph.CO]].
- Eisenstein & Hu (1998) Eisenstein, D. J.; and Hu, W., Astrophys. J. 496, 605 (1998) [arXiv:astro-ph/9709112].
- Eisenstein et al. (2001) Eisenstein, D. J., et al. [SDSS Collaboration], Astron. J. 122, 2267 (2001) [arXiv:astro-ph/0108153].
- Eisenstein et al. (2005) Eisenstein, D. J., et al. [SDSS Collaboration], Astrophys. J. 633, 560 (2005) [arXiv:astro-ph/0501171].
- Eisenstein, Seo, & White (2007) Eisenstein, D. J.; Seo, H. -j.; and White, M. J. Astrophys. J. 664, 660 (2007) [astro-ph/0604361].
- Eisenstein et al. (2011) Eisenstein, D.J., et al., 2011, AJ, 142, 72
- Feldman et al. (1994) Feldman, H. A.; Kaiser, N.; and Peacock, J. A. Astrophys. J. 426, 23 (1994) [astro-ph/9304022].
- Fukugita et al. (1996) Fukugita, M.; Ichikawa, T.; Gunn, J. E.; Doi, M.; Shimasaku, K.; and Schneider, D. P., Astron. J. 111, 1748 (1996).
- Gil-Marin et al. (2015a) H. Gil-Marín et al., arXiv:1509.06373 [astro-ph.CO].
- Gil-Marin et al. (2015b) H. Gil-Marín et al., arXiv:1509.06386 [astro-ph.CO].
- Green et al. (2012) Green, J.; Schechter, P.; Baltay, C.; Bean, R.; Bennett, D.; Brown, R.; Conselice, C.; and Donahue, M. et al., arXiv:1208.4012 [astro-ph.IM].
- Gunn et al. (1998) Gunn, J. E., et al. [SDSS Collaboration], Astron. J. 116, 3040 (1998) [arXiv:astro-ph/9809085].
- Gunn et al. (2006) Gunn, J. E., et al. [SDSS Collaboration], Astron. J. 131, 2332 (2006) [arXiv:astro-ph/0602326].
- Guzzo et al. (2008) Guzzo, L., et al., 2008, Nature, 451, 541
- Hartlap et al. (2007) J. Hartlap, P. Simon and P. Schneider, Astron. Astrophys. 464, 399 (2007) [[astro-ph/0608064]].
- Hemantha et al. (2014) M. D. P. Hemantha, Y. Wang and C. H. Chuang, Mon. Not. Roy. Astron. Soc. 445, no. 4, 3737 (2014) doi:10.1093/mnras/stu1997 [arXiv:1310.6468 [astro-ph.CO]].
- Hinshaw et al. (2012) Hinshaw, G.; Larson, D.; Komatsu, E.; Spergel, D. N.; Bennett, C. L.; Dunkley, J.; Nolta, M. R.; and Halpern, M. et al., arXiv:1212.5226 [astro-ph.CO].
- Hutsi (2005) Hutsi, G., arXiv:astro-ph/0507678.
- Kaiser (1987) Kaiser, N., Mon. Not. Roy. Astron. Soc. 227, 1 (1987).
- Kazin et al. (2010a) Kazin, E. A., et al., Astrophys. J. 710, 1444 (2010) [arXiv:0908.2598 [astro-ph.CO]].
- Kazin et al. (2013) E. A. Kazin, A. G. Sanchez, A. J. Cuesta, F. Beutler, C. -H. Chuang, D. J. Eisenstein, M. Manera and N. Padmanabhan et al., arXiv:1303.4391 [astro-ph.CO].
- Kitaura et al. (2013) F. S. Kitaura and S. Hess, Mon. Not. Roy. Astron. Soc. 435, 78 (2013) doi:10.1093/mnrasl/slt101 [arXiv:1212.3514 [astro-ph.CO]].
- Kitaura et al. (2014) F. S. Kitaura, G. Yepes and F. Prada, Mon. Not. Roy. Astron. Soc. 439, 21 (2014) doi:10.1093/mnrasl/slt172 [arXiv:1307.3285 [astro-ph.CO]].
- Kitaura et al. (2015) F. S. Kitaura, H. Gil-Marín, C. Scoccola, C. H. Chuang, V. Müller, G. Yepes and F. Prada, Mon. Not. Roy. Astron. Soc. 450, no. 2, 1836 (2015) doi:10.1093/mnras/stv645 [arXiv:1407.1236 [astro-ph.CO]].
- Kitaura et al. (2016) F. S. Kitaura et al., Mon. Not. Roy. Astron. Soc. 456, 4156 (2016) doi:10.1093/mnras/stv2826 [arXiv:1509.06400 [astro-ph.CO]].
- Klypin et al. (2014) A. Klypin, G. Yepes, S. Gottlober, F. Prada and S. Hess, arXiv:1411.4001 [astro-ph.CO].
- Landy & Szalay (1993) Landy, S. D. and Szalay, A. S., Astrophys. J. 412, 64 (1993).
- Landy (2002) Landy, S. D., “The Pairwise Velocity Distribution Function of Galaxies in the LCRS, 2dF, Astrophys. J. 567, L1 (2002) [arXiv:astro-ph/0202130].
- Laureijs et al. (2011) Laureijs, R., et al., “Euclid Definition Study Report”, arXiv:1110.3193
- Lewis, Challinor, & Lasenby (2000) Lewis, A.; Challinor, A.; and Lasenby, A., Astrophys. J. 538, 473 (2000) [arXiv:astro-ph/9911177].
- Lewis & Bridle (2002) Lewis, A. and Bridle, S., Phys. Rev. D 66, 103511 (2002) [arXiv:astro-ph/0205436].
- Manera et al. (2013a) Manera, M.; Scoccimarro, R.; Percival, W. J.; Samushia, L.; McBride, C. K.; Ross, A.; Sheth, R.; and White, M. et al., Mon. Not. Roy. Astron. Soc. 428, 1036 (2013) [arXiv:1203.6609 [astro-ph.CO]].
- Manera et al. (2013b) Manera et al. in preparation.
- Martinez et al. (2009) Martinez, V. J., et al., Astrophys. J. 696, L93 (2009) [Erratum-ibid. 703, L184 (2009)] [Astrophys. J. 703, L184 (2009)] [arXiv:0812.2154 [astro-ph]].
- Matsubara (2008) Matsubara, T., Phys. Rev. D 77, 063530 (2008) [arXiv:0711.2521 [astro-ph]].
- Montesano et al. (2011) Montesano, F.; Sanchez, A. G.; and Phleps, S., arXiv:1107.4097 [astro-ph.CO].
- Nuza et al. (2013) Nuza, S. E.; Sanchez, A. G.; Prada, F.; Klypin, A.; Schlegel, D. J.; Gottloeber, S.; Montero-Dorta, A. D.; and Manera, M. et al., Mon. Not. Roy. Astron. Soc. 432, 743 (2013) [arXiv:1202.6057 [astro-ph.CO]].
- Oka et al. (2014) A. Oka, S. Saito, T. Nishimichi, A. Taruya and K. Yamamoto, Mon. Not. Roy. Astron. Soc. 439, 2515 (2014) doi:10.1093/mnras/stu111 [arXiv:1310.2820 [astro-ph.CO]].
- Okumura et al. (2008) Okumura, T.; Matsubara, T.; Eisenstein, D. J.; Kayo, I.; Hikage, C.; Szalay, A. S.; and Schneider, D. P., Astrophys. J. 676, 889 (2008) [arXiv:0711.3640 [astro-ph]].
- Padmanabhan et al. (2007) Padmanabhan, N., et al. [SDSS Collaboration], Mon. Not. Roy. Astron. Soc. 378, 852 (2007) [arXiv:astro-ph/0605302].
- Padmanabhan et al. (2012) Padmanabhan, N.; Xu, X.; Eisenstein, D. J.; Scalzo, R.; Cuesta, A. J.; Mehta, K. T.; and Kazin, E., arXiv:1202.0090 [astro-ph.CO].
- Parkinson et al. (2012) Parkinson, D.; Riemer-Sorensen, S.; Blake, C.; Poole, G. B.; Davis, T. M.; Brough, S.; Colless, M.; and Contreras, C. et al., Phys. Rev. D 86, 103518 (2012) [arXiv:1210.2130 [astro-ph.CO]].
- Peebles (1980) Peebles, P. J. E. 1980, The Large-Scale Structure of the Universe (Princeton, NJ: Princeton University Press)
- Percival et al. (2004) W. J. Percival et al. [2dFGRS Collaboration], Mon. Not. Roy. Astron. Soc. 353, 1201 (2004) doi:10.1111/j.1365-2966.2004.08146.x [astro-ph/0406513].
- Percival et al. (2007) Percival, W. J.; Cole, S.; Eisenstein, D. J.; Nichol, R. C.; Peacock, J. A.; Pope, A. C.; and Szalay, A. S., Mon. Not. Roy. Astron. Soc. 381, 1053 (2007) [arXiv:0705.3323 [astro-ph]].
- Percival & White (2009) Percival, W. J and White, M. Mon. Not. Roy. Astron. Soc. 393, 297 (2009) [arXiv:0808.0003 [astro-ph]].
- Percival et al. (2010) Percival, W. J., et al., Mon. Not. Roy. Astron. Soc. 401, 2148 (2010) [arXiv:0907.1660 [astro-ph.CO]].
- Perlmutter et al. (1999) Perlmutter, S., et al. [Supernova Cosmology Project Collaboration], Astrophys. J. 517, 565 (1999) [arXiv:astro-ph/9812133].
- Press et al. (1992) Press W.H., Teukolsky S,A., Vetterling W.T., Flannery B.P., 1992, Numerical recipes in C. The art of scientific computing, Second edition, Cambridge: University Press.
- Ratcliffe et al. (1998) Ratcliffe, A.; Shanks, T.; Fong, R.; and Parker, Q. A. Mon. Not. Roy. Astron. Soc. 296, 191 (1998) [astro-ph/9702228].
- Reid et al. (2010) Reid, B. A.; Percival, W. J.; Eisenstein, D. J.; Verde, L.; Spergel, D. N.; Skibba, R. A.; Bahcall, N. A.; and Budavari, T. et al., Mon. Not. Roy. Astron. Soc. 404, 60 (2010) [arXiv:0907.1659 [astro-ph.CO]].
- Reid et al. (2012) Reid, B. A.; Samushia, L.; White, M.; Percival, W. J.; Manera, M.; Padmanabhan, N.; Ross, A. J.; and Sanchez, A. G. et al., Mon. Not. Roy. Astron. Soc. 426, 2719 (2012) [arXiv:1203.6641 [astro-ph.CO]].
- Reid et al. (2014) B. A. Reid, H. J. Seo, A. Leauthaud, J. L. Tinker and M. White, Mon. Not. Roy. Astron. Soc. 444, no. 1, 476 (2014) doi:10.1093/mnras/stu1391 [arXiv:1404.3742 [astro-ph.CO]].
- Reid et al. (2016) B. Reid et al., Mon. Not. Roy. Astron. Soc. 455, no. 2, 1553 (2016) doi:10.1093/mnras/stv2382 [arXiv:1509.06529 [astro-ph.CO]].
- Riess et al. (1998) Riess, A. G., et al. [Supernova Search Team Collaboration], Astron. J. 116, 1009 (1998) [arXiv:astro-ph/9805201].
- Rodriguez-Torres et al. (2015) S. A. Rodríguez-Torres et al., arXiv:1509.06404 [astro-ph.CO].
- Ross et al. (2012) Ross, A. J. et al. [BOSS Collaboration], Mon. Not. Roy. Astron. Soc. 424, 564 (2012) [arXiv:1203.6499 [astro-ph.CO]].
- Ross et al. (2015) A. J. Ross, L. Samushia, C. Howlett, W. J. Percival, A. Burden and M. Manera, Mon. Not. Roy. Astron. Soc. 449, no. 1, 835 (2015) doi:10.1093/mnras/stv154 [arXiv:1409.3242 [astro-ph.CO]].
- Sanchez et al. (2009) Sanchez, A. G.; Crocce, M.; Cabre, A.; Baugh, C. M.; and Gaztanaga, E., Mon. Not. Roy. Astron. Soc. 400, 1643 (2009) [arXiv:0901.2570 [astro-ph]].
- Sanchez et al. (2013a) A. G. Sanchez, E. A. Kazin, F. Beutler, C. -H. Chuang, A. J. Cuesta, D. J. Eisenstein, M. Manera and F. Montesano et al., Mon. Not. Roy. Astron. Soc. 433, 1202 (2013) [arXiv:1303.4396 [astro-ph.CO]].
- Sanchez et al. (2013b) Sanchez, A. et al., submitted
- Samushia et al. (2011) Samushia, L.; Percival, W. J.; and Raccanelli, A., Mon. Not. Roy. Astron. Soc. 420, 2102 (2012) [arXiv:1102.1014 [astro-ph.CO]].
- Samushia et al. (2013a) Samushia, L.; Reid, B. A.; White, M.; Percival, W. J.; Cuesta, A. J.; Lombriser, L.; Manera, M.; and Nichol, R. C. et al., Mon. Not. Roy. Astron. Soc. 429, 1514 (2013) [arXiv:1206.5309 [astro-ph.CO]].
- Samushia et al. (2014) L. Samushia et al., Mon. Not. Roy. Astron. Soc. 439, no. 4, 3504 (2014) doi:10.1093/mnras/stu197 [arXiv:1312.4899 [astro-ph.CO]].
- Schlegel et al. (2011) Schlegel, D. et al. [BigBoss Experiment Collaboration], arXiv:1106.1706 [astro-ph.IM].
- Seo et al. (2012) Seo, H., et al. , Astrophys. J. 761, 1, 13 (2012) [arXiv:astro-ph/1201.2172].
- Smee et al. (2012) Smee, S.; Gunn, J. E.; Uomoto, A.; Roe, N.; Schlegel, D.; Rockosi, C. M.; Carr, M. A.; and Leger, F. et al., arXiv:1208.2233 [astro-ph.IM].
- Song & Percival (2009) Song, Y.-S.; Percival, W. J., 2009, JCAP, 10, 004
- Tegmark et al. (2004) Tegmark, M., et al. [SDSS Collaboration], Astrophys. J. 606, 702 (2004) [arXiv:astro-ph/0310725].
- Tojeiro et al. (2012) Tojeiro, R.; Percival, W. J.; Brinkmann, J.; Brownstein, J. R.; Eisenstein, D.; Manera, M.; Maraston, C.; and McBride, C. K. et al., Mon. Not. Roy. Astron. Soc. 424, 2339 (2012) [arXiv:1203.6565 [astro-ph.CO]].
- Tojeiro et al. (2014) R. Tojeiro et al., Mon. Not. Roy. Astron. Soc. 440, no. 3, 2222 (2014) doi:10.1093/mnras/stu371 [arXiv:1401.1768 [astro-ph.CO]].
- Van Waerbeke & Mellier (2003) Van Waerbeke, L. and Mellier, Y. astro-ph/0305089.
- Verde et al. (2001) Verde, L.; Heavens, A. F.; Percival, W. J.; Matarrese, S.; Baugh, C. M.; Bland-Hawthorn, J.; Bridges, T.; and Cannon, R. et al., [astro-ph/0112161].
- Wang (2008) Wang, Y., 2008, JCAP, 05, 021
- Wang (2012) Wang, Y., 2012, MNRAS, 423, 3631
- Wang, Chuang & Mukherjee (2012) Wang, Y.; Chuang, C. -H.; and Mukherjee, P., Phys. Rev. D 85, 023517 (2012) [arXiv:1109.3172 [astro-ph.CO]].
- Wang (2014) Y. Wang, Mon. Not. Roy. Astron. Soc. 443, no. 4, 2950 (2014) doi:10.1093/mnras/stu1374 [arXiv:1404.5589 [astro-ph.CO]].
- Xu et al. (2013) Xu, X.; Cuesta, A. J.; Padmanabhan, N.; Eisenstein, D. J.; and McBride, C. K., Mon. Not. Roy. Astron. Soc. 431, 2834 (2013) [arXiv:1206.6732 [astro-ph.CO]].
- York et al. (2000) York, D. G. et al. [SDSS Collaboration], Astron. J. 120, 1579 (2000) [astro-ph/0006396].