Further author information:
E-mail: stefankr@umich.edu, Telephone: +1 734 615 7374
New opportunities with spectro-interferometry and spectro-astrometry
Abstract
Latest-generation spectro-interferometric instruments combine a milliarcsecond angular resolution with spectral capabilities, resulting in an immensely increased information content. Here, I present methodological work and results that illustrate the fundamentally new scientific insights provided by spectro-interferometry with very high spectral dispersion or in multiple line transitions (Brackett and Pfund lines). In addition, I discuss some pitfalls in the interpretation of spectro-interferometric data. In the context of our recent studies on the classical Be stars CMi and Tau, I present the first position-velocity diagram obtained with optical interferometry and provide a physical interpretation for a phase inversion, which has in the meantime been observed for several classical Be-stars. In the course of our study on the Herbig B[e] star V921 Sco, we combined, for the first time, spectro-interferometry and spectro-astrometry, providing a powerful and resource-efficient way to constrain the spatial distribution as well as the kinematics of the circumstellar gas with an unprecedented velocity resolution up to . Finally, I discuss our phase sign calibration procedure, which has allowed us to calibrate AMBER differential phases and closure phases for all spectral modes, and derive from the gained experience science-driven requirements for future instrumentation projects.
keywords:
spectro-interferometry, spectro-astrometry, photocenter analysis, position-velocity diagram, kinematical modeling, multiple line transition interferometry, V921 Sco, CMi, Tau1 INTRODUCTION
One of the most remarkable features of the latest-generation optical interferometric instruments is their capability to combine a milliarcsecond angular resolution with high spectral dispersion, enabling velocity-resolved studies in spectral lines. Spectro-interferometric instruments with sufficient resolution for velocity-resolved studies () have now been implemented at various facilities operating at near-infrared (VLTI/AMBER[1]: up to ; Keck/V2-SPR[2]: ), mid-infrared (ISI[3]: up to ), and visual wavelengths (CHARA/VEGA[4]: up to ). The primary observables provided by these instruments are spectra and wavelength-differential visibilities, phases (DPs), and closure phases (CPs, in the case of the combination of 3 or more apertures).
The aim of this paper is to discuss some applications enabled by this exciting new technique, to outline challenges and pitfalls in the astrophysical interpretation, and to identify the most important limiting factors of this technique. In addition, I would like to highlight the highly complementary nature of optical long-baseline spectro-interferometry and spectro-astrometric observations obtained with conventional high-resolution spectrographs. For this purpose, I will present studies that we have conducted on the classical Be stars CMi[5] and Tau[5] and the B[e] star V921 Sco[6, 7] using the AMBER instrument. Utilizing the VLTI 8.2m unit telescopes and the fringe phase-tracking instrument FINITO[8, 9], AMBER covers an interesting parameter space in terms of high spectral dispersion (enabling velocity-resolved studies), a good sensitivity (enabling studies on fainter object classes), and the availability of multiple baselines (enabling detailed studies of the 2-D gas distribution and velocity field). However, most of the presented strategies and arguments are not limited to VLTI, but are applicable to spectro-interferometric instruments in general.
2 SPECTRO-INTERFEROMETRY
2.1 PHOTOCENTER ANALYSIS
The DP[10, 11] information measured by spectro-interferometers provides a particularly powerful observable to constrain the gas velocity field in astrophysical objects. In first-order approximation, DPs measure the displacement of the line emission with respect to the continuum emission, although one has to be aware that this approximation breaks down if the line-emitting region is significantly resolved by the interferometer.
Given that each baseline measures only the projection of the photocenter[12] displacement vector along the baseline vector, it is highly desirable to obtain multiple measurements and to probe a wide range of position angles (PAs). Such multi-baseline interferometric measurements allow one to recover the 2-D photocenter displacement vector[13] using the relation
| (1) |
where is the DP measured on baseline , is the corresponding baseline vector, and is the central wavelength. As noted above, this set of linear equations is only valid for spatially unresolved or marginally resolved objects[14, 15]. The equations are already overdetermined with a single 3-telescope measurement (), providing a useful cross-check whether the assumption is justified or whether the measured DPs trace higher-order geometric effects. The precision of the derived photocenter vector depends both on the achievable DP accuracy as well as the uniformity of the PA coverage that has been achieved in the observations.
In case the photocenter analysis method is applicable, it can provide basic, yet powerful information about the gas kinematics on unprecedentedly small angular scales. For instance, with a typical DP accuracy of , it is possible to measure photocenter displacements of milliarcseconds (mas), approaching the micro-arcsecond regime. In a recent study[5] we observed the classical Be star CMi using AMBER’s high spectral dispersion mode () and measured strong non-zero DPs, as well as a strong visibility drop within the line (Fig. 1A, top, left panel). Applying eq. 1 to the data reveals that the blue- and red-shifted line wings are displaced in opposite directions with respect to the star (Fig. 1A, middle, left panel). The PA of the line photocenter displacement () is consistent with the measured orientation of the continuum-emitting circumstellar disk (, as determined with CHARA/MIRC continuum interferometry[5]), indicating a rotation-dominated velocity field.
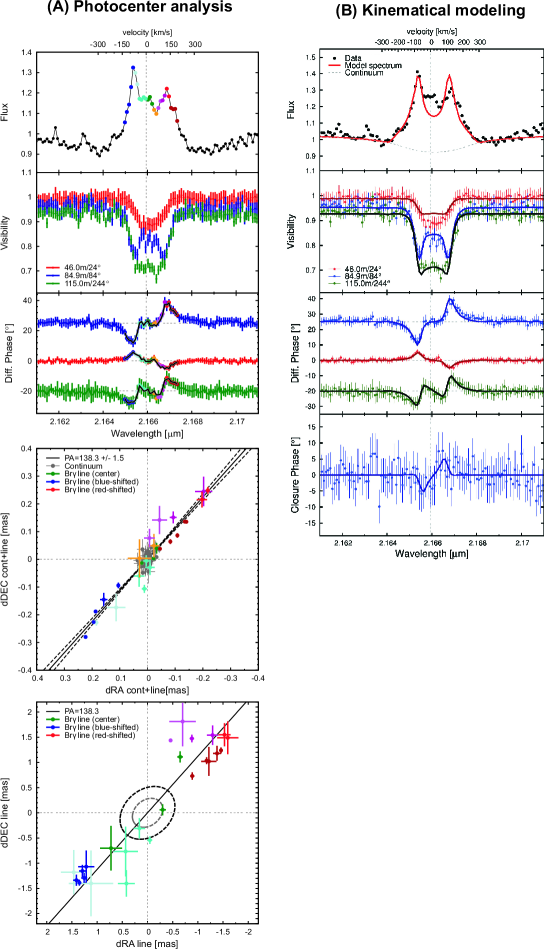
Using the aforementioned procedure, it is possible to measure the direction of the photocenter displacement, while the length of the displacement vector is biased by the contributions from the underlying continuum emission. In order to remove these contributions from the observables measured by the interferometer (, , ), we interpolate the continuum flux () and continuum visibility () from the adjacent continuum. The visibility and DP of the pure line-emitting region[13] (, ) are then given by
| (2) | |||||
| (3) |
where denotes the flux contribution from the spectral line. Given that the quantities in eqs. 2+3 are associated with independent uncertainties, the continuum-corrected DP will exhibit a significantly larger uncertainty than the measured continuum+line DP , which also translates in larger error bars for the derived line photocenter offset vectors (in particular for weak spectral lines).
Applying this correction to our CMi data (Fig. 1A, bottom, left panel) yields that the amplitude of the line displacement is about mas and that the displacement in the blue- and red-shifted line wing is rather symmetric, suggesting that CMi does not exhibit a significant one-armed oscillation, as found for other Be stars[16].
It should be noted that eqs. 2+3 require absolute-calibrated visibilities, which are difficult to extract from spectro-interferometric observations with high spectral dispersion. In order to achieve a sufficient signal-to-noise ratio (SNR), such observations require long detection integration times and an active stabilization of the atmosphere-induced fringe phase modulations, in our study using the VLTI/FINITO instrument. The fringe stabilization leaves residual phase jitter that degenerates the visibility amplitude on the science beam combiner in an uncontrollable way. As a result, the visibility amplitude cannot be calibrated reliably, and complementary observations without fringe tracking and in low spectral dispersion are required in order to recalibrate the absolute visibility level. Effectively, this doubles the total observing time and causes practical problems with respect to matching the -sampling and to minimizing the time interval between the two measurements, which constitutes a severe problem for time-variable objects, such as Be-stars or young stellar objects.
2.2 POSITION-VELOCITY DIAGRAMS
In radio interferometry, position-velocity diagrams constitute a vital element for the analysis of kinematical signatures and to constrain, for instance, the rotation profile of gas disks around galactic nuclei[17]. These diagrams can be constructed either from velocity-resolved “channel maps” or from astrometric measurements in maser emission.
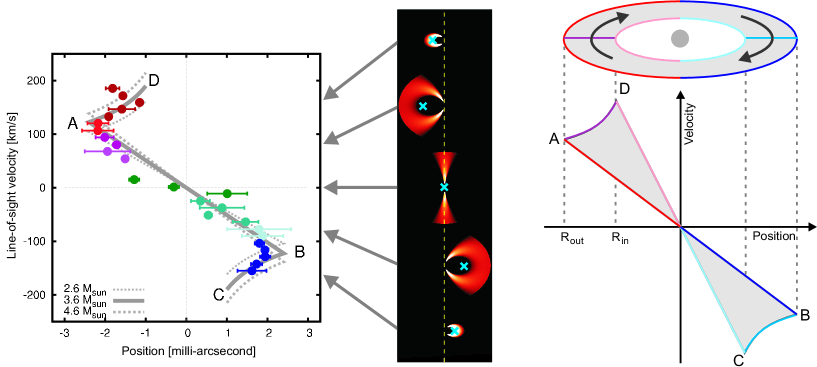
In our study on CMi[5], we constructed an equivalent diagram based on the photocenter offsets derived from our optical interferometry data. For this purpose, we convert the wavelength of each spectral channel to the corresponding Doppler velocity and plot it against the length of the continuum-corrected photocenter vectors (which we projected beforehand onto the determined disk plane; Fig. 1). The resulting diagram (Fig. 2, left) shows that the stellocentric emission radius of the line-emitting gas increases approximately linearly with velocity for low/medium velocities ( km s-1; line A-B in Fig. 2, left) and then reaches a maximum value at about km s-1. At higher gas velocities ( km s-1; arcs A-D and B-C in Fig. 2, left), the emission radius decreases again. This behaviour can be explained in a Keplerian-rotation scenario, assuming that the disk extends from an inner radius to an outer radius (Fig. 2, right): If we first consider only gas orbiting at the outer radius , then it is clear that the lowest projected velocity appears along the line-of-sight (position 0), while the maximum projected velocity will appear at separation , as observed in line A-B. Gas located at the inner radius will occupy a similar line in the position-velocity diagram, even though the maximum separation will now be smaller () and the maximum velocity will be higher, given that the velocity in a Keplerian-rotating disk increases with . Filling in the intermediate radii results then in the characteristic “bowtie”-shaped region shown in Fig. 2 (right; grey filled area). Comparing the size of the emitting area for the different emission annuli, it is clear that our astrometric measurements are dominated by the emission from the outer-most disk radius (line A-B) as well as the high-velocity wings (arcs A-D and B-C), explaining the measured position-velocity curve of CMi. Based on these considerations, it is possible to construct a simple analytic model[5], which can be fitted to the derived position-velocity diagram (Fig. 2, left; grey curve). From this model, we derive the mass of the central star to M, which is in agreement with the value derived using a more sophisticated modeling approach (Sect. 2.3).
Overall, position-velocity diagrams provide a very intuitive and model-independent method for the interpretation of velocity-resolved astrometric observations and can be constructed already from a single 3-telescope spectro-interferometric observation.
2.3 KINEMATICAL MODELING: CONSTRAINING THE DETAILED GAS-VELOCITY FIELD
Photocenter offsets and position-velocity diagrams provide a straightforward and model-independent method to obtain first-order kinematical information, which can already be sufficient to discern between competing models, such as rotating disks or the ejection of material in bipolar outflows. In order to distinguish between more complex velocity fields and to derive quantitative constraints, it is necessary to employ a more sophisticated model fitting approach.
Kinematical modeling was also crucial in solving a puzzle concerning a phase inversion that appears in the center of the Br-line in our CMi data. Earlier spectro-interferometric observations on Be stars with lower spectral dispersion (e.g. Arae[18]) have shown a simple S-shaped signature that can be interpreted very intuitively in terms of a disk rotation scenario, where the approaching (blue-shifted) disk part is displaced in the opposite direction from the receding (red-shifted) disk part. However, our AMBER observations on CMi (Fig. 1) reveal a W-shaped profile, with a clear phase sign inversion in the line center. Stefl et al.[19] observed this phase inversion also in various other Be stars, including Tau, Col, Sco, CMa, and 48 Lib, and proposed that the phase inversion might indicate either secondary dynamical effects or the need for an additional kinematical component beyond the canonical star+disk paradigm, such as a polar jet.
In a first interpretation attempt, we investigated whether the phase inversion might be explained with the presence of a hidden photospheric Br absorption component underlying the circumstellar Br emission. Assuming that the stellar photosphere rotates in the same sense as the circumstellar disk, the DP signature induced by an absorption line would cause a photocenter offset in the opposite direction from a circumstellar emission line, which could qualitatively explain the observed phase effect. However, when modeling the expected DP signature using a stellar atmosphere code for fast rotating stars[20, 21], we find that these corresponding signatures () are by far too small to explain the measured phase signals of .
In a second attempt, we considered whether the observed phase inversion might be explained with the phase jump appearing at the transition between different lobes of the visibility function. In this scenario, a standard Keplerian disk model might already be sufficient to explain the phase jumps, since the spatially most extended structure would appear at the lowest gas velocities, i.e. in the line center. Accordingly, the spectral channels in the line wings (corresponding to high gas velocities) would measure visibilities in the first lobe of the visibility function, while the channels in the line center (corresponding to low gas velocities) would trace the second lobe. This scenario is supported by the fact that the spectral channels, where the DP phase jumps occur, also exhibit minima in the measured wavelength-differential visiblity, tracing the transition from the first to the second lobe.
In order to check these qualitative arguments, we adopted our kinematical modeling code[22, 5, 7] to simulate the gas velocity field of rotating disks with arbitrary rotation profile , where corresponds to Keplerian rotation. Our modeling approach assumes that the line emission is located in a geometrically thin disk that extends from the star to an outer radius . The code computes synthetic channel maps at spectral resolution , which we convolve to the spectral resolution of AMBER. From these convolved images we compute spectra, visibilities, DPs, and CPs for comparison with our data. Besides the line emission, our model includes the continuum emission from the circumstellar disk and the photospheric emission of a star rotating at near-critical velocity. Applying this continuum+line model to CMi we find that a Keplerian-rotating disk indeed reproduces the observed phase inversion also quantitatively. Varying both the geometric parameters and the disk rotation profile, we find that we can obtain an excellent fit to all observables assuming , with a mass of the central object of M (Fig. 1B). We conclude that the disk around CMi exhibits, to high precision, a Keplerian rotation profile, which supports viscous decretion disk models, where the Keplerian-rotating disk is replenished with material from the near-critical rotating star. On the other hand, our data is inconsistent with wind compression models predicting a strong outflowing velocity component.
2.4 MULTI-LINE-TRANSITION INTERFEROMETRY: PHYSICAL CONSTRAINTS
Obtaining spatially resolved information in multiple transitions of a line series, such as the Balmer, Brackett, and Pfund series of hydrogen, opens fascinating new opportunities to determine physical parameters, such as the excitation and ionization structure of the line-emitting gas.
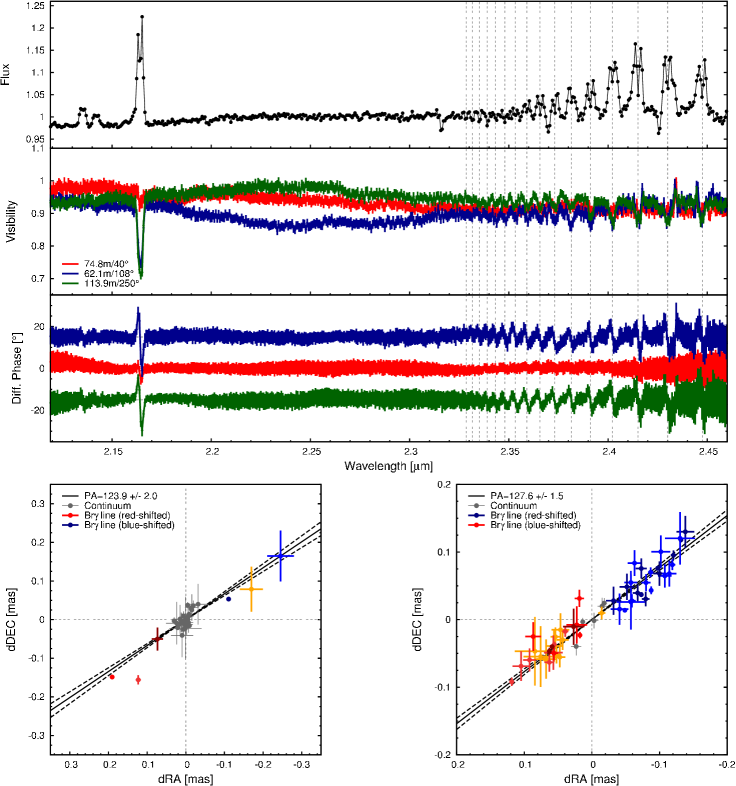
We applied this approach to the classical Be star Tau, which has already been extensively studied with spectro-interferometry in the H[23, 24, 25, 26] and Br[16, 27] recombination line. Our new observations[5] were conducted using the VLTI/AMBER MR-K2.3 mode () and cover now, for the first time, the Pfund emission lines associated with this object. In the data, we detect at least nine line transitions from the Pfund line (Pf14 2.4477 m to Pf22 2.3591 m) as well as the Br 2.166 m line. Higher Pfund transitions are also present in the spectrum, but cannot be clearly separated due to the broad, double-peaked profile of the individual lines. Each double-peaked line clearly shows an S-shaped DP signature, allowing us to derive the disk rotation axis for each line transition separately, enabling tighter constraints on the disk position angle (Fig. 3, bottom right) than from Br alone (Fig. 3, bottom left).
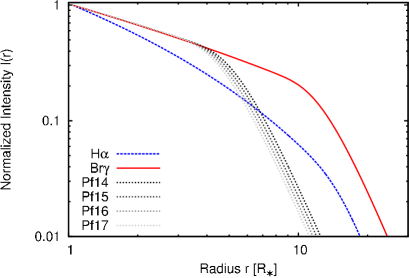
In order to constrain the disk ionization structure, we derive the spectro-interferometric emission radius for each line transition from the continuum-corrected photocenter displacement vectors and then compare them with the intensity profile derived from our LTE radiative transfer model[5]. For this modeling, we also include spectro-interferometric measurements in the H-line[23, 24, 25, 26], which reveals that the H and Br-lines trace similar stellocentric emission radii, while the Pfund emission originates closer to the stars (Fig. 4, left). This trend is reproduced by our LTE model (Fig. 4, right). Our results confirm the finding from Pott et al.[28], which found a similar trend for the classical Be star 48 Lib, and suggested that the measured size differences can be explained with optical depth differences between these line transitions.

Future studies might extend this approach to additional line transitions and line tracers in other wavelength bands. Together with sophisticated radiative transfer simulations, such observations might reveal the excitation structure of the disk and constrain parameters such as the temperature profile and the vertical disk structure, which are difficult to access with other techniques.
3 COMBINED SPECTRO-INTERFEROMETRY AND SPECTRO-ASTROMETRY
Spectro-interferometry can provide a full characterization of the sub-AU gas distribution and kinematics, but is also rather demanding in telescope time and poses strict technical requirements, for instance on the performance of the phase tracker. As a result, most current spectro-interferometric studies still suffer from a poor -coverage or compromise on the spectral dispersion. In order to optimize the scientific constraints under these conditions, it seems promising to combine spectro-interferometry with spectro-astrometry, which is another technique that provides kinematical information about the gas distribution on AU scales. Spectro-astrometry uses high-SNR long-slit spectra to measure the centroid position of an unresolved object as function of wavelength. Since the centroid position can be measured with much higher precision than the size of the point-spread function[29], this method allows one to measure photocenter displacements of less than one milliarcsecond in spectrally resolved emission lines.
In a recent study on the B[e] star V921 Sco[6, 7], we combined the two techniques, for the first time, in a consistent way for quantitative modeling, making use of the fact that the photocenter offsets measured with spectro-astrometry are mathematically equivalent to the wavelength-differential phases (DPs) measured in spectro-interferometry.
Our VLTI/AMBER data set on V921 Sco consists of two observations with high spectral dispersion (, telescope triplet UT2-UT3-UT4) and 24 AMBER observations with low spectral dispersion () in the - and -band. The low spectral dispersion data covers projected baseline lengths in the range 10…127 m with a good -coverage, which allows us to reconstruct aperture synthesis images for three wavelengths bands (centered around 1.6/2.0/2.3 m) using the Building Block Mapping[30] image reconstruction algorithm.
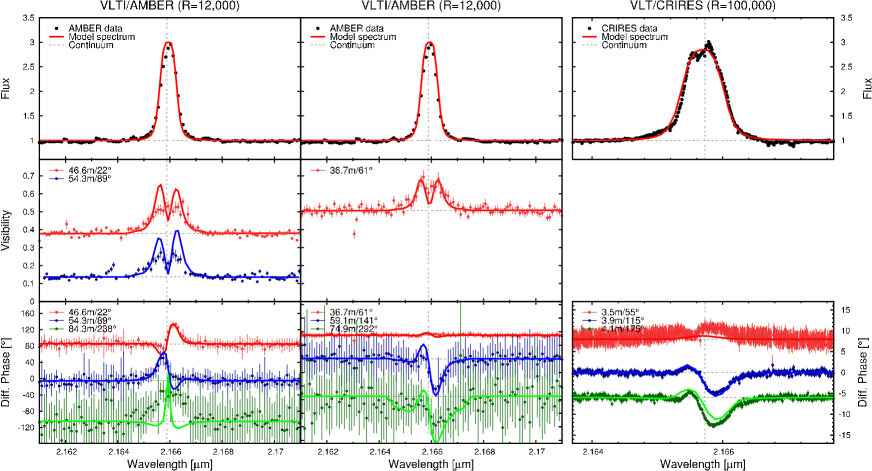
Complementary spectro-astrometric observations were obtained with the AO-fed high-resolution infrared spectrograph CRIRES[31] at VLT. With a slit width of 0.2′′, these observations yield a spectral resolution . The spectra were recorded toward three different PAs (, , ) and the corresponding anti-parallel PAs (, , ). In the data reduction process, the spectro-astrometric signal derived from the parallel and anti-parallel slit positions are subtracted in order to reduce potential artifacts[32] and the spectro-astrometric signal is corrected for continuum contributions[33]. We then translate the measured spectro-astrometric signal into the equivalent DP, which allows us to model the AMBER observables (line profile, visibility, DP) and CRIRES observables (line profile, DP) simultaneously using our kinematical modeling code. Given its higher spectral resolution, the CRIRES data also reveals a double-peak in the line profile (Fig. 5, right, top panel; peak separation m or km s−1) that was not detected in the AMBER data.
Besides the spectro-interferometric and spectro-astrometric data, we obtained additional complementary data for V921 Sco using the Magellan/FIRE spectrograph and the Magellan/IMACS wide-field imager. These various interferometric and non-interferometric constraints enable us to draw now a very comprehensive, global picture of the V921 Sco system, covering spatial scales from 300′′ to 0.001′′ with a velocity resolution of up to 3 km s-1. The wide-field images show that V921 Sco is embedded in a bipolar nebula (Fig. 6A), in which we detect multi-layered, shell-like substructures (Fig. 6B+C) that might have been shaped by episodic mass-loss events. Assuming the expansion speed derived from optical line profiles, we estimate the time scale between different mass loss events to years. Our VLTI/AMBER continuum aperture synthesis imaging reveals an AU-scale disk-like structure that is oriented perpendicular to the polar-axis of the arcminute-scale bipolar nebula (Fig. 6C+D). Fitting analytic disk models, we find indications for a radial temperature gradient and a central opacity depression, as expected for an irradiated dust disk. Furthermore, we discover in the images a close companion at a separation of mas (corresponding to AU at 1.15 kpc). Between two epochs in 2008 and 2009, we detect orbital motion of , implying an orbital period of years (assuming a circular orbit). Given the good agreement in the time scales, we suggest that dynamical interaction between the newly discovered companion and the circumprimary disk might trigger the mass-loss events that shape the shell-like substructure in the ambient bipolar nebula. This outflowing material might also provide the required low-density conditions for the formation of the B[e]-characteristic forbidden line emission.
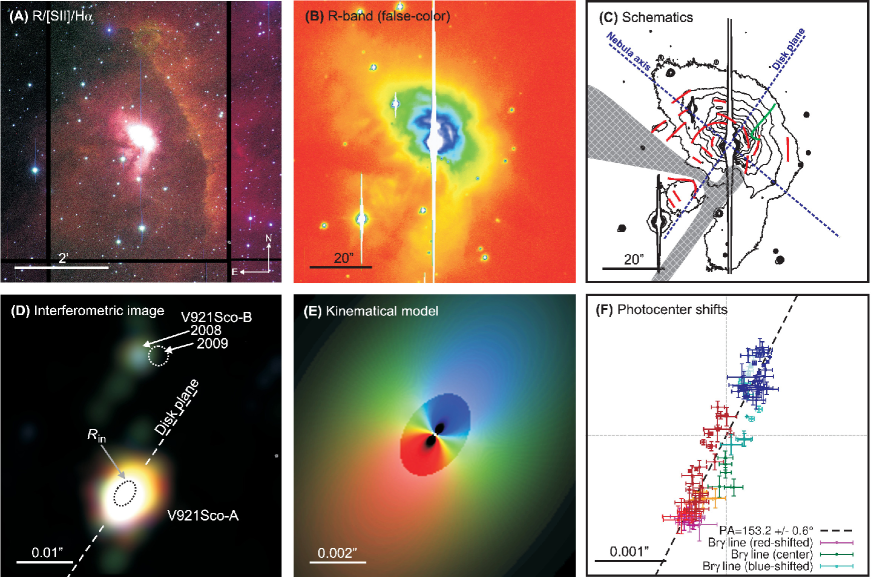
The high spectral dispersion VLTI/AMBER spectro-interferometric and VLT/CRIRES spectro-astrometric observations allow us to measure the distribution and kinematics of the hot hydrogen gas in the system. From the derived photocenter shifts we derive the orientation of the disk rotation plane and the spatial displacement between the blue- and red-shifted Br line wings (Fig. 6F). The center of light for the line spectral channels and for the continuum channels are significantly displaced with respect to each other (Fig. 7A). This offset reflects the presence of the companion star, which shifts the center of light in the continuum emission towards the secondary (North-West). We compare the derived rotation plane of the gas disk () with the orientation of the continuum-emitting disk (). The good agreement between the PAs indicates a rotation-dominated velocity field.
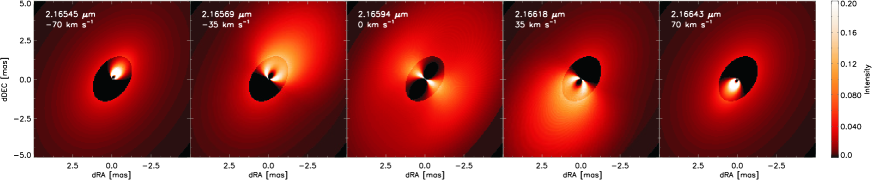
Using our kinematical modeling code, we quantify the rotation profile and find that the line-emitting gas is, to high accuracy, in Keplerian rotation. The model is able to reproduce the spectro-interferometric and spectro-astrometric data as well as the measured double-peaked CRIRES line profile (Fig. 5, top) and shows that the line-emitting region extends from a few stellar radii to about twice the dust sublimation radius. The channel maps corresponding to the best-fit model are shown in Fig. 5 (bottom). Our measurement of the gas velocity field also provides important new information about the evolutionary age of V921 Sco, where earlier studies have proposed either a young (Herbig B[e]) or an evolved (supergiant B[e]) nature. We interpret our finding of a purely Keplerian velocity field as strong evidence for the pre-main-sequence nature of the object, since the decretion disks in post-main-sequence B[e]-stars are believed to exhibit a significant outflowing velocity component.
Furthermore, our new information about the spatial distribution of the line-emitting material opens interesting new pathways for the physical interpretation of conventional spectroscopic observations, which we conducted with the Magellan/FIRE spectrograph. We obtained ++-band spectra and derived the line flux for 61 hydrogen recombination lines, including transitions from the Paschen, Brackett, and Pfund series. Given that the recombination physics of hydrogen is well known, one can use these line decrements in order to derive physical parameters such as the electron density , although conventional spectroscopic studies are typically not able to utilize this information since they lack information about the volume over which the line-emitting material is distributed. From our AMBER observations we estimate the volume of the Br-emitting material and then solve for the electron density (m−3) assuming Case B recombination.
To summarize, in our V921 Sco study AMBER spectro-interferometry and CRIRES spectro-astrometry provide highly complementary information: Spectro-interferometry enables us to characterize the continuum geometry, including a characterisation of the dust disk geometry and the companion properties, and to spatially resolve the detailed geometry and kinematics of the circumstellar gas with spectral dispersion . Spectro-astrometry, on the other hand, adds valuable information at even higher spectral dispersion (), enabling a detection of the double-peak line profile, and adds first-order kinematical constraints in the spatially unresolved regime.
3.1 VLTI/AMBER PHASE SIGN CALIBRATION PROCEDURE
In order to achieve a meaningful astrophysical interpretation of the measured DP and CP information, it is essential to associate the phase sign with the on-sky orientation. In principle, such a phase sign calibration can be derived from first principles, based on very careful considerations of the beam arrangement and propagation, the instrument design, and the phase sign treatment in the data reduction and modeling software.
Our V921 Sco data[6, 7] now allows us to perform this calibration for VLTI/AMBER using a purely empirical approach. This data set is particularly well suited for this purpose, given that the object consists of a well-characterized close binary system with an unequal brightness ratio, where only one of the components is associated with Br-line emission. The presence of the companion offsets the photocenter between the continuum and the line channels in a predictable way, from which we can deduce the correct DP sign.
Specifically, we performed these steps: First, we imaged the system using our - and -band AMBER measurements with low spectral dispersion (Fig. 7B), which reveals that the companion is located North-West of the primary star. This measurement does not suffer from any quadrant ambiguity, given our earlier closure phase calibration[34] using the binary system Orionis C. From our AMBER high spectral dispersion measurements, we determined the photocenter offset and calibrated the DP sign based on the known quadrant of the companion star (Fig. 7A).

Using this new calibration, we determined the rotation senses of the V921 Sco circumprimary disk[7] (Fig. 7, left) and of the CMi[5] disk (Fig. 1). Besides our high spectral dispersion observations () on CMi, we observed CMi also in medium spectral dispersion (), which allows us to extend our calibration also to AMBER’s MR-mode, and apply it to our Tau data set[5] (Fig. 3), where we find the opposite disk rotation sense as proposed by other workers[16].
The proposed approach can be applied to calibrate any AMBER data reduction+modeling code in a straight-forward manner and I provide the data set for other AMBER users on the following website: http://www.stefan-kraus.com/files/amber.htm
4 SCIENCE-DRIVEN REQUIREMENTS FOR FUTURE INSTRUMENTATION
Spectro-interferometric beam combiner instruments with high spectral dispersion (up to at near-infrared wavelengths and at visual wavelengths) are in place since several years, but could not yet exploit their full scientific potential. Primarily, this is a result from the lack of phase tracking instruments with sufficient sensitivity, preventing the study of particularly interesting object classes, such as jet-driving T Tauri stars or Active Galactic Nuclei. Therefore, throughput-optimized second-generation fringe tracking instruments are urgently needed. Promising strategies to optimize the fringe tracking performance have already been proposed, including off-axis tracking on a bright reference star (e.g. VLTI/PRIMA) or fringe tracking and fringe recording in separate wavelength bands (e.g. VLTI/MATISSE for the ++-band and CHARA/VEGA -band interferometry with MIRC -band or CLIMB -band fringe tracking).
In Sect. 2.1, I have outlined another severe problem that arises from the fact that the visibility amplitudes in spectro-interferometric observations are typically degraded by residual phase jitter from the fringe tracker, preventing the measurement of well-calibrated visibility amplitudes. Future instrumentation projects should aim to eliminate this problem, for instance by implementing a fast-switching mode between low and high spectral dispersion.
Other desirable improvements would include an increased number of combined apertures and longer baseline lengths, which would enable a more effective sampling of the -coverage and ultimately interferometric imaging in spectral lines. First attempts in this direction have been presented for the interacting binary Lyrae[35] and the supergiant B[e]-star HD 62623[36]. These studies used a self-calibration approach to recover the phase information from NPOI and VLTI/AMBER data. It is clear that much improvements in this field can be expected in the future, both by enabling an improved uv-coverage, but also from algorithmic work with dedicated spectro-interferometric image reconstruction algorithms that could make full use of the rich available DP information.
5 CONCLUSIONS
In this paper, I have outlined some of the unique capabilities of spectro-interferometric instruments and discussed strategies for the interpretation of such data, ranging from a photocenter and position-velocity analysis approach to full kinematical modeling. Particularly powerful constraints can be derived from spectro-interferometric observations in multiple line transitions, for instance in the hydrogen Balmer, Brackett, or Pfund series, providing constraints on the ionization structure and electron density of the line-emitting material.
Furthermore, I have emphasized the complementary nature of spectro-interferometry and spectro-astrometry. Spectro-astrometry provides a resource-efficient method to measure first-order kinematical information with very high spectral dispersion in the spatially unresolved regime. Spectro-interferometry offers an even higher differential astrometric accuracy (approaching the micro-arcsecond level) and provides the ultimate technique to constrain the underlying geometry of the line-emitting region through visibility amplitudes, a task that cannot be achieved with any other technique in a model-independent fashion.
Acknowledgements.
This work was performed in part under contract with the California Institute of Technology (Caltech) funded by NASA through the Sagan Fellowship Program.References
- [1] Petrov, R. G., Malbet, F., Weigelt, G., Antonelli, P., Beckmann, U., Bresson, Y., Chelli, A., Dugué, M., Duvert, G., Gennari, S., Glück, L., Kern, P., Lagarde, S., Le Coarer, E., Lisi, F., Millour, F., Perraut, K., Puget, P., Rantakyrö, F., Robbe-Dubois, S., Roussel, A., Salinari, P., Tatulli, E., Zins, G., Accardo, M., Acke, B., Agabi, K., Altariba, E., Arezki, B., Aristidi, E., Baffa, C., Behrend, J., Blöcker, T., Bonhomme, S., Busoni, S., Cassaing, F., Clausse, J.-M., Colin, J., Connot, C., Delboulbé, A., Domiciano de Souza, A., Driebe, T., Feautrier, P., Ferruzzi, D., Forveille, T., Fossat, E., Foy, R., Fraix-Burnet, D., Gallardo, A., Giani, E., Gil, C., Glentzlin, A., Heiden, M., Heininger, M., Hernandez Utrera, O., Hofmann, K.-H., Kamm, D., Kiekebusch, M., Kraus, S., Le Contel, D., Le Contel, J.-M., Lesourd, T., Lopez, B., Lopez, M., Magnard, Y., Marconi, A., Mars, G., Martinot-Lagarde, G., Mathias, P., Mège, P., Monin, J.-L., Mouillet, D., Mourard, D., Nussbaum, E., Ohnaka, K., Pacheco, J., Perrier, C., Rabbia, Y., Rebattu, S., Reynaud, F., Richichi, A., Robini, A., Sacchettini, M., Schertl, D., Schöller, M., Solscheid, W., Spang, A., Stee, P., Stefanini, P., Tallon, M., Tallon-Bosc, I., Tasso, D., Testi, L., Vakili, F., von der Lühe, O., Valtier, J.-C., Vannier, M., and Ventura, N., “AMBER, the near-infrared spectro-interferometric three-telescope VLTI instrument,” A&A 464, 1–12 (Mar. 2007).
- [2] Woillez, J., Akeson, R., Colavita, M., Eisner, J., Ghez, A., Graham, J., Hillenbrand, L., Millan-Gabet, R., Monnier, J., Pott, J.-U., Ragland, S., Wizinowich, P., Appleby, E., Berkey, B., Cooper, A., Felizardo, C., Herstein, J., Hrynevych, M., Martin, O., Medeiros, D., Morrison, D., Panteleeva, T., Smith, B., Summers, K., Tsubota, K., Tyau, C., and Wetherell, E., “ASTRA: astrometry and phase-referencing astronomy on the Keck interferometer,” in [Society of Photo-Optical Instrumentation Engineers (SPIE) Conference Series ], Society of Photo-Optical Instrumentation Engineers (SPIE) Conference Series 7734 (July 2010).
- [3] Monnier, J. D., Fitelson, W., Danchi, W. C., and Townes, C. H., “Mid-Infrared Interferometry on Spectral Lines. I. Instrumentation,” ApJS 129, 421–429 (July 2000).
- [4] Mourard, D., Perraut, K., Bonneau, D., Clausse, J. M., Stee, P., Tallon-Bosc, I., Kervella, P., Hughes, Y., Marcotto, A., Blazit, A., Chesneau, O., Domiciano de Souza, A., Foy, R., Hénault, F., Mattei, D., Merlin, G., Roussel, A., Tallon, M., Thiebaut, E., McAlister, H., ten Brummelaar, T., Sturmann, J., Sturmann, L., Turner, N., Farrington, C., and Goldfinger, P. J., “VEGA: a new visible spectrograph and polarimeter on the CHARA Array,” in [Society of Photo-Optical Instrumentation Engineers (SPIE) Conference Series ], Society of Photo-Optical Instrumentation Engineers (SPIE) Conference Series 7013 (July 2008).
- [5] Kraus, S., Monnier, J. D., Che, X., Schaefer, G., Touhami, Y., Gies, D. R., Aufdenberg, J. P., Baron, F., Thureau, N., ten Brummelaar, T. A., McAlister, H. A., Turner, N. H., Sturmann, J., and Sturmann, L., “Gas Distribution, Kinematics, and Excitation Structure in the Disks around the Classical Be Stars Canis Minoris and Tauri,” ApJ 744, 19 (Jan. 2012).
- [6] Kraus, S., Calvet, N., Hartmann, L., Hofmann, K.-H., Kreplin, A., Monnier, J. D., and Weigelt, G., “On the Nature of the Herbig B[e] Star Binary System V921 Scorpii: Discovery of a Close Companion and Relation to the Large-scale Bipolar Nebula,” ApJ 746, L2 (Feb. 2012).
- [7] Kraus, S., Calvet, N., Hartmann, L., Hofmann, K.-H., Kreplin, A., Monnier, J. D., and Weigelt, G., “On the Nature of the Herbig B[e] Star Binary System V921 Scorpii: Geometry and Kinematics of the Circumprimary Disk on Sub-AU Scales,” ApJ 752, 11 (June 2012).
- [8] Gai, M., Menardi, S., Cesare, S., Bauvir, B., Bonino, D., Corcione, L., Dimmler, M., Massone, G., Reynaud, F., and Wallander, A., “The VLTI fringe sensors: FINITO and PRIMA FSU,” in [Society of Photo-Optical Instrumentation Engineers (SPIE) Conference Series ], W. A. Traub, ed., Presented at the Society of Photo-Optical Instrumentation Engineers (SPIE) Conference 5491, 528–+ (Oct. 2004).
- [9] Le Bouquin, J., Bauvir, B., Haguenauer, P., Schöller, M., Rantakyrö, F., and Menardi, S., “First result with AMBER+FINITO on the VLTI: the high-precision angular diameter of V3879 Sagittarii,” A&A 481, 553–557 (Apr. 2008).
- [10] Petrov, R., Roddier, F., and Aime, C., “Signal-to-noise ratio in differential speckle interferometry,” Journal of the Optical Society of America A 3, 634–644 (May 1986).
- [11] Petrov, R. G., “Differential speckle imaging.,” in [European Southern Observatory Conference and Workshop Proceedings ], Merkle, F., ed., European Southern Observatory Conference and Workshop Proceedings 29, 235–248 (1988).
- [12] Beckers, J. M., “Differential speckle interferometry.,” Optica Acta 29, 361–362 (Apr. 1982).
- [13] Le Bouquin, J., Absil, O., Benisty, M., Massi, F., Mérand, A., and Stefl, S., “The spin-orbit alignment of the Fomalhaut planetary system probed by optical long baseline interferometry,” A&A 498, L41–L44 (May 2009).
- [14] Petrov, R. G., “Differential Interferometry,” in [NATO ASIC Proc. 274: Diffraction-Limited Imaging with Very Large Telescopes ], Alloin, D. M. and Mariotti, J.-M., eds., 249 (1989).
- [15] Lachaume, R., “On marginally resolved objects in optical interferometry,” A&A 400, 795–803 (Mar. 2003).
- [16] Štefl, S., Rivinius, T., Carciofi, A. C., Le Bouquin, J., Baade, D., Bjorkman, K. S., Hesselbach, E., Hummel, C. A., Okazaki, A. T., Pollmann, E., Rantakyrö, F., and Wisniewski, J. P., “Cyclic variability of the circumstellar disk of the Be star Tauri. I. Long-term monitoring observations,” A&A 504, 929–944 (Sept. 2009).
- [17] Miyoshi, M., Moran, J., Herrnstein, J., Greenhill, L., Nakai, N., Diamond, P., and Inoue, M., “Evidence for a black hole from high rotation velocities in a sub-parsec region of NGC4258,” Nature 373, 127–129 (Jan. 1995).
- [18] Meilland, A., Stee, P., Vannier, M., Millour, F., Domiciano de Souza, A., Malbet, F., Martayan, C., Paresce, F., Petrov, R. G., Richichi, A., and Spang, A., “First direct detection of a Keplerian rotating disk around the Be star Arae using AMBER/VLTI,” A&A 464, 59–71 (Mar. 2007).
- [19] Stefl, S., Rivinius, T., Baade, D., and Carciofi, A., “AMBER high-spectral resolution interferometry of Be stars: More than just stars and disks?,” ArXiv e-prints (July 2011).
- [20] Monnier, J. D., Zhao, M., Pedretti, E., Thureau, N., Ireland, M., Muirhead, P., Berger, J.-P., Millan-Gabet, R., Van Belle, G., ten Brummelaar, T., McAlister, H., Ridgway, S., Turner, N., Sturmann, L., Sturmann, J., and Berger, D., “Imaging the Surface of Altair,” Science 317, 342– (July 2007).
- [21] Che, X., Monnier, J. D., Zhao, M., Pedretti, E., Thureau, N., Mérand, A., ten Brummelaar, T., McAlister, H., Ridgway, S. T., Turner, N., Sturmann, J., and Sturmann, L., “Colder and Hotter: Interferometric Imaging of Cassiopeiae and Leonis,” ApJ 732, 68–+ (May 2011).
- [22] Weigelt, G., Kraus, S., Driebe, T., Petrov, R. G., Hofmann, K.-H., Millour, F., Chesneau, O., Schertl, D., Malbet, F., Hillier, J. D., Gull, T., Davidson, K., Domiciano de Souza, A., Antonelli, P., Beckmann, U., Bresson, Y., Chelli, A., Dugué, M., Duvert, G., Gennari, S., Glück, L., Kern, P., Lagarde, S., Le Coarer, E., Lisi, F., Perraut, K., Puget, P., Rantakyrö, F., Robbe-Dubois, S., Roussel, A., Tatulli, E., Zins, G., Accardo, M., Acke, B., Agabi, K., Altariba, E., Arezki, B., Aristidi, E., Baffa, C., Behrend, J., Blöcker, T., Bonhomme, S., Busoni, S., Cassaing, F., Clausse, J.-M., Colin, J., Connot, C., Delboulbé, A., Feautrier, P., Ferruzzi, D., Forveille, T., Fossat, E., Foy, R., Fraix-Burnet, D., Gallardo, A., Giani, E., Gil, C., Glentzlin, A., Heiden, M., Heininger, M., Hernandez Utrera, O., Kamm, D., Kiekebusch, M., Le Contel, D., Le Contel, J.-M., Lesourd, T., Lopez, B., Lopez, M., Magnard, Y., Marconi, A., Mars, G., Martinot-Lagarde, G., Mathias, P., Mège, P., Monin, J.-L., Mouillet, D., Mourard, D., Nussbaum, E., Ohnaka, K., Pacheco, J., Perrier, C., Rabbia, Y., Rebattu, S., Reynaud, F., Richichi, A., Robini, A., Sacchettini, M., Schöller, M., Solscheid, W., Spang, A., Stee, P., Stefanini, P., Tallon, M., Tallon-Bosc, I., Tasso, D., Testi, L., Vakili, F., von der Lühe, O., Valtier, J.-C., Vannier, M., Ventura, N., Weis, K., and Wittkowski, M., “Near-infrared interferometry of ¡ASTROBJ¿ Carinae¡/ASTROBJ¿ with spectral resolutions of 1 500 and 12 000 using AMBER/VLTI,” A&A 464, 87–106 (Mar. 2007).
- [23] Quirrenbach, A., Buscher, D. F., Mozurkewich, D., Hummel, C. A., and Armstrong, J. T., “Maximum-entropy maps of the Be shell star zeta Tauri from optical long-baseline interferometry,” A&A 283, L13–L16 (Mar. 1994).
- [24] Quirrenbach, A., Bjorkman, K. S., Bjorkman, J. E., Hummel, C. A., Buscher, D. F., Armstrong, J. T., Mozurkewich, D., Elias, II, N. M., and Babler, B. L., “Constraints on the Geometry of Circumstellar Envelopes: Optical Interferometric and Spectropolarimetric Observations of Seven Be Stars,” ApJ 479, 477–+ (Apr. 1997).
- [25] Vakili, F., Mourard, D., Stee, P., Bonneau, D., Berio, P., Chesneau, O., Thureau, N., Morand, F., Labeyrie, A., and Tallon-Bosc, I., “Evidence for one-armed oscillations in the equatorial disk of zeta Tauri from GI2T spectrally resolved interferometry,” A&A 335, 261–265 (July 1998).
- [26] Tycner, C., Hajian, A. R., Armstrong, J. T., Benson, J. A., Gilbreath, G. C., Hutter, D. J., Lester, J. B., Mozurkewich, D., and Pauls, T. A., “The Circumstellar Envelope of Tauri through Optical Interferometry,” AJ 127, 1194–1203 (Feb. 2004).
- [27] Carciofi, A. C., Okazaki, A. T., Le Bouquin, J., Štefl, S., Rivinius, T., Baade, D., Bjorkman, J. E., and Hummel, C. A., “Cyclic variability of the circumstellar disk of the Be star Tauri. II. Testing the 2D global disk oscillation model,” A&A 504, 915–927 (Sept. 2009).
- [28] Pott, J.-U., Woillez, J., Ragland, S., Wizinowich, P. L., Eisner, J. A., Monnier, J. D., Akeson, R. L., Ghez, A. M., Graham, J. R., Hillenbrand, L. A., Millan-Gabet, R., Appleby, E., Berkey, B., Colavita, M. M., Cooper, A., Felizardo, C., Herstein, J., Hrynevych, M., Medeiros, D., Morrison, D., Panteleeva, T., Smith, B., Summers, K., Tsubota, K., Tyau, C., and Wetherell, E., “Probing Local Density Inhomogeneities in the Circumstellar Disk of a Be Star Using the New Spectro-astrometry Mode at the Keck Interferometer,” ApJ 721, 802–808 (Sept. 2010).
- [29] Bailey, J. A., “Spectroastrometry: a new approach to astronomy on small spatial scales,” in [Society of Photo-Optical Instrumentation Engineers (SPIE) Conference Series ], S. D’Odorico, ed., Presented at the Society of Photo-Optical Instrumentation Engineers (SPIE) Conference 3355, 932–939 (July 1998).
- [30] Hofmann, K.-H. and Weigelt, G., “Iterative image reconstruction from the bispectrum,” A&A 278, 328–339 (Oct. 1993).
- [31] Kaeufl, H., Ballester, P., Biereichel, P., Delabre, B., Donaldson, R., Dorn, R., Fedrigo, E., Finger, G., Fischer, G., Franza, F., Gojak, D., Huster, G., Jung, Y., Lizon, J., Mehrgan, L., Meyer, M., Moorwood, A., Pirard, J., Paufique, J., Pozna, E., Siebenmorgen, R., Silber, A., Stegmeier, J., and Wegerer, S., “CRIRES: a high-resolution infrared spectrograph for ESO’s VLT,” in [Society of Photo-Optical Instrumentation Engineers (SPIE) Conference Series ], A. F. M. Moorwood & M. Iye, ed., Society of Photo-Optical Instrumentation Engineers (SPIE) Conference Series 5492, 1218–1227 (Sept. 2004).
- [32] Brannigan, E., Takami, M., Chrysostomou, A., and Bailey, J., “On the detection of artefacts in spectro-astrometry,” MNRAS 367, 315–322 (Mar. 2006).
- [33] Pontoppidan, K. M., Blake, G. A., van Dishoeck, E. F., Smette, A., Ireland, M. J., and Brown, J., “Spectroastrometric Imaging of Molecular Gas within Protoplanetary Disk Gaps,” ApJ 684, 1323–1329 (Sept. 2008).
- [34] Kraus, S., Weigelt, G., Balega, Y. Y., Docobo, J. A., Hofmann, K.-H., Preibisch, T., Schertl, D., Tamazian, V. S., Driebe, T., Ohnaka, K., Petrov, R., Schöller, M., and Smith, M., “Tracing the young massive high-eccentricity binary system Orionis C through periastron passage,” A&A 497, 195–207 (Apr. 2009).
- [35] Schmitt, H. R., Pauls, T. A., Tycner, C., Armstrong, J. T., Zavala, R. T., Benson, J. A., Gilbreath, G. C., Hindsley, R. B., Hutter, D. J., Johnston, K. J., Jorgensen, A. M., and Mozurkewich, D., “Navy Prototype Optical Interferometer Imaging of Line Emission Regions of Lyrae Using Differential Phase Referencing,” ApJ 691, 984–996 (Feb. 2009).
- [36] Millour, F., Meilland, A., Chesneau, O., Stee, P., Kanaan, S., Petrov, R., Mourard, D., and Kraus, S., “Imaging the spinning gas and dust in the disc around the supergiant A[e] star HD 62623,” A&A 526, A107+ (Feb. 2011).