Further author information: (Send correspondence to S.K.)
E-mail: stefankr@umich.edu, Telephone: +1 734 615 7374
Control interface concepts for CHARA 6-telescope fringe tracking with CHAMP+MIRC
Abstract
Cophasing six telescopes from the CHARA array, the CHARA-Michigan Phasetracker (CHAMP) and Michigan Infrared Combiner (MIRC) are pushing the frontiers of infrared long-baseline interferometric imaging in key scientific areas such as star- and planet-formation. Here we review our concepts and recent improvements on the CHAMP and MIRC control interfaces, which establish the communication to the real-time data recording & fringe tracking code, provide essential performance diagnostics, and assist the observer in the alignment and flux optimization procedure. For fringe detection and tracking with MIRC, we have developed a novel matrix approach, which provides predictions for the fringe positions based on cross-fringe information.
keywords:
interferometry, infrared, fringe tracking, CHARA, MIRC, CHAMP, control interface1 INTRODUCTION
The Michigan InfraRed Combiner[1, 2] (MIRC) is a near-infrared science beam combiner at the CHARA array located on Mt. Wilson in California. Using a multiaxial optical layout, MIRC combines the light from all six beams simultaneously, enabling, for the first time, the instantaneous measurement of 15 visibility amplitudes and 20 closure phase triangles in the near-infrared H- and K-band.
In order to enable observations on fainter targets, the CHARA-Michigan Phasetracker[3, 4, 2] (CHAMP) uses a co-axial pair-wise combination scheme and was optimized for sensitivity by combining only neighbouring beams. Using “phase tracking” and “group-delay tracking” algorithms, CHAMP can stabilize the atmosphere-induced fringe motion and provide an enhanced fringe contrast for MIRC and other facility instruments. Together with the uniquely long baselines of the CHARA array (up to 331 m), MIRC and CHAMP are designed to enable quick-look infrared long-baseline interferometric imaging of key object classes, such as the protoplanetary disks around young stars.
In this contribution, we report on our latest developments related to the user control interface for these instruments. The graphical user interfaces (GUIs) were implemented in the Python programming language and evolved from our earlier CHARA observing planning and operational tools[5]. They enable an efficient alignment and flux-optimization (Sect. 1.1), establish the communication with the real-time code (Sect. 1.2), assist in the fringe search process using cross-fringe information (Sect. 1.3), and allow to initiate the fringe recording (Sect. 1.4).
1.1 CHAMP alignment
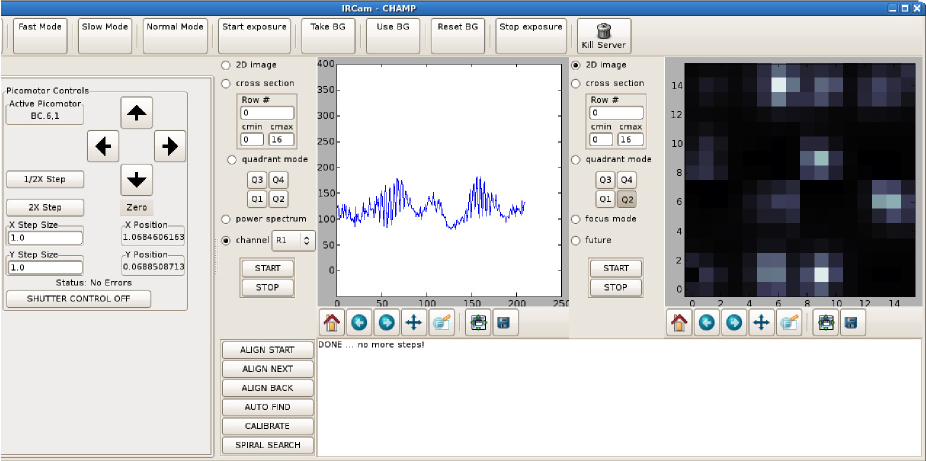
Preparing CHAMP for night-time operation requires a careful optimization of the alignment of all optical components. For this purpose, we have developed an alignment sequence that consists of 18 steps, where each step involves the selection of a particular telescope beam using shutters, followed by the alignment of the resulting light spot on a reference pixel on the detector. Besides the large number of alignment steps, the sequence has to be followed in a precisely defined order. During some steps, multiple spots are visible at the detector, making it difficult for the user to identify the correct spot. As a consequence, the procedure is rather time-consuming and impractical to perform in a manual fashion, in particular as the alignment procedure has also to be executed during night-time operation in order to optimize the flux-injection of faint targets.
Therefore, it was highly desirable to develop a dedicated alignment-GUI that automates as many steps as possible. The interface operates the shutters in order to select a particular beam, controls the piezo motors to adjust the involved mirrors & beam splitters, and displays the real-time detector image. Furthermore, the interface outputs written instructions to the user, and assists him/her in the identification of the spot on the detector, and shows the appropriate reference pixel onto which the spot has to be aligned.
Recently, we have added an auto-alignment feature, which measures the centroid position of the beam and computes the piezo motor steps that are required to move the spot onto the reference pixel. Following a user confirmation, the GUI automatically operates the actuators in order to perform the alignment. The procedure is repeated iteratively until convergence is reached. This automization considerably accelerates the process, yet still gives the user sufficient control to avoid problems in case a spot has drifted out of the small field-of-view.
1.2 CHAMP fringe tracking
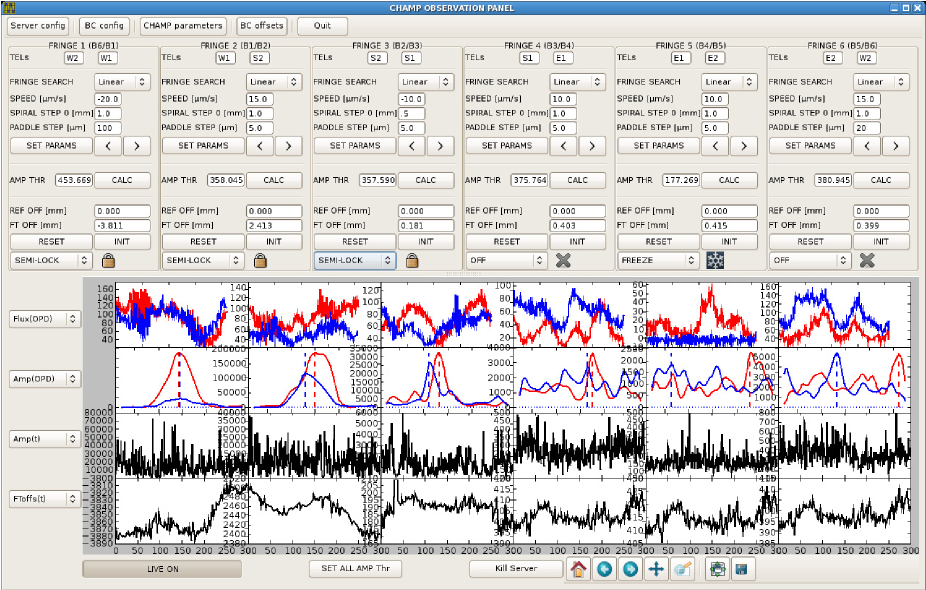
In order to enable an efficient operation of CHAMP, we have developed an interface that allows the user to communicate with the real-time code and to switch between different fringe search and fringe tracking states:
-
•
SEARCH: Starts a fringe search, using either a linear or spiral search pattern.
-
•
LOCK: Locks the fringe using a co-phasing algorithm.
-
•
SEMI-LOCK: Locks the fringe using a group-delay tracking algorithm.
-
•
FREEZE: Deactivates the fringe tracking, but ensures that the delay line position is maintained.
-
•
OFF: Deactivates the fringe tracking, without enforcing the current delay position. Delay lines in this state will be used to accumulate delay offsets from other baselines.
Besides controlling the tracking state, the GUI provides the user with the possibility to move the delay lines manually and to set the detection threshold for each baseline. The interface also displays important diagnostic plots, such as the measured flux, the power spectrum fringe amplitude, and the fringe tracker offsets that are sent to the delay lines. Many parameters can be plotted as function of the optical path delay (OPD) within an individual scan (e.g. “Flux(OPD)” in Fig. 2), or as a gliding time history plot (e.g. “FToffs(t)” in Fig. 2). Given the large number of parameters that might be of interest for diagnostic purposes, we have implemented a dynamical plot allocation, where the user can select the four parameters that ought to be plotted. This concept allows us to operate CHAMP using a single graphical interface.
1.3 MIRC-6T fringe search & self-coherencing
With its pairwise combination scheme, CHAMP is optimized for sensitivity, but probes only six of the 15 possible baselines. This might result in problems for observations on strongly resolved sources, where baseline bootstrapping becomes essential. For sufficiently bright objects (), it is possible in such cases to operate MIRC in a self-coherencing mode, where the MIRC interferograms itself are used for fringe search and group-delay tracking.
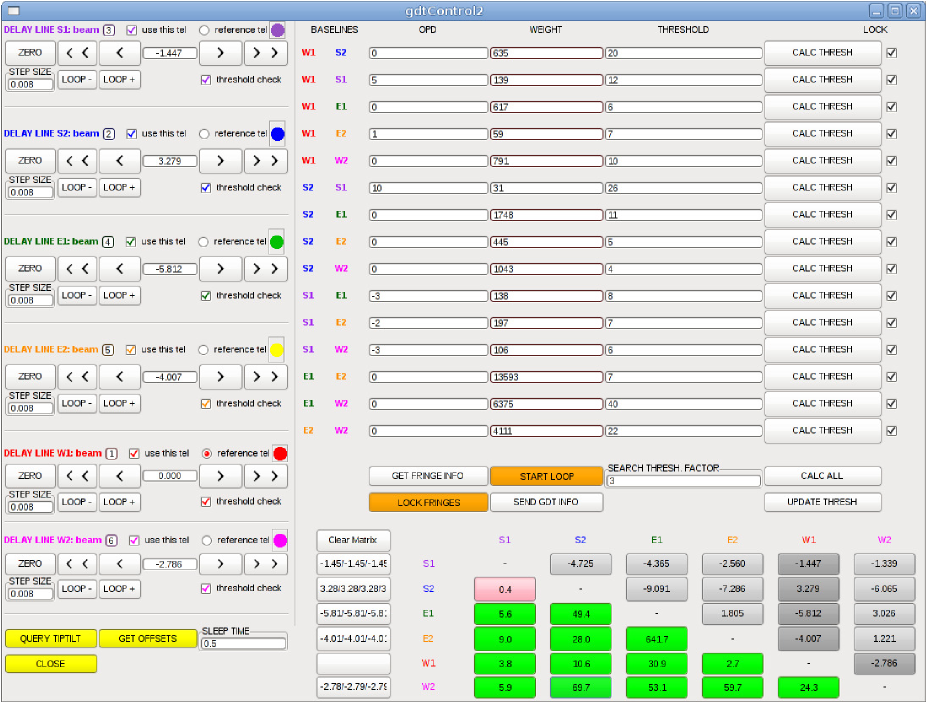
For this purpose, we have developed a dedicated GUI (Fig. 3) that allows the user to search and track fringes on all 15 baselines. For each baseline, the user can define a threshold value for fringe detection, or ask the software to provide an estimate that is computed from the background level in the power spectrum (buttons “CALC THRESH”). Based on these threshold values, the software computes for each baseline a signal-to-threshold ratio (STR), which is used both for fringe search and group-delay tracking.
The user can initiate the fringe search for the individual baselines using the “LOOP+” or “LOOP-” buttons. As soon as a fringe signal with sufficient STR is detected, the search loop opens and the user can lock the fringe, either by activating the check marks in the top-right quadrant, or using the matrix in the bottom-right quadrant of the control panel (Fig. 3). This matrix displays the fringe detection & tracking information in a graphical and intuitive way. The buttons in the bottom-left quadrant of the matrix output the fringe STR, where the color of the individual buttons indicates:
-
•
grey: Tracking loop open and no fringe found (STR1).
-
•
yellow: Tracking loop open, but fringe found (STR1).
-
•
green: Tracking loop closed and fringe found (STR1).
-
•
red: Tracking loop closed, but fringe lost (STR1).
In practice, this procedure is used as follows: The user initiates the fringe search process on five baselines by clicking the “LOOP+”/“LOOP-” buttons, while keeping the delay line for the sixth telescope (“reference telescope”) at a fixed zero position (e.g. W1 in the example shown in Fig. 3). Initially, all buttons in the matrix are colored grey. As soon as a fringe is detected on one of the 15 baselines, the corresponding button turns yellow and the search loop for this delay line opens. If convinced that the detection is real, the user clicks the corresponding button in the matrix in order to close the fringe tracking loop. The algorithm then tracks the fringe at this baseline, as indicated with a green color in the matrix. In case the fringe gets lost, the corresponding button turns red, informing the user about the problem.
Besides indicating the fringe STR & tracking state (in the bottom-left quadrant of the matrix), the matrix provides information about the delay line position at which the fringe has been detected. This information is output in the top-right quadrant of the matrix with labels giving the OPD difference between the involved delay lines at the time of the fringe detection. For the five baselines involving the reference telescope (S1-W1, S2-W1, E1-W1, E2-W1, and W1-W2 in Fig. 3; colored dark grey), these OPD differences correspond to the delay line positions at which the fringes have been found. Detecting these reference-baseline fringes is particularly useful, as they allow retrieving the absolute (and not only relative) delay position of the white-light fringe.
During the fringe search, one also frequently encounters cross-fringes that do not include the reference telescope (e.g. S1-S2, S1-E1, E2-W1, etc.). In order to make use of this relative OPD information, we implemented an algorithm that predicts the zero-OPD position for delay lines based on the measurement of (at least) one reference-baseline fringe, and the OPD difference of any detected cross-fringes. For instance, if the fringe on baseline S2-W1 has been detected by scanning on the delay line associated with telescope S2 (where W1 is the reference telescope) and the cross-fringe for S2-E1 has been detected, then it is possible to predict the fringe position for baseline E1-W1, and, thus, the correct position for the delay line involving telescope E1. Oftentimes there exist different cross-fringe combinations that enable such a prediction, all of which can be utilized. For instance, in the given example it is also possible to solve for the delay line involving telescope E1 using cross-fringe detections on the S2-W1 and E1-W1 baselines. Solving these equations requires very basic math (addition of the determined OPD differences), but is too complicated to be carried out by the observer in real-time. Therefore, we implemented an algorithm in the MIRC control interface that automates this process and solves for all cross-fringe combinations that lead to predictions of reference-baseline fringe positions. This process runs automatically in the background, and the predicted OPD positions are displayed to the left of the matrix. By clicking the corresponding button, the user can move the delay line automatically to the predicted zero-OPD position. As input for the computation, the algorithm uses the OPD differences displayed in the upper-right part of the matrix. The user can influence these input parameters, for instance by rejecting false fringe detections, which can be reset by clicking on the button with the wrong OPD difference values.
This concept accelerates the fringe search process considerably and becomes more and more effective, the larger the number of combined apertures.
1.4 MIRC-6T data recording
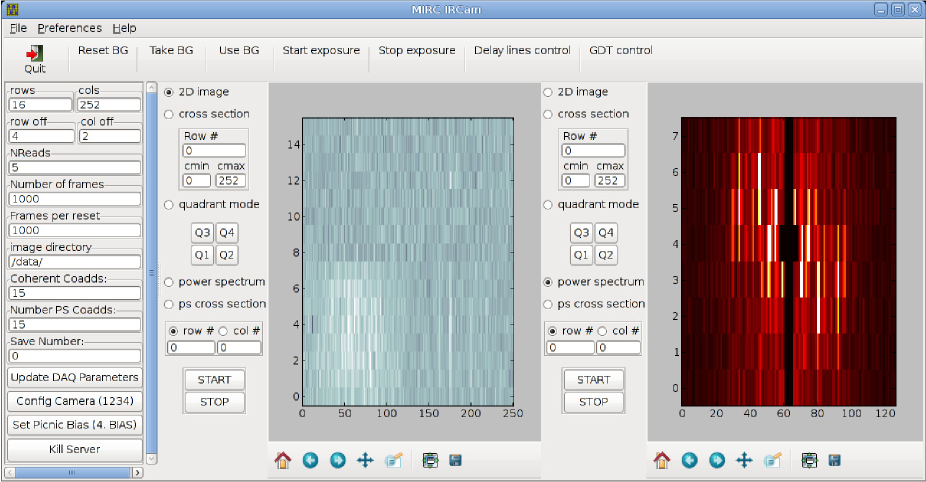
This GUI provides a real-time display of the detector image, either in image space or Fourier space (Fig. 4). The left corner of the interface allows the user to change the detector readout parameters and to start a data recording sequence by inputting the number of requested frames into the “Save Number” field.
2 CONCLUSIONS
Increasing the number of combined apertures is essential to improve the imaging capabilities in optical interferometry, but also poses new challenges on operational aspects. In this contribution, we have reviewed new control concepts that we have developed to enable efficient instrument alignment, fringe search, and fringe tracking with the six-telescope instruments MIRC and CHAMP. Some of the discussed solutions are linked to the specific instrument design, while others are applicable to optical interferometers in general. For instance, the presented matrix approach constitutes a straightforward method to utilize the cross-fringe information for fringe search & tracking and to display this information to the user. Developing and optimizing such strategies is essential in order to pave the way for even larger optical interferometric arrays in the future.
Acknowledgements.
We thank our colleagues from the CHARA array for support in the commissioning and operation of MIRC-6T and CHAMP. This work was performed in part under contract with the California Institute of Technology (Caltech) funded by NASA through the Sagan Fellowship Program.References
- [1] Monnier, J. D., Berger, J.-P., Millan-Gabet, R., and ten Brummelaar, T. A., “The Michigan Infrared Combiner (MIRC): IR imaging with the CHARA Array,” in [Society of Photo-Optical Instrumentation Engineers (SPIE) Conference Series ], Traub, W. A., ed., Society of Photo-Optical Instrumentation Engineers (SPIE) Conference Series 5491, 1370 (Oct. 2004).
- [2] Monnier, J. D., Anderson, M., Baron, F., Berger, D. H., Che, X., Eckhause, T., Kraus, S., Pedretti, E., Thureau, N., Millan-Gabet, R., Ten Brummelaar, T., Irwin, P., and Zhao, M., “MI-6: Michigan interferometry with six telescopes,” in [Society of Photo-Optical Instrumentation Engineers (SPIE) Conference Series ], Society of Photo-Optical Instrumentation Engineers (SPIE) Conference Series 7734 (July 2010).
- [3] Berger, D. H., Monnier, J. D., Millan-Gabet, R., ten Brummelaar, T. A., Muirhead, P., Pedretti, E., and Thureau, N., “CHARA Michigan phase-tracker (CHAMP): design and fabrication,” in [Society of Photo-Optical Instrumentation Engineers (SPIE) Conference Series ], Society of Photo-Optical Instrumentation Engineers (SPIE) Conference Series 6268 (July 2006).
- [4] Berger, D. H., Monnier, J. D., Millan-Gabet, R., ten Brummelaar, T. A., Anderson, M., Blum, J. L., Blasius, T., Pedretti, E., and Thureau, N., “CHARA Michigan phase-tracker (CHAMP): a preliminary performance report,” in [Society of Photo-Optical Instrumentation Engineers (SPIE) Conference Series ], Society of Photo-Optical Instrumentation Engineers (SPIE) Conference Series 7013 (July 2008).
- [5] Thureau, N. D., Ireland, M., Monnier, J. D., and Pedretti, E., “Software tools for optical interferometry,” in [Society of Photo-Optical Instrumentation Engineers (SPIE) Conference Series ], Society of Photo-Optical Instrumentation Engineers (SPIE) Conference Series 6268 (July 2006).