1\Yearpublication2014\Yearsubmission2013\Month1\Volume335\Issue1\DOIThis.is/not.aDOI
Combining optical spectroscopy and interferometry
Abstract
Modern optical spectrographs and optical interferometers push the limits in the spectral and spatial regime, providing important new tools for the exploration of the universe. In this contribution I outline the complementary nature of spectroscopic & interferometric observations and discuss different strategies for combining such data. Most remarkable, the latest generation of “spectro-interferometric” instruments combine the milliarcsecond angular resolution achievable with interferometry with spectral capabilities, enabling direct constraints on the distribution, density, kinematics, and ionization structure of the gas component in protoplanetary disks. I will present some selected studies from the field of star- & planet formation and hot star research in order to illustrate these fundamentally new observational opportunities.
keywords:
methods: observational, techniques: interferometric, spectroscopic, stars: emission-line, formation, kinematics1 Introduction
Since more than a century, spectroscopy is one of the most fundamental and universal tools in observational astronomy. With their ever-increasing sensitivity, spectral resolution, and calibration accuracy, the latest generation of optical spectrographs enables new applications, both in galactic and extragalactic astronomy. For instance, in the field of star- and planet formation, spectroscopic and spectrophotometric observations are indispensible to characterize the dust emission in protoplanetary disks (with low spectral resolution, but wide wavelength coverage), or to determine the accretion and mass-loss processes in these objects (with high spectral resolution observations in diagnostic lines).
For many applications, the main challenge in the interpretation of spectral line observations is the lack of information about the spatial distribution of the line-emitting gas. This lack of spatial information is typically compensated by introducing model assumptions, which allow us to relate a certain physical scenario with the measured spectrum. Unfortunately, these models often include a large number of free parameters, which can result in parameter degeneracies, where different parameter combinations result in similar spectra. Another problem are model degeneracies, where different classes of physical models can not be distinguished using spectroscopic data. In some cases, these model classes might correspond to fundamentally different physical scenarios. For instance, in the case of the Herbig Ae/Be stars, it is still debated whether the Br emission in these objects traces mass accretion or mass outflow processes (see discussion in Kraus et al., 2008). These degeneracies become more and more severe, as the models become more and more complex.
Fortunately, many of the aforementioned limitations and degeneracies can now be solved using optical interferometers such as ESO’s Very Large Telescope Interferometer (VLTI), which combine the light from separate optical apertures in order to reach an unprecedented, milliarcsecond (mas) angular resolution. In this contribution, I would like to outline how spatially and spectrally resolved observations can be combined in order to solve some of the aforementioned model ambiguities, where I consider three approaches: In Section 2, I discuss some of the opportunities provided by coordinated spectroscopic and interferometric observations, while Section 3 discusses the ultimate combination of these techniques in spectro-interferometry. Another interesting and resources-efficient approach for obtaining some gas kinematical constraints is spectro-astrometry, which I will discuss in Section 4.
2 Complementary constraints from spectroscopy & interferometry
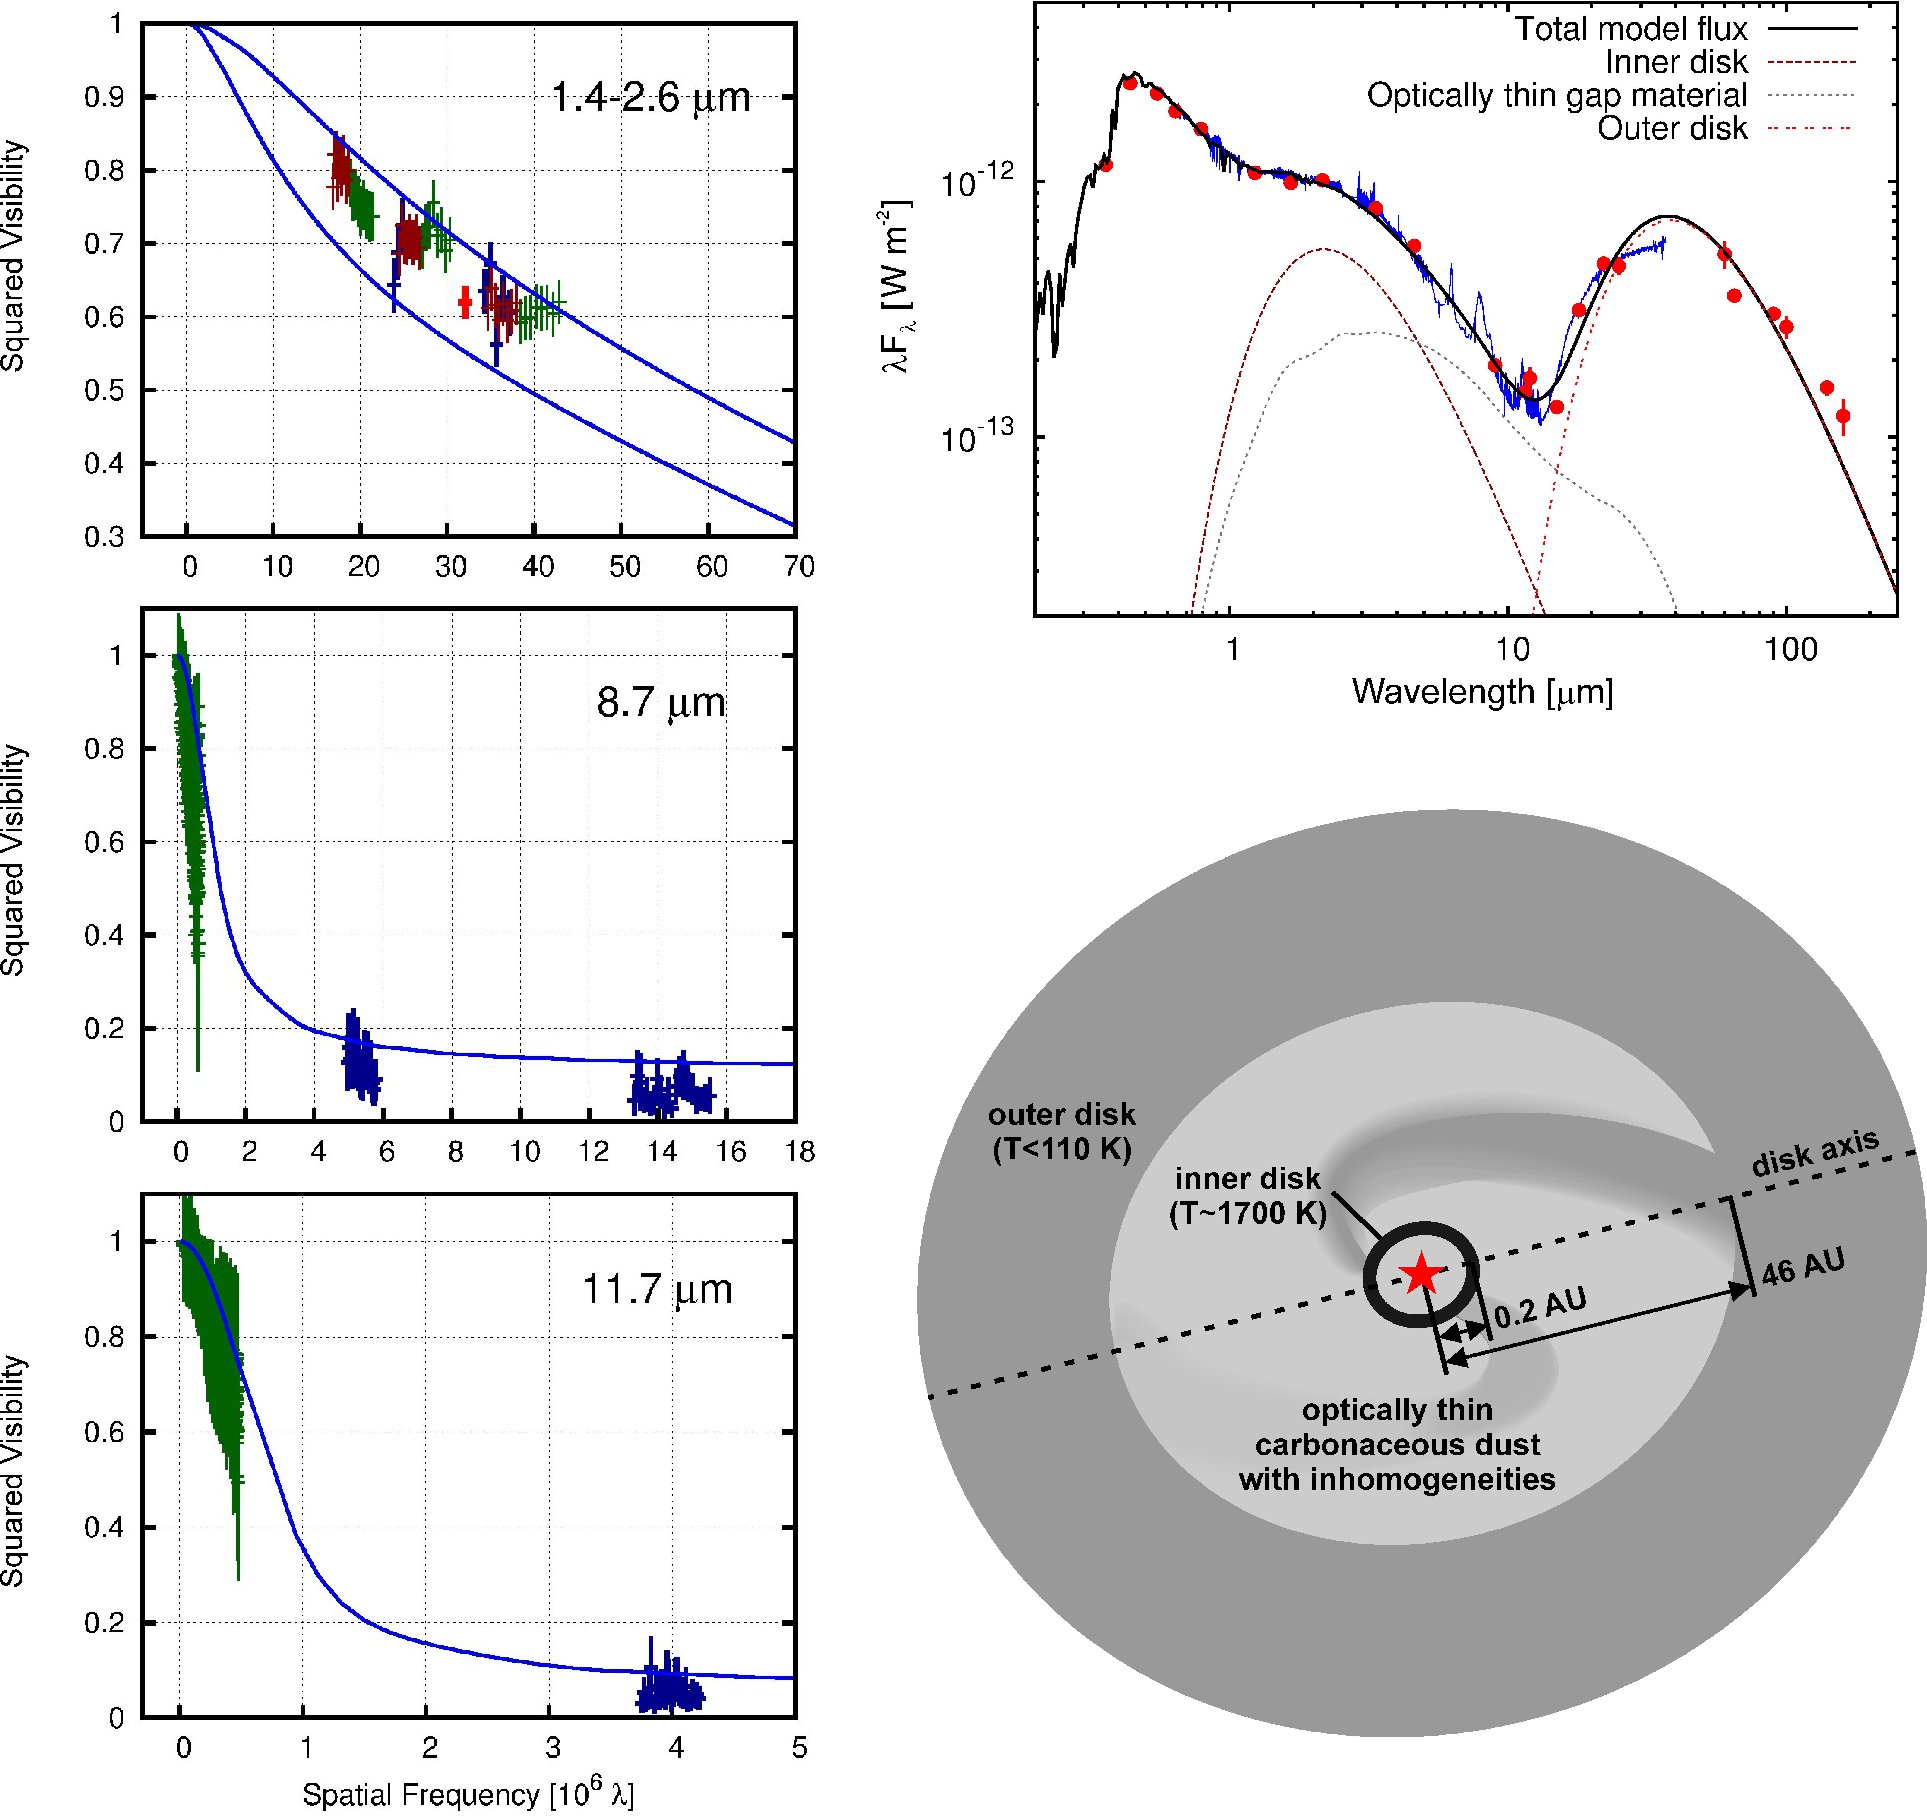
In order to illustrate the complementary nature of spectroscopy and interferometry, I discuss below our recent project on the pre-transitional disk of V1247 Orionis (Kraus et al., 2013), where we combined VLTI+Keck+Gemini infrared interferometry with IRTF, Spitzer, and HARPS spectroscopy.
V1247 Ori is a F0-type star located in the Orion OB1 b association. Earlier photometric observations on V1247 Ori measured a strong near- and far-infrared excess, but a deficit at mid-infrared wavelengths (Caballero, 2010), compared to classical T Tauri or Herbig Ae/Be disks. Given the coarse sampling of these earlier photometric observations, we obtained new spectroscopic observations using the near-infrared IRTF/SpeX (0.8-5.4 m) and mid-infrared IRTF/BASS (2.9-13.5 m) spectrograph, and complement them with archival Spitzer/IRS (5.2-38 m) and HARPS (-band) observations. The resulting spectral energy distribution (SED, Fig. 1, top right) clearly shows that V1247 Ori belongs to the class of “pre-transitional disks”, which are believed to exhibit extended disk gaps that might have been cleared by young planets located in the gap region (Espaillat et al., 2010). However, pure SED studies face serious ambiguities in solving the structure of these disks, as not only the radial structure of these disks, but also the viewing geometry and dust composition is unknown. Interferometry allows us to solve many of these ambiguities and to determine the location of the emitting material directly. For this purpose, we conducted near-infrared interferometric observations using the VLTI/AMBER and Keck Interferometer/V2-SPR instrument ( and -band), as well as mid-infrared interferometry using the VLTI/MIDI instrument (-band). These long-baseline interferometric observations cover baseline lengths between 43 and 125 m and were complemented with Gemini/TreCS speckle interferometry and Keck/NIRC2 aperture masking interferometry, which sample shorter baseline lengths m.
In order to model the interferometric data we require knowledge about the stellar properties. Unfortunately, the spectral type classification in the literature shows a wide spread from F0V to A5III. Therefore, we repeated the classification using the HARPS spectra and find best agreement with spectral type F0V ( K), where we adopt a distance of pc for the Alnilam cluster (Caballero & Solano, 2008).
Using our mid-infrared interferometric observations, we determined the disk inclination angle to . We then model the interferometric visibilities and SED data using a temperature power-law disk model (Fig. 1). The near-infrared emission traces a ring-like inner disk that is located at the dust sublimation radius at 0.2 AU. This narrow inner disk is separated from the outer disk that starts at 46 AU. Surprisingly, we find that the gap region is filled with significant amounts of optically thin material with a carbon-dominated dust mineralogy. State-of-the-art SED models often associate this MIR excess emission to an heated wall of the outer disk (e.g. Espaillat et al., 2011), which illustrates the importance of our multi-wavelength interferometry approach for unveiling the real geometry of these important objects.
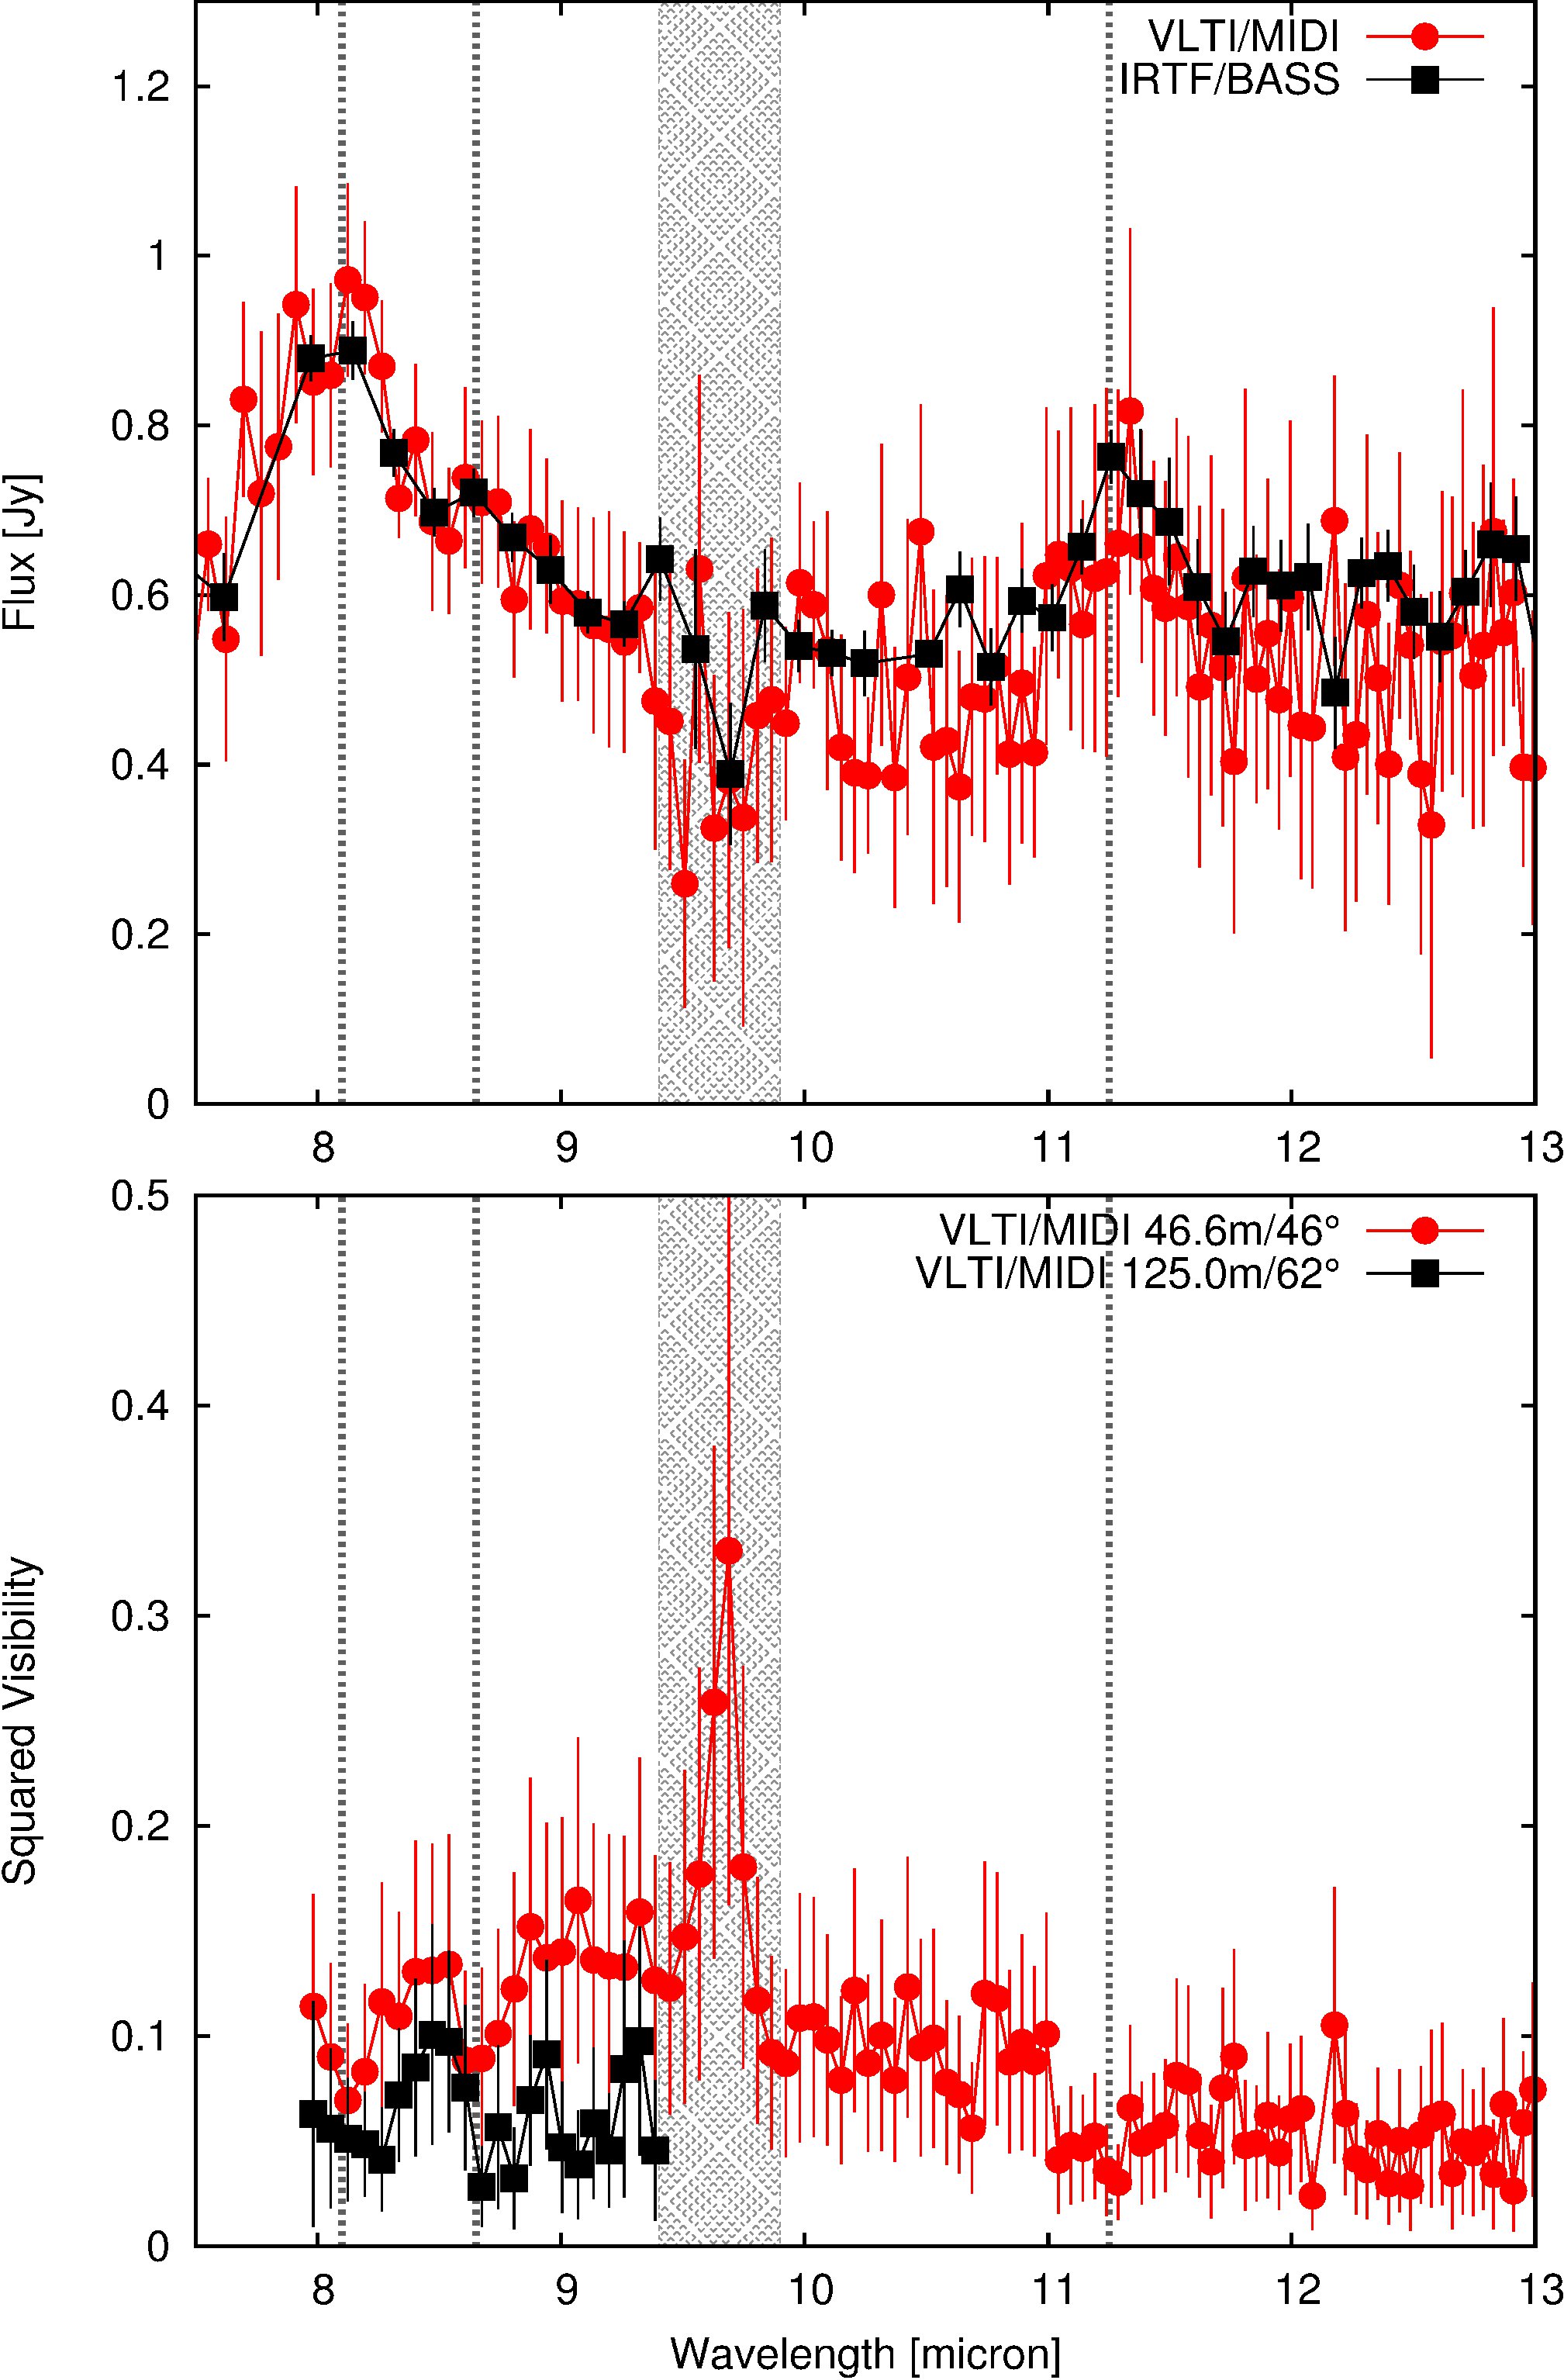
Besides the dust continuum, our spectrally dispersed VLTI/MIDI -band observations also cover spectral features corresponding to the hydrocarbon (PAH) emission (Fig. 2, top). The measured visibilities show a small drop of visibility at the position of the PAH lines (Fig. 2, bottom), which indicates that the PAH-emission originates from significantly larger stellocentric radii than the dust continuum, likely the outer disk.
Finally, our Keck/NIRC2 aperture masking interferometry (, , and band) reveals non-zero phase signals, which indicate asymmetries in the brightness distribution on scales of 10..20 AU, i.e. within the gap region. The detected asymmetries are highly significant, yet their amplitude and direction changes with wavelength, which is not consistent with a companion interpretation but indicates asymmetries in the disk structure itself. We interpret this as strong evidence for the presence of complex density structures, possibly reflecting the dynamical interaction of the disk material with sub-stellar mass bodies that are responsible for the gap clearing.
V1247 Ori exhibits photometric occultation events and spectroscopic variability (Caballero, 2010; Kraus et al., 2013), possibly indicating highly dynamic processes that might be at work in the inner disk regions. An important objective of future investigations will be to investigate the origin of this variability. Espaillat et al. (2011) monitored a sample of pre-transitional disks with Spitzer spectroscopy and found that the variability shows an anti-correlated behaviour at NIR and MIR wavelengths. In order to explain both the timescale and spectral behaviour of the variability, they proposed shadowing effects from co-rotating disk warps at the inner dust rim, probably triggered by orbiting planets. Such warps are also predicted by hydrodynamic simulations of disks with embedded planets (e.g. Fouchet et al., 2010) and would result in a highly asymmetric brightness distribution.
Multi-epoch interferometric imaging observations could allow us to detect these planet-induced disk structures and to trace their evolution and orbital motion around the star, which would provide new observational constraints on theories of disk dispersal and planet formation. These interferometric observations should be accompanied with extensive spectroscopic monitoring, which might enable to relate any detected structural changes with the observed spectro-/photometric variability.
3 Spectro-interferometry: Spectroscopy meets long-baseline interferometry
In the last chapter, I outlined the advantages of coordinating spectroscopic and interferometric observations in a joint observing campaign. Even more powerful constraints are provided by spectro-interferometric instruments that incorporate high-resolution spectrographs in order to spectrally disperse the interferometric signals directly.
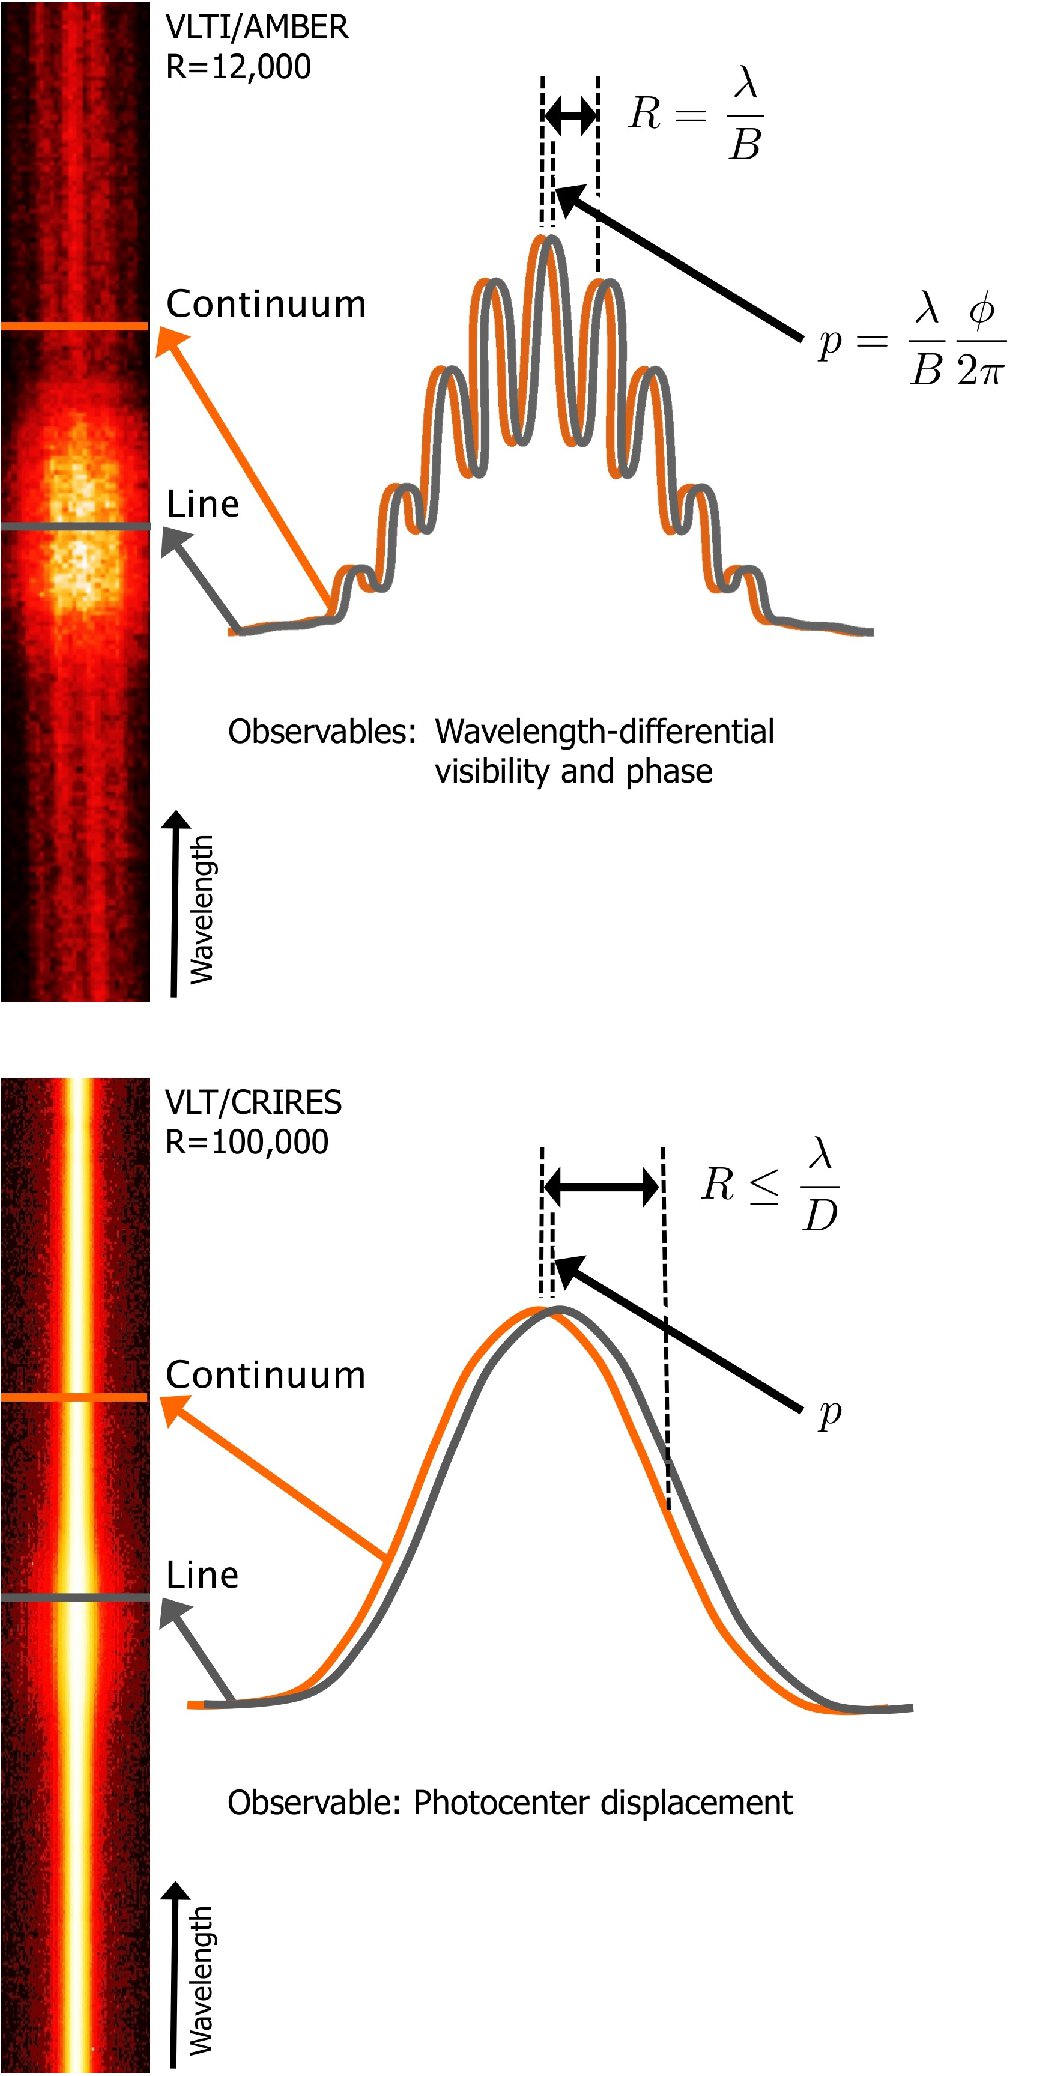
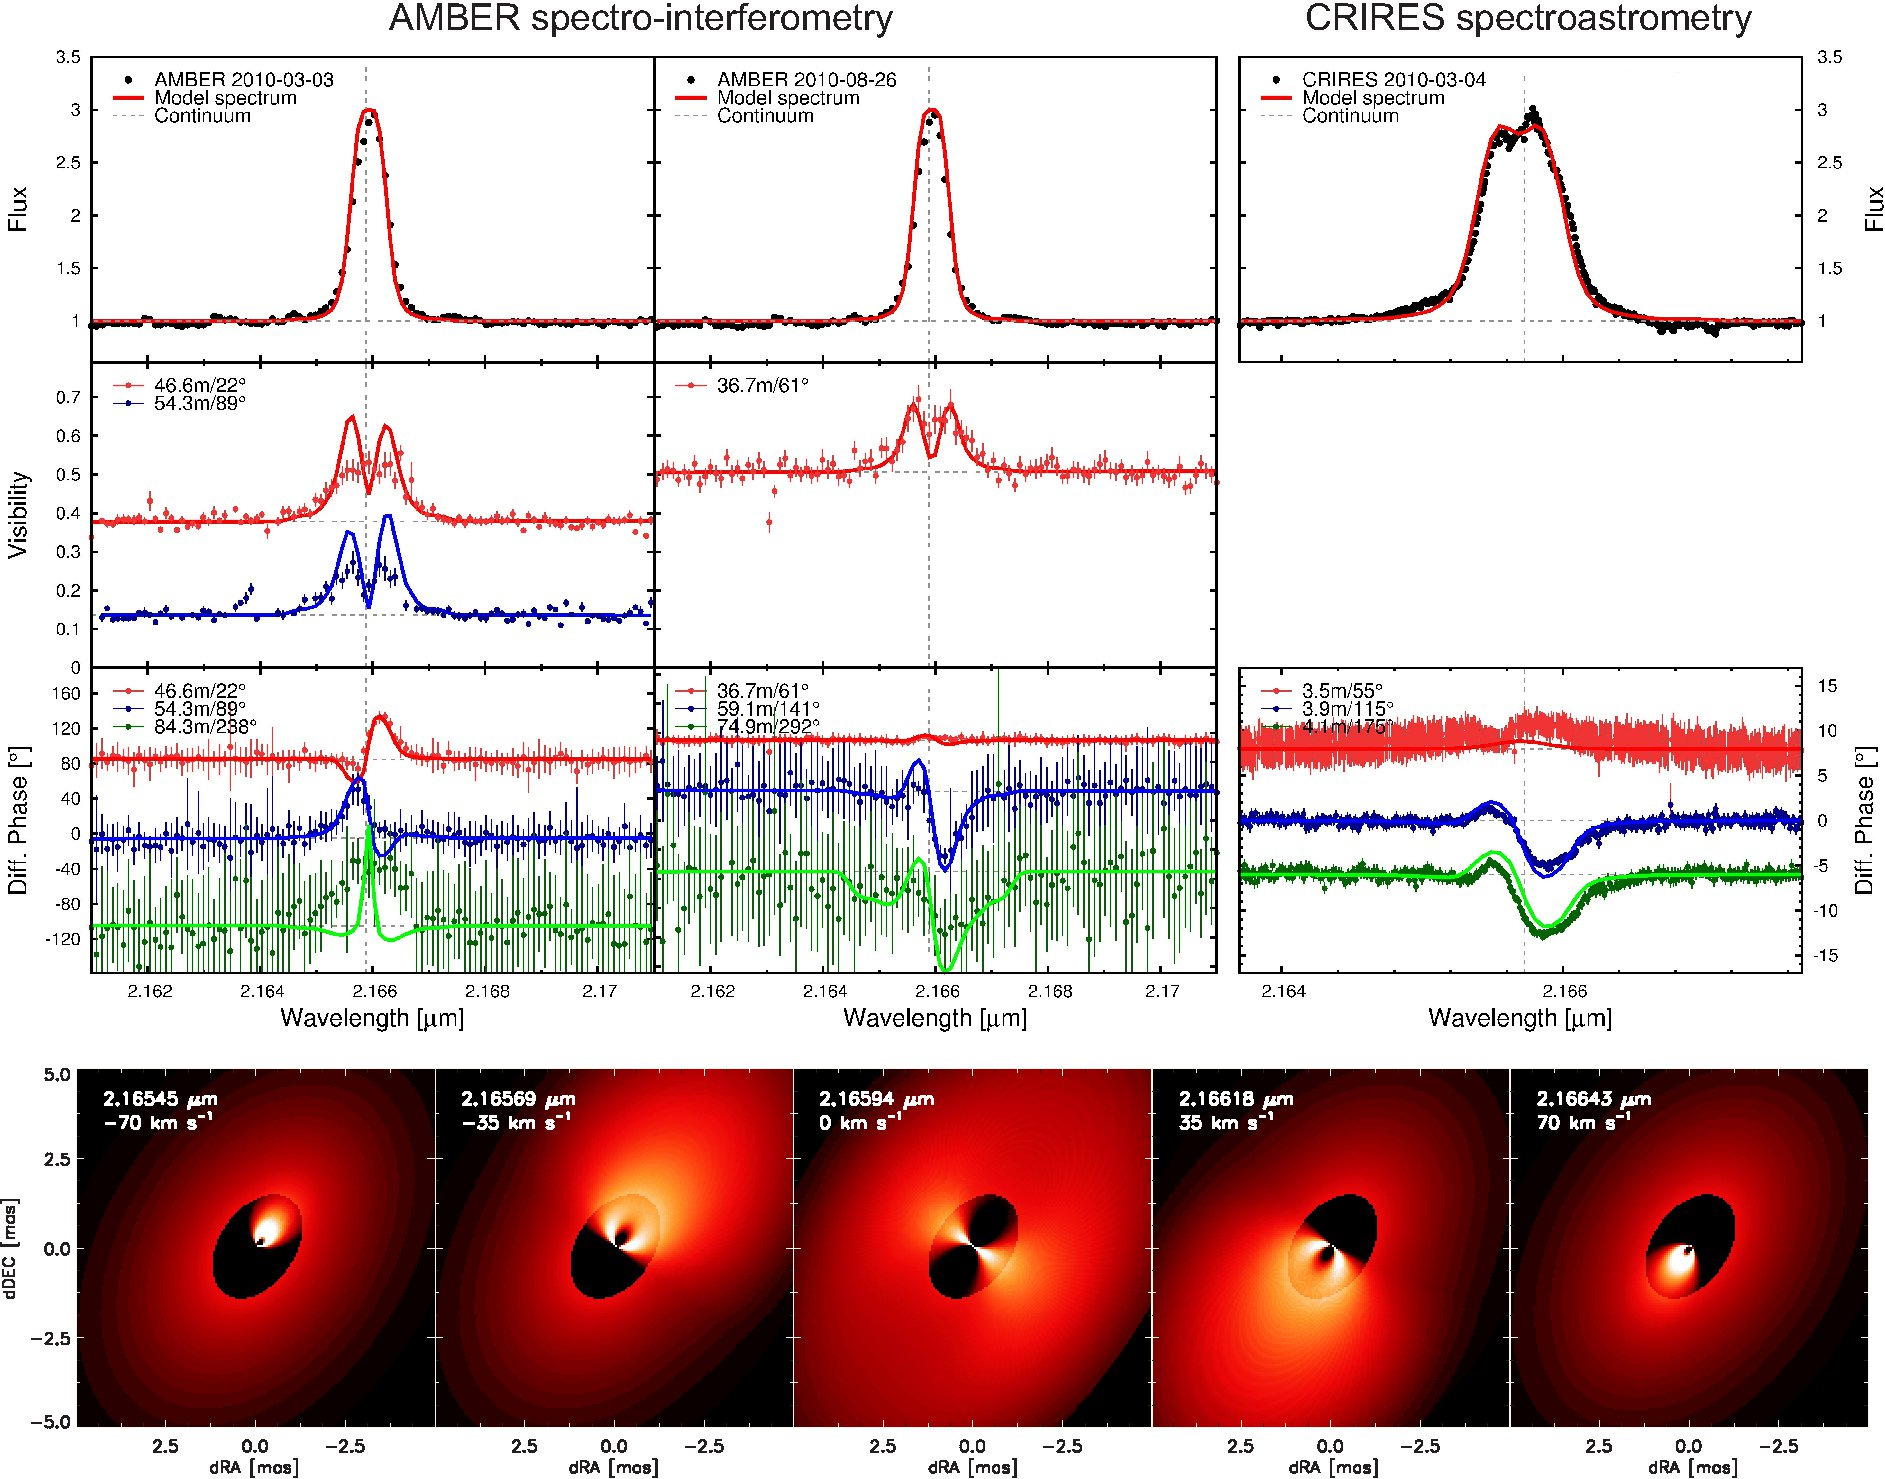
From these dispersed interferograms, we can derive the visibility amplitude (interferogram contrast) and phase (interferogram shift) in hundreds of spectral channels. The visibilities and phases allow us to constrain the brightness distribution in each of these spectral channels, covering simultaneously the continuum and emission or absorption lines. A particularly useful quantity is the differential phase ( in Fig. 3, top), i.e. the phase difference between different spectral channels, which is also one of the few quantities that are invariant to atmospheric perturbations (Petrov, 1989). For marginally resolved objects, the differential phase in a certain spectral line channel is directly related to the photocenter displacement of the line-emitting region with respect to the photocenter of the continuum emission, as projected on the telescope baseline. The typical differential phase accuracy that can currently be reached is , which for a 100 m baseline corresponds to a photocenter displacement of just 0.012 mas or 0.002 AU () at the distance of the Taurus star forming region. Measurements towards at least two different positon angles on the sky (which can be obtained from a single 3-telescope observations) are required in order to “triangulate” the 2-D photocenter vector from these baseline-projected photocenter offsets.
The two operational instruments that offer this observing mode with sufficient resolution for detailed kinematical studies are the near-infrared VLTI/AMBER instrument (spectral resolution up to , Petrov et al., 2007) and the visual wavelength VEGA instrument at the CHARA array (up to , Mourard et al., 2012).
For instance, in a recent study we used AMBER in order to study the disks around classical Be stars (Kraus et al., 2012c). Classical Be stars are surrounded by a gaseous disk that is formed of ejected stellar material. However, both the ejection mechanism and the subsequent evolution of the disk material remain poorly understood. The proposed scenarios include radiatively driven winds, ram pressure or magnetically induced wind compression, and viscous decretion (Porter & Rivinius, 2003).
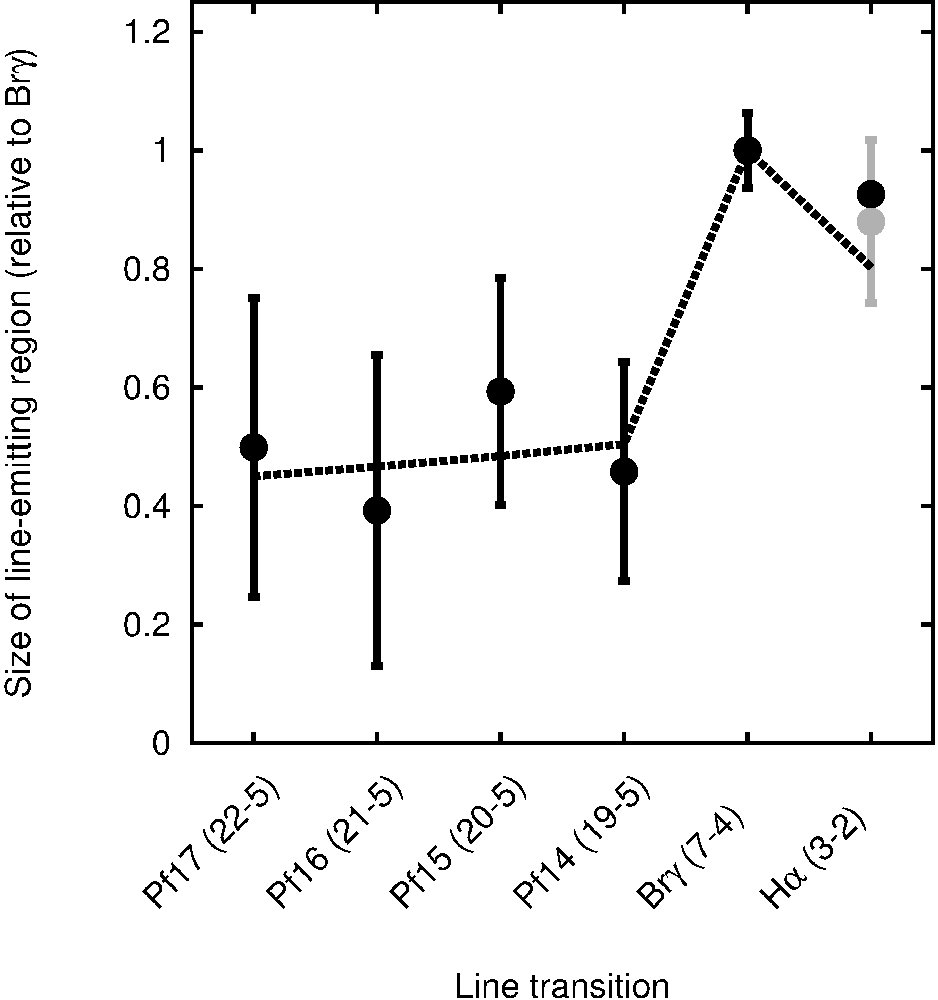
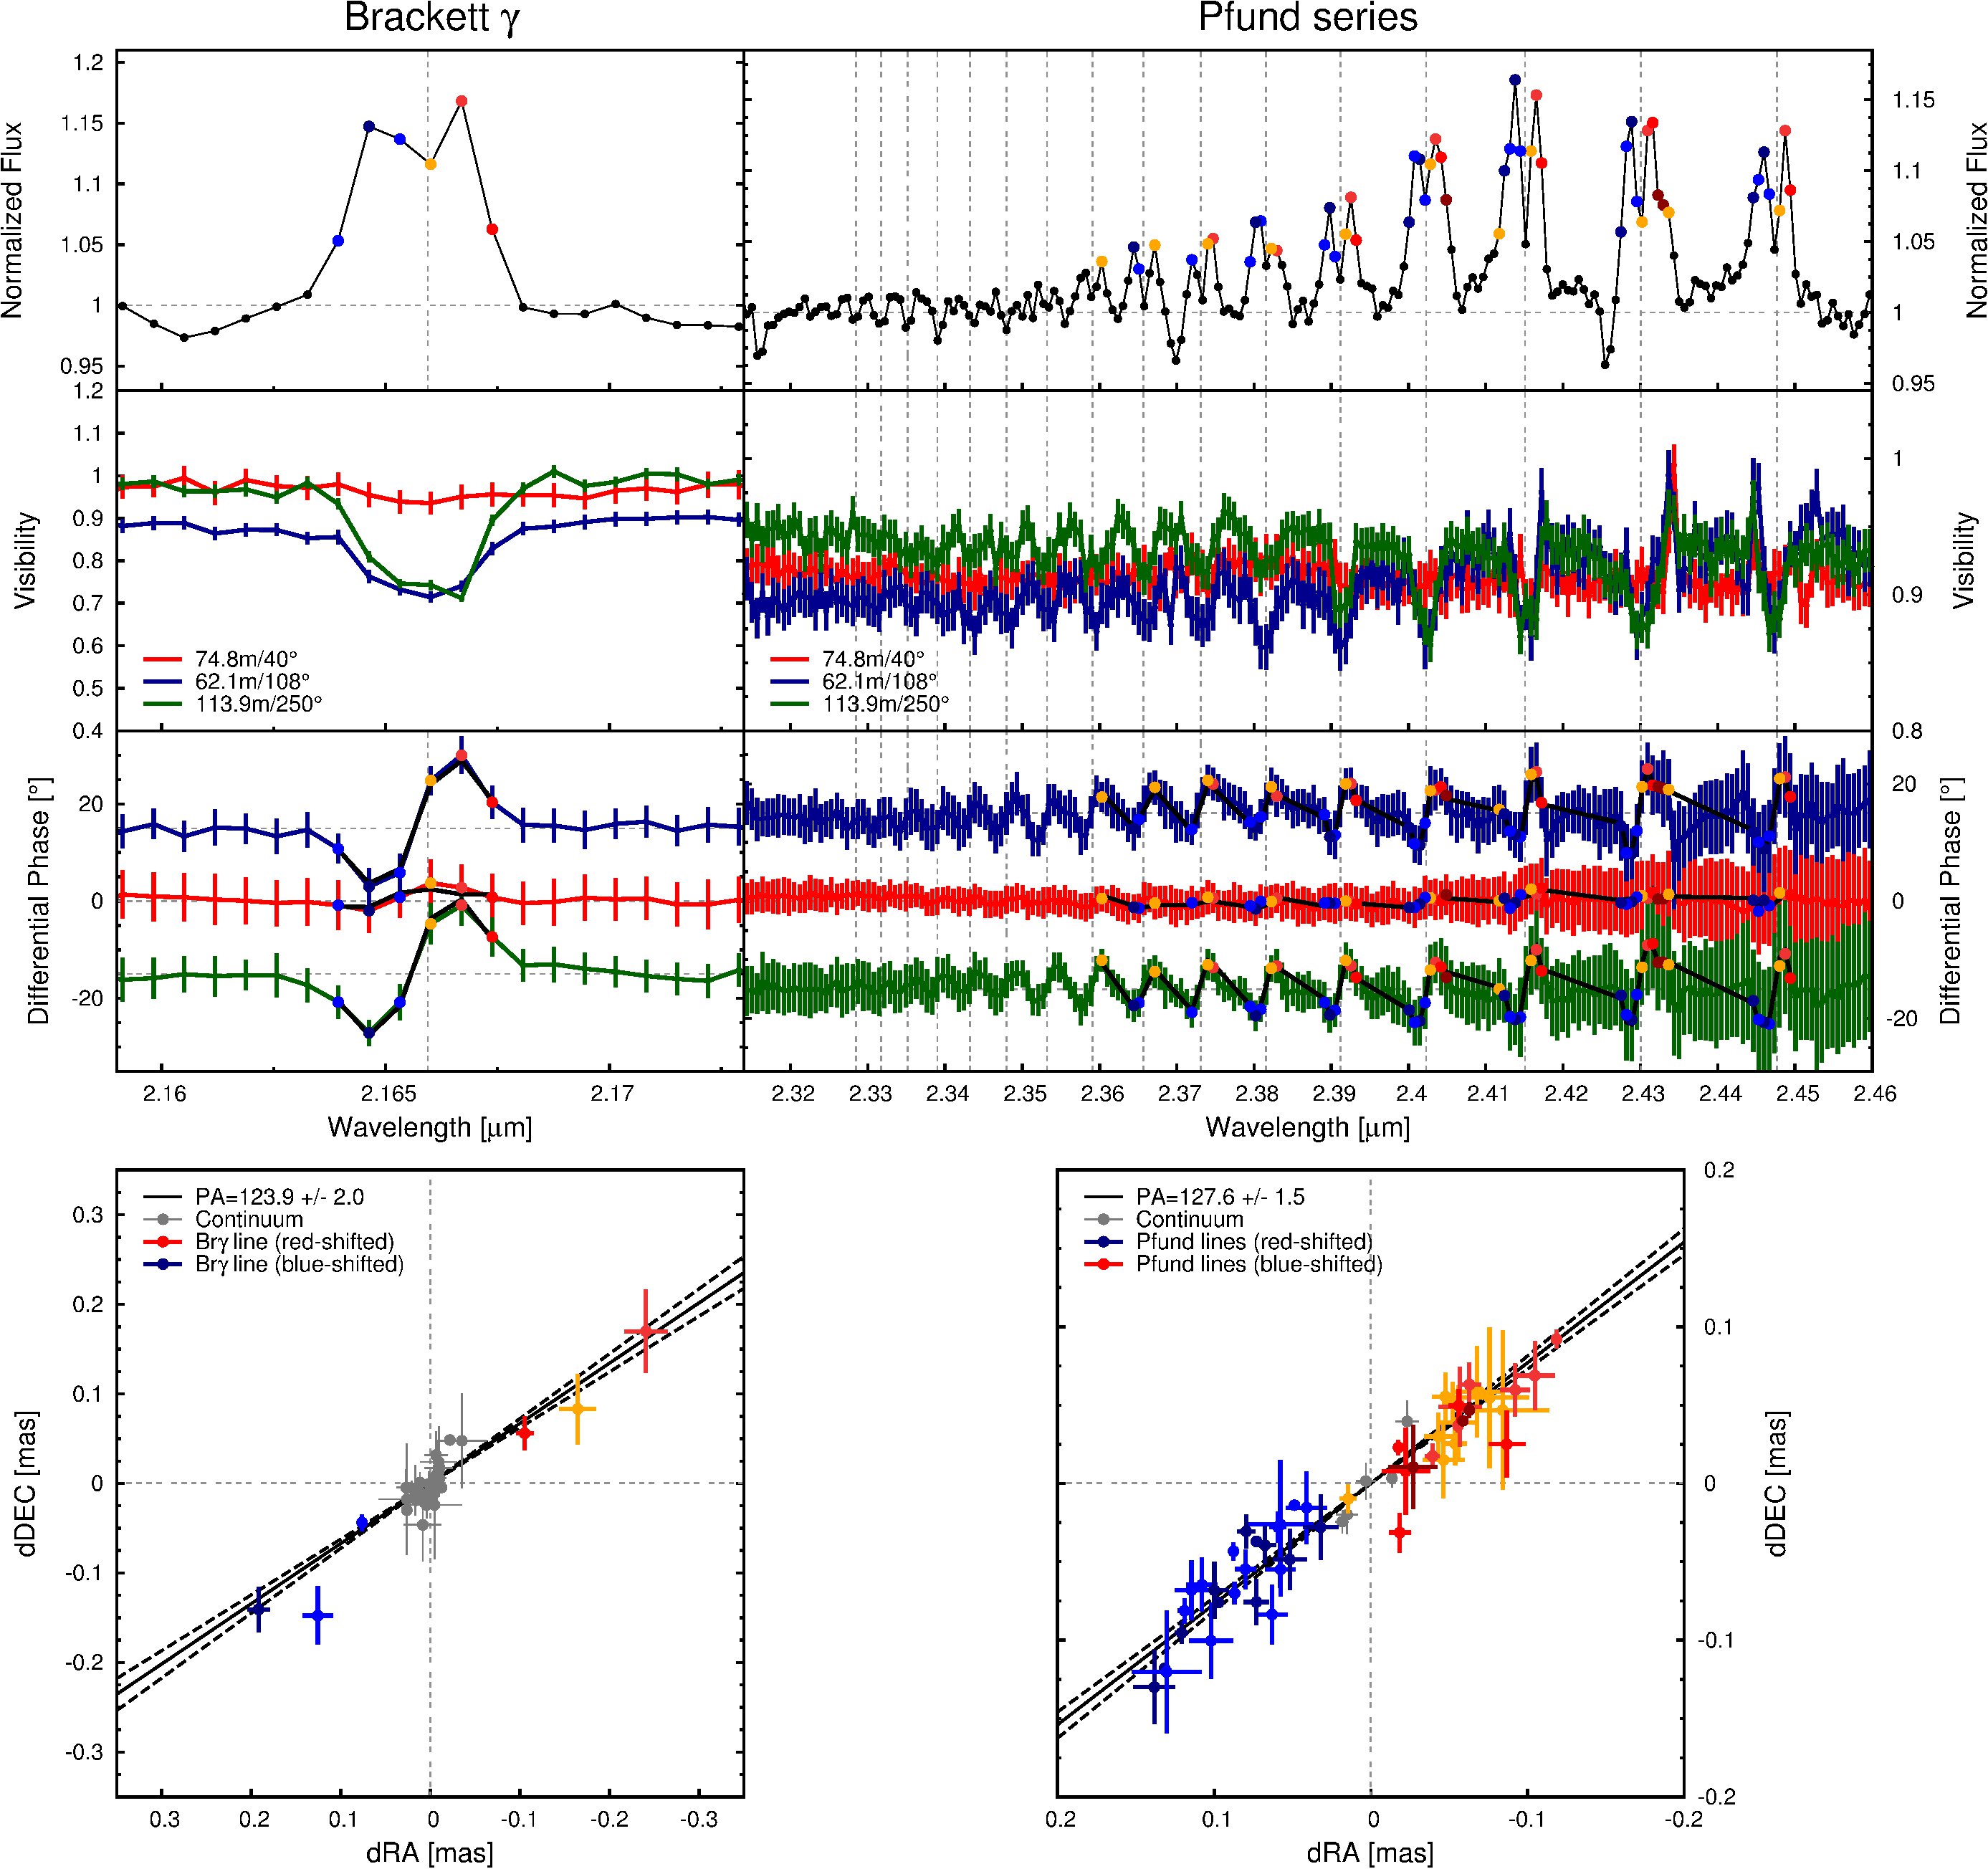
Our study on the classical Be star Tau used AMBER’s medium resolution code () and covered the Br 2.16 m and at least nine transitions from the Pfund series (Pf14-22, 2.359-2.448 m). These lines can be covered with a single spectral setup in about one hour of total observing time, which makes these observations highly efficient. Both the Brackett and Pfund lines show a double-peaked profile (Fig. 4, top row), which is consistent with a disk rotation interpretation. In Figure 4 (bottom panels), we show the photocenter displacements that we have computed for Tau, both for the Br line (left panel), and the Pf14-22 lines (right panel). We find that the blue- and red-shifted line emission emerges from opposite directions with respect to the star, revealing the disk rotation axis (position angle ). The measured visibilities show a significant drop, which indicates that the line emission originates from larger stellocentric radii than the underlying continuum emission.
We supplement our data with archival measurements for the H line (Quirrenbach et al., 1994; Vakili et al., 1998; Tycner et al., 2004) and find that the Br-line originates from similar stellocentric radii as the H-line, while the Pfund lines originate much closer to the star. Using a simple LTE model, we can reproduce the differences in the spatial origin of the line transitions and constrain the temperature and excitation structure of the disk (Fig. 5). More detailed observations should enable us to derive also the disk ionization and vertical temperature structure, which are currently difficult to access.
Further improvements in the efficiency of uv-sampling will also soon enable the reconstruction of interferometric images for each velocity channel, providing the equivalent to the “channel maps” in radio interferometry. First attempts in this direction have been presented for instance by Schmitt et al. (2009) and Millour et al. (2011).
4 Spectro-astrometry
Another technique that can provide detailed kinematical and spatial information about the gas distribution on AU-scales is spectro-astrometry. Spectro-astrometry uses high-SNR long-slit spectra to measure the centroid position of an apparently unresolved object as function of wavelength (Fig. 3, bottom). By design, this technique is not able to resolve the line-emitting region directly (e.g. it does not provide visibility information), but it can reveal small-scale photocenter displacements, which are mathematically equivalent to the wavelength-differential phases measured in spectro-interferometry in the short-baseline regime. This makes it possible to combine the AMBER (visibility, differential phase, closure phase) and the spectro-astrometric signals directly for quantitative modeling, providing highly complementary constraints.
For our combined spectro-interferometry + spectro-astrometric observations, we employed the VLTI/AMBER () and VLT/CRIRES () instruments and targeted the B[e] star V921 Scorpii (Kraus et al., 2012a, b). Important aspects about V921 Sco are still strongly debated, including its distance and evolutionary stage, where both a pre-main-sequence (e.g. Benedettini et al., 1998) and a post-main-sequence (e.g. Borges Fernandes et al., 2007) nature has been suggested.
The CRIRES spectra were obtained with the slit oriented towards three position angles (55, 115, 175∘) and the corresponding anti-parallel positions (235, 295, 355∘). The spectro-astrometric signals were derived for each position angle separately and then the signals towards parallel and anti-parallel position angles were subtracted, which provides an efficient method for eliminating instrumental artefacts (Brannigan et al., 2006).
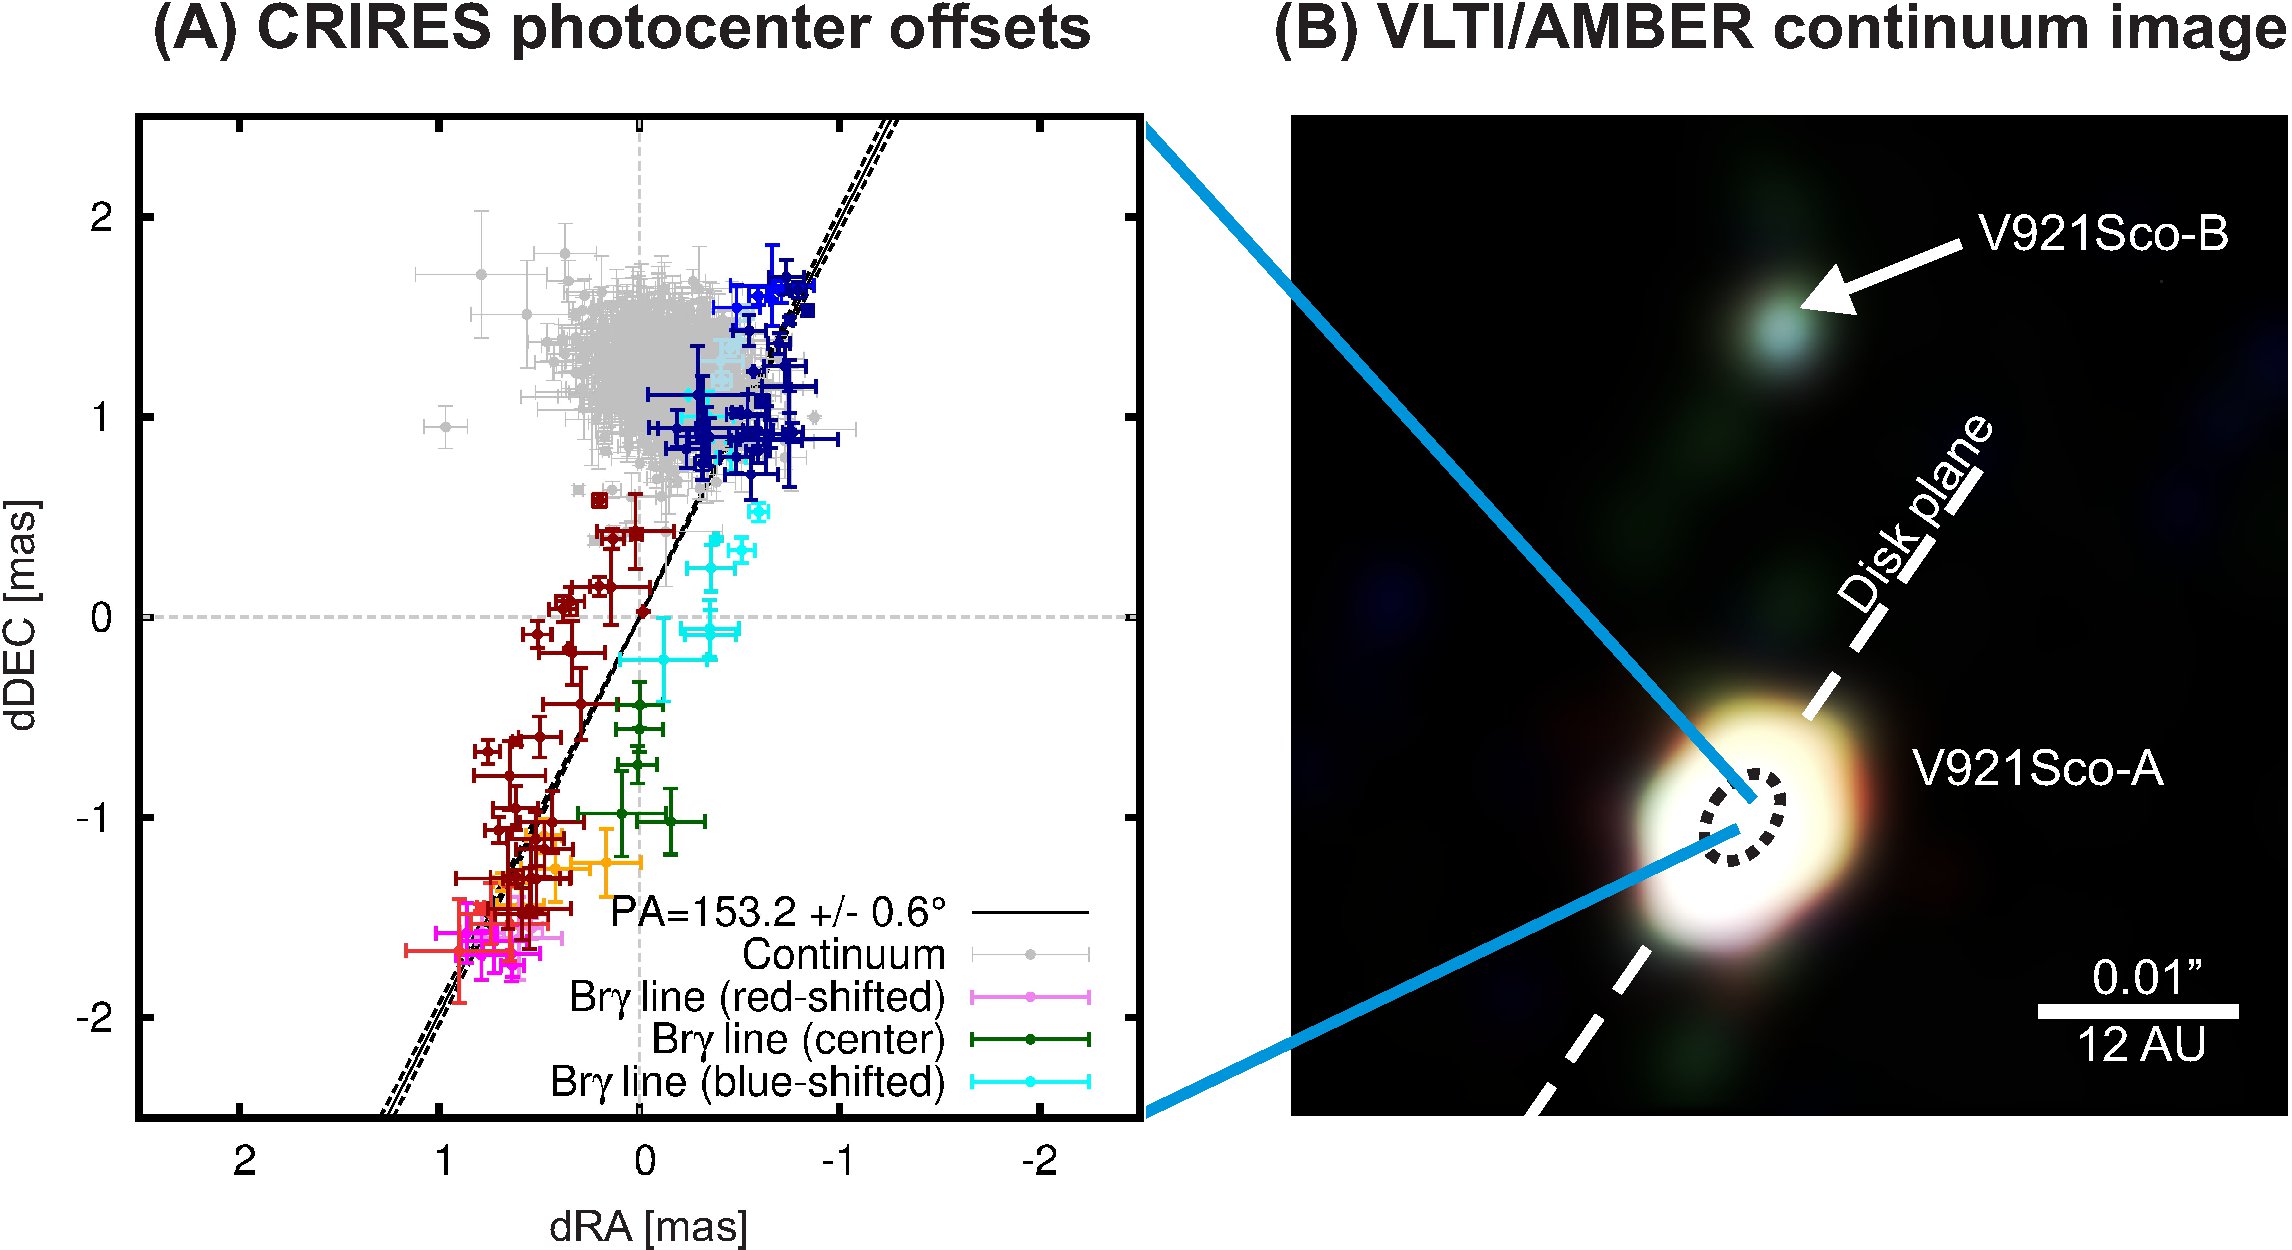
Considering the CRIRES spectro-astrometric measurements alone leads to puzzling results: The photocenter in the red-shifted line channels (red data points in Fig. 6, left) shows a significant offset of mas, while the blue-shifted channels (blue data points) do not show a significant displacement with respect to the continuum channels (grey data points). This behaviour is not consistent with the expected signature for a rotating circumstellar disk, where the photocenter of the blue and red-shifted line emission should be displaced with similar amplitude in opposite directions from the central star, but might guide us to the interpretation that the Br emission is associated, for instance, with a one-sided jet instead of a rotation disk.
However, the puzzle was solved with a VLTI/AMBER aperture synthesis image that we reconstructed from AMBER continuum data ( and -band; Fig. 6, right). The image reveals a previously unknown companion that is located at a separation of mas ( AU) in northern direction (PA ) from the disk-harboring B0V-type star. Therefore, the continuum photocenter is shifted systematically towards the direction of the companion, while the primary star is located to a good accuracy half-way between the blue- and red-shifted photocenter vectors, consistent with a disk scenario.
Taking the presence of the companion into account, we then engaged in a detailed modeling of the spectro-astrometric and the detected strong AMBER visibility and differential phase signals (Fig. 7, 2nd and 3rd row from top). For this purpose, we tested rotation disks with different velocity profiles and found reasonable agreement with a Keplerian disk, where most of the line-emitting gas is located inside of the dust sublimation radius that we constrain to mas or AU (see best-fit model images in Fig. 7, bottom).
Our detection of a Keplerian velocity field provides important evidence for the pre-main-sequence (Herbig B[e]) nature of V921 Sco, as the decretion disks around post-main-sequence supergiant B[e] stars are expected to exhibit a strong outflowing velocity component (Lamers & Pauldrach, 1991), which is not observed in our data. Also, we find that the previous distance estimates have likely underestimated the distance to V921 Sco ( kpc), as this distance implies with our measured rotation profile a stellar mass of just , which is significantly lower than expected from the spectral classification.
5 Conclusions
Spectroscopy and interferometry provide highly complementary constraints and extend our observational capabilities in the spectral and spatial domain. We are just starting to explore the scientific opportunities that arise from combining these techniques, but it is clear that the unique combination of high spatial and high spectral resolution could enable transformational studies both in galactic and extragalactic astronomy.
Particularly powerful constraints can be obtained with spectro-interferometry, as I have illustrated with our studies on Tau and V921 Sco, where we constrained the spatial distribution and kinematics of the line-emitting hydrogen gas on scales of a few stellar radii. For faint () or strongly resolved objects, it is still rather challenging to perform these observations, mainly due to the stringent requirements on fringe tracking and the low efficiency of filling the -plane with 3-telescope interferometric observations. Therefore, we investigated the possibility of combining spectro-interferometry with spectro-astrometric observations that can be conducted with conventional spectrographs, providing a resource-efficient approach to obtain indispensable constraints for a kinematical modeling.
Efficient model-independent imaging should become accessible with the upcoming generation of spectro-interferometric 4-telescope beam combiners and will enable detailed studies on complex velocity structures or on time-variable processes.
References
- Benedettini et al. (1998) Benedettini, M., Nisini, B., Giannini, T., Lorenzetti, D., Tommasi, E., Saraceno, P., & Smith, H. A. 1998, A&A, 339, 159
- Borges Fernandes et al. (2007) Borges Fernandes, M., Kraus, M., Lorenz Martins, S., & de Araújo, F. X. 2007, MNRAS, 377, 1343
- Brannigan et al. (2006) Brannigan, E., Takami, M., Chrysostomou, A., & Bailey, J. 2006, MNRAS, 367, 315
- Caballero (2010) Caballero, J. A. 2010, A&A, 511, L9
- Caballero & Solano (2008) Caballero, J. A., & Solano, E. 2008, A&A, 485, 931
- Espaillat et al. (2011) Espaillat, C., Furlan, E., D’Alessio, P., Sargent, B., Nagel, E., Calvet, N., Watson, D. M., & Muzerolle, J. 2011, ApJ, 728, 49
- Espaillat et al. (2010) Espaillat, C., et al. 2010, ApJ, 717, 441
- Fouchet et al. (2010) Fouchet, L., Gonzalez, J.-F., & Maddison, S. T. 2010, A&A, 518, A16
- Kraus et al. (2012a) Kraus, S., Calvet, N., Hartmann, L., Hofmann, K.-H., Kreplin, A., Monnier, J. D., & Weigelt, G. 2012a, ApJ, 746, L2
- Kraus et al. (2012b) —. 2012b, ApJ, 752, 11
- Kraus et al. (2008) Kraus, S., et al. 2008, A&A, 489, 1157
- Kraus et al. (2012c) —. 2012c, ApJ, 744, 19
- Kraus et al. (2013) —. 2013, ApJ, 768, 80
- Lamers & Pauldrach (1991) Lamers, H. J. G., & Pauldrach, A. W. A. 1991, A&A, 244, L5
- Millour et al. (2011) Millour, F., Meilland, A., Chesneau, O., Stee, P., Kanaan, S., Petrov, R., Mourard, D., & Kraus, S. 2011, A&A, 526, A107+
- Mourard et al. (2012) Mourard, D., et al. 2012, in Society of Photo-Optical Instrumentation Engineers (SPIE) Conference Series, Vol. 8445, Society of Photo-Optical Instrumentation Engineers (SPIE) Conference Series
- Petrov (1989) Petrov, R. G. 1989, in NATO ASIC Proc. 274: Diffraction-Limited Imaging with Very Large Telescopes, ed. D. M. Alloin & J.-M. Mariotti, 249
- Petrov et al. (2007) Petrov, R. G., et al. 2007, A&A, 464, 1
- Porter & Rivinius (2003) Porter, J. M., & Rivinius, T. 2003, PASP, 115, 1153
- Quirrenbach et al. (1994) Quirrenbach, A., Buscher, D. F., Mozurkewich, D., Hummel, C. A., & Armstrong, J. T. 1994, A&A, 283, L13
- Schmitt et al. (2009) Schmitt, H. R., et al. 2009, ApJ, 691, 984
- Tycner et al. (2004) Tycner, C., et al. 2004, AJ, 127, 1194
- Vakili et al. (1998) Vakili, F., et al. 1998, A&A, 335, 261
- Weigelt et al. (2007) Weigelt, G., et al. 2007, A&A, 464, 87