The Ultraviolet Sky: An Overview from the GALEX Surveys. 111The catalogs presented in this paper are accessible on line.
Abstract
The Galaxy Evolution Explorer (GALEX) has performed the first surveys of the sky in the Ultraviolet (UV). Its legacy is an unprecedented database with more than 200 million source measurements in far-UV (FUV) and near-UV (NUV), as well as wide-field imaging of extended objects, filling an important gap in our view of the sky across the electromagnetic spectrum. The UV surveys offer unique sensitivity for identifying and studying selected classes of astrophysical objects, both stellar and extra-galactic. We examine the overall content and distribution of UV sources over the sky, and with magnitude and color. For this purpose, we have constructed final catalogs of UV sources with homogeneous quality, eliminating duplicate measurements of the same source. Such catalogs can facilitate a variety of investigations on UV-selected samples, as well as planning of observations with future missions. We describe the criteria used to build the catalogs, their coverage and completeness. We included observations in which both the far-UV and near-UV detectors were exposed; 28,707 fields from the All-Sky Imaging survey (AIS) cover a unique area of 22,080 square degrees (after we restrict the catalogues to the central 1deg diameter of the field), with a typical depth of 20/21 mag (FUV/NUV, in the AB mag system), and 3,008 fields from the Medium-depth Imaging Survey (MIS) cover a total of 2,251 square degrees at a depth of 22.7mag. The catalogs contain 71 and 16.6 million sources respectively. The density of hot stars reflects the Galactic structure, and the number counts of both Galactic and extra-galactic sources are modulated by the Milky Way dust extinction, to which the UV data are very sensitive.
keywords:
Ultraviolet: surveys; Astronomical Data Bases: catalogs; Galaxies: Milky Way; Ultraviolet: galaxies; Ultraviolet: QSOsurl]http://dolomiti.pha.jhu.edu
1 Introduction
For over eight years the Galaxy Evolution Explorer (GALEX, Martin et al. 2005, Morrissey et al. 2007, Bianchi 2009, 2011) has surveyed the sky at ultraviolet (UV) wavelengths. Other instruments have provided, and are providing, a variety of observations in this range of the electromagnetic spectrum, but no imaging sky surveys had been performed prior to GALEX. Not surprisingly, many unexpected discoveries and results have emerged, beyond the original science goals of the GALEX mission (e.g. Bianchi 2011 for a partial review, Martin et al. 2007, Wyder et al. 2009, Thilker et al. 2007a, Bianchi 2012).
A long-lasting heritage of GALEX is its database with over 200 million measurements of sources in two UV broad bands, far-UV (FUV, 1344-1786Å) and near-UV (NUV, 1771-2831Å), as well as imaging covering most of the sky, and grism spectra for large subsamples. This database is an unprecedented resource for stellar science, for studies of extragalactic objects such as star-forming galaxies and QSOs, and for studies of interstellar medium and dust in particular, because UV fluxes are very sensitive to interstellar extinction by dust. It allows for the first time analysis of UV-selected samples of objects, or complementing with UV data measurements of large samples at longer wavelengths.
On one hand, UV photometry combined with optical data critically increases the sensitivity to identify the hottest stars, and to estimate their effective temperature, accounting for interstellar extinction. For example, the color difference between a =50,000K and 20,000K star is 1.5mag in FUV-g, but only 0.4mag in U-B, and 0.15 mag in g-r, the latter being comparable to photometric errors when all things are considered. The sensitivity gained by measurements at UV wavelengths is even more critical for discerning the extremely hot stars. In particular, hot white dwarfs (WD) are elusive at all wavelengths except the UV, because of their very high and low optical luminosity. Bianchi et al. (2011a) extracted a first census of hot WDs in the Milky Way from GALEX data and compared it with Milky Way models to test current assumptions on late-stage evolution of intermediate-mass stars, independently from other methods. Combined with optical measurements, the GALEX photometry also uniquely enables identification of hot WDs in binaries (e.g. Sahai et al. 2008, Bianchi 2007 and 2013 in preparation). As another example, QSOs with redshift 1 can be unambiguously selected and separated from other classes of objects with combinations of UV and optical colors (e.g. Hutchings et al. 2010).
In this work we present an overview of the UV source distribution across the sky, and discuss the global content and characteristics of the final database obtained from the UV sky surveys. For this purpose we constructed catalogs of unique UV sources (removing duplicate measurements) with homogeneous depth and quality. The catalogs are made available on line, and can support statistical studies of both Galactic and extragalactic objects.
The paper is arranged as follows. In Section 2 we describe the essential characteristics of the GALEX data; in Section 3 we explain the criteria used to construct the UV source catalogs and describe their content; in Section 4 we use the catalogs to present (for the first time) an overview of the UV sky, and in Section 5 we summarize the major existing and upcoming optical surveys which provide useful corollary data for the UV sources. Appendix A gives more details on the catalogs. Throughout this paper we refer to magnitudes in the ABmag system. Coefficients for transformation between AB and Vega magnitudes are given in Table 1 of Bianchi (2011) for the GALEX passbands and other major photometric systems.
2 The GALEX Data. The Sky surveys.
GALEX has performed sky surveys with different depth and coverage (see Morrissey et al. 2007, Bianchi 2009) in two Ultraviolet bands, FUV (eff 1528Å, 1344-1786Å) and NUV (eff 2310Å, 1771-2831Å). The two detectors observed simoultaneously, thanks to a dichroic beam splitter, providing observations of the same field in the two bands at the same time. The FUV detector stopped working in May 2009, and subsequent GALEX observations only provided NUV imaging.
The GALEX field of view is 1.2∘ diameter (1.28/1.24∘, FUV/NUV), and the spatial resolution is 4.2/5.3′′ (Morrissey e al. 2007); the FUV and NUV images for each observation are reconstructed from the photon list recorded by the photon-counting microchannel plate detectors, and are sampled with virtual pixels of 1.5′′ size. The standard pipeline processing then calculates a sky background image for each observation, and performs source photometry with a number of options. The FUV and NUV detections are matched by the pipeline with a 3′′ radius, to produce a merged list for each observation (Morrissey et al. 2007). All pipeline products are available from the MAST archive at http://galex.stsci.edu.
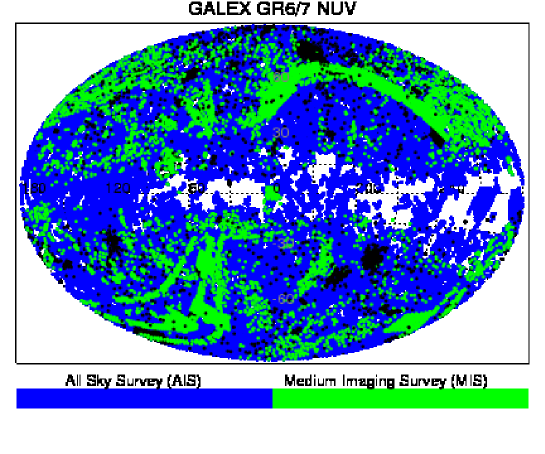
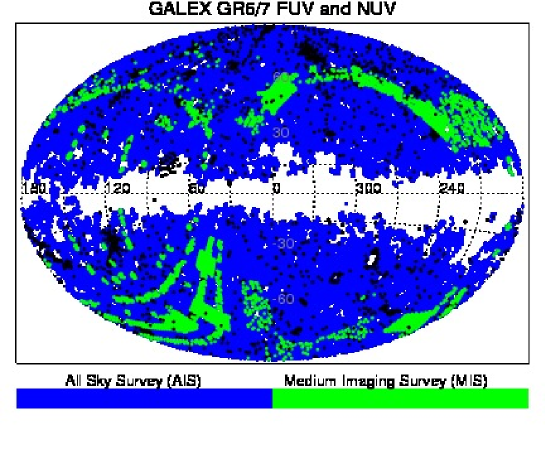
At the end of 2012, the GALEX database contains 214,449,551 source measurements. Of these, 210,691,504 are from observations with both FUV and NUV detectors on. Figure 1 shows the sky coverage of all GALEX observations performed with both detectors on (middle map) and with the NUV detector regardless of FUV status (top map). After NASA ended the GALEX mission in 2011, the observations resumed with support from private institutions for about one year, and have now ended. The last part of the GALEX mission was devoted to extending the AIS survey towards the Galactic plane, largely inaccessible during the prime mission phase because of the many bright stars that could have damaged the detector. In addition, a survey of the Magellanic Clouds (MC), previously unfeasible for the same reason (brightness limits violation), has been completed after the main mission was concluded. These extensions include only NUV measurements, as shown in Figure 1. Many of the recent MC observations are not yet in the public archive, they are presented in this book (Simons et al.).
The number of sources detected in FUV is typically a small fraction (about 10% or more) of the total NUV detections, hot stars and very blue galaxies being much rarer than “redder” objects. The relative fraction varies with magnitude, and with Galactic latitude (see also Bianchi et al. 2011a,b). For any study of statistical samples or of classes of objects, it is necessary to distinguish whether a NUV source does not have an FUV measurement in the database because its FUV flux is below detection threshold, or because the FUV detector was not turned on when that field was observed. In either case the value of the FUV magnitude in the database is “-999”. Whether the FUV detector was on can be determined by checking that the exposure time in each detector was 0, which however requires relating each source in the database to the corresponding entry of its original observation in the “photoExtract” table, using the tag “photoextractid”, and retrieving the exposure times. Therefore, additional information is needed to separate actual FUV non-detections.
In addition, the database contains repeated measurements for many sources: these are useful for serendipitous variability searches, however individual sources must be counted only once for the purpose of statistical studies.
Finally, when the depth of a field or of an entire sample must be estimated, one must keep in mind that the FUV and NUV exposure times are identical in most observations, but differ in some cases (see Table 1).
To present an overview of the UV sky as afforded by GALEX at the end of its mission, and to facilitate studies of UV-selected samples or entire classes of objects, in which the FUVNUV color is often involved (or a UVoptical color), we have constructed “clean” catalogs of sources from all GALEX observations when both detectors were exposed. We removed any duplicate observation of the same source, to obtain “unique source” catalogs, and excluded sources on the outer rim of the fields since these contain many artifacts, and photometry and astrometry are less accurate near the edge of the field.
| Survey | # fields | # fields | Tot. NUV exp. | Tot. FUV exp. | Tot. NUV exp. | |
|---|---|---|---|---|---|---|
| NUV on | FUV,NUV on | NUV on | FUV,NUV on | FUV,NUV on | ||
| Any | 43,717 | 33,858 | 39,113,488. | 21,205,228. | 29,441,882. | |
| AIS | 34,207 | 28,707 | 6,470,830. | 4,769,754. | 5,717,310. | |
| MIS | 6,489 | 3,008 | 11,790,231. | 5,295,070. | 5,999,276. |
Note: The first column (“NUV on”) counts observations when at least the NUV detector was on; the second column (“FUV,NUV on”) includes observations with both detectors on: in most of these cases FUV and NUV exposures are identical. The total exposure time is given, in seconds, in the last three columns.

3 The Final Catalogs of unique UV sources
3.1 Selection of Surveys. Sky Coverage
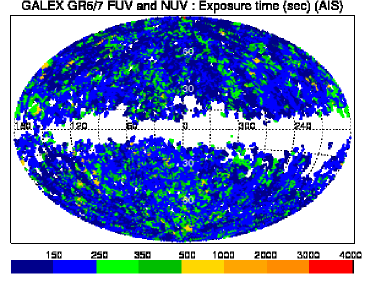
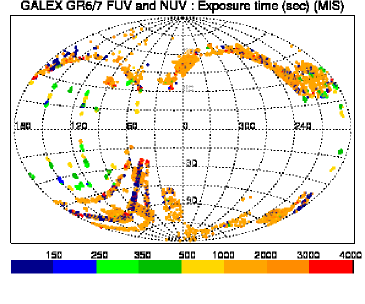
For the purpose of an overall characterization of the UV sky, and to facilitate statistical studies, we constructed homogeneous catalogs from the two GALEX surveys with the largest coverage, AIS (All-Sky Imaging Survey, depth FUV/NUV 19.9/20.8 ABmag) and MIS (Medium-depth Imaging Survey (depth 22.7 mag in both FUV and NUV). The magnitude limits given above correspond to the typical AIS and MIS exposures, which are 150 sec and 1500 sec respectively, per survey design, but for some fields the actual exposure times are shorter or longer, as shown in Figure 2. For AIS fields, the shortest exposure of an individual observation is 31 / 32 sec (FUV/NUV), and the longest is 708 / 1,133 sec (FUV /NUV); for MIS, the shortest exposure time is 39 / 55sec and the longest 15,541 / 22,220 sec for FUV/NUV. These cases are rare. The distribution of exposure times is also shown at a glance across the sky in the top panels of Figure 3.
Observations in the GALEX database from surveys other than AIS and MIS provide useful incremental coverage for other purposes but were not included in the catalogs presented here, in the interest of building two general catalogs of rather homogeneous quality. The “Nearby Galaxies Survey” (Gil de Paz et al. 2007, Bianchi et al. 2003) covered 436 fields with exposure times comparable to MIS. However, we did not include them because they specifically targeted extended galaxies, and most pipeline-defined sources are UV-bright regions in these galaxies (for which pipeline measurements are useless). These images are useful for studies of star formation across entire galaxies, but require custom photometry (e.g., Kang et al. 2009, Efremova et al. 2011, Thilker et al. 2007b, Marino et al. 2010, 2011). Observations from GI programs (1,322 fields) were not included because they have a wide range of exposures, but especially because they often targeted special objects such as star clusters, too crowded for the pipeline to reliably extract individual sources (e.g. de Martino et al. 2008).
The alternative choice of including in our catalogs all observations divided in ranges of exposure time (similar to AIS and MIS exposure ranges), in principle preferable, was therefore discarded because of the many special objects, and consequently unreliable photometric measurements, that would have been otherwise included. Our restriction to designated “AIS” and “MIS” fields minimizes such cases, but does not entirely exclude them. Although the largest and nearest galaxies were targeted in the Nearby Galaxies Survey, several extended galaxies (extended enough that the pipeline may “shred” them and ingest measurements of individual emission peaks in the database) are within the AIS and MIS footprints. When samples in wide areas are selected, these galaxies must be weeded out. The exact criteria are better adjusted to the specific science goals, therefore we did not apply any cut to the catalogs that would have introduced “holes” in the coverage. For most science applications of our catalogs, one can extract from the hyperLEDA database (http://leda.univ-lyon1.fr/) a list of extended galaxies, above certain dimensions and brightness level, and flag UV sources within the diameter of such galaxies in our catalogs, since samples may be contaminated by “shredded-galaxy” sources (e.g. Bianchi et al. 2007). If a given source of interest lies along the line of sight of an extended galaxy, the reliability of its measurements can be checked from the catalog by looking at the many tags included, such as ellipticity and size of the source, by comparing PSF-, aperture-, and isophotal-photometry (all included in our catalog, see appendix A), and ultimately by examining the source in the original image data.
Another important caveat concerns fields in or near the Magellanic Clouds, where the quality of pipeline source detection and photometry is progressively degraded towards the more crowded central fields. Carefully tuned and manually checked photometry is needed even in the periphery of these galaxies, and pipeline measurements are not reliable. A separate catalog with custom-photometry for these regions is in preparation (Thilker et al.); a partial version is presented in this book (Simons et al. 2013). For example, the pipeline may interpret two nearby sources as one extended source (see Simons et al. 2013 for an illustration of this problem). Again, we did not exclude these areas from the present catalogs constructed from pipeline measurements, to avoid introducing unnecessary (for some purposes) boundaries and holes.
The same crowding issues apply to fields including Galactic star clusters. These should also be used with caution, or better yet, excluded from statistical analyses of sources, since our catalogs are constructed from pipeline photometry for the purpose of homogeneity. These fields (when designated as MIS or AIS observations) are included in the present catalogs for completeness, but again we stress that for specific studies of crowded fields the pipeline measurements should be inspected carefully, and in many cases custom photometry is needed.
For science goals not requiring statistical samples, such as searching for specific objects (for example the counterpart of an X-ray source), one may want to inspect the whole archive, in case the objects fall in portions of GALEX fields near the rim, that have been excluded from our catalogs but may also be of some use if no better data are available. In such cases a direct search of the whole GALEX database is warranted, that will also turn up any existing repeated measurement for that source.
While our catalogs of “unique sources” facilitate all studies involving source counts, the repeated measurements available in the GALEX database for a number of sources can be used for serendipitous variability searches. A catalog of GALEX variables is presented by Conti et al. (2013), and specific searches for variables in restricted areas or with restricted criteria have been performed, see for example Welsh et al. (2006, 2007, 2011), Wheatley et al. (2012), and Gezari et al. (2013, for GALEX sources matched with Pan-STARRS variables).
3.2 Criteria for Constructing the Catalogs
The catalogs were constructed with the criteria given below, following the method of Bianchi et al. (2011a), where more details can be found, and of which the present catalogs represent the updated, expanded, and final version. We retained in the catalogs only sources:
-
1.
from observations with both FUV and NUV detectors on. This is useful for science analyses in which the fraction of sources with a given FUV-NUV color is of interest, or to estimate the fraction of sources with significant detection in both FUV and NUV over the total number of sources with NUV-only detection. More observations, taken with one of the two detectors turned off (mostly FUV), can be found in the MAST database. Including observations where one detector was not exposed would bias any statistical analysis, since the FUV magnitude of a NUV-detected source may appear as a non-detection (FUV=-999) either because the FUV detector was off, or the FUV detector was on but the FUV flux of that source was actually below detection threshold.
-
2.
within the central 0.5 degrees radius of the field-of-view (fov_radius 0.5deg.), to avoid sources with poor photometry/astrometry near the edge, and rim artifacts. This restriction makes the catalogs useful for analysis of source samples with homogeneous quality, without great loss of area coverage (considering that overlap exists between several fields). Users interested in a particular source that happens to fall on the outermost edge of a GALEX field should obtain the measurements from the main database and carefully examine the quality.
-
3.
with NUV magnitude errors 0.5mag; this means all NUV detections are retained, regardless of detection in the FUV filter; see Figures 3, 4, and 5, and Table 2 for coverage. The effect of error cuts on the resulting samples can be seen also from Figure 4 of Bianchi et al. 2011a, and Figures 24 of Bianchi et al. 2011b.
Removing Duplicate Measurements. The general GALEX database in the MAST archive contains all existing measurements. For sources with repeated observations (e.g. where different fields overlap, or the same field was repeated), we removed duplicate measurements as follows, to produce a unique source catalog. GALEX sources within 2.5′′ of each other, but from different observations, were considered duplicates. In such cases the object from the observation with the longest exposure time was retained, and - in cases of equal exposure times - the object closest to the center of the field in its parent image.
The GALEX pipeline source detections uses a 3′′ radius to match FUV sources to the NUV sources of the same observation. Our choice of a slightly smaller radius is based on initial tests for the early version of these catalogs (Bianchi et al. 2011a), as a good compromise between not excluding real sources and not retaining duplicate measurements. GALEX astrometry is usually more accurate than 2.5′′ but the deblending of sources closer than this separation is not always robust due to the resolution.
3.3 Area Coverage of the Catalogs
For any study involving density of sources in the sky (number per unit area), the exact area coverage of the catalog must be known. As we removed duplicate measurements of the same source, we must also calculate the area covered by the surveys accounting for overlaps, as well as for possible gaps, between fields. These may occur because of the tiling strategy, or because the actual pointing of an observation may be slightly off from the planned position, and also because we limited our catalogs to sources within the central 1∘ diameter of the GALEX field.
We calculated the total area with the method of Bianchi et al. (2011a): we divided the sky in small tesserae, and added the areas of all tesserae which fall within 0.5∘ of every field center, checking that each tessera is counted only once. We obtain a total area of 22,080 square degrees for the AIS catalog, and of 2,253 square degree for the MIS catalog. Since we have restricted the catalogs to the inner 0.5∘ radius of each field, these areas imply that the remaining overlap among MIS fields is about 5%, and 2% for AIS. Had we not reduced the radius to 0.5∘, a larger area (by about 20% for MIS) would be gained, but many artifacts and bad measurements would have been included.
We found 3 fields in the MIS survey where both FUV and NUV detectors were exposed, but some issue caused NUV and FUV detections to not match, i.e. there are a number of sources with NUV measurements, all showing no FUV detection (FUV=-999), and viceversa all FUV sources have NUV=-999. These are MIS fields with photoextractid = 2462169510929498112, 6401235888134684672 and 3719131203803021312. When we exclude them, the total MIS area becomes 2,251 square degrees. The same problem was found for AIS fields with photoextractid = 6379923033125027840, 6381259965176217600, 6379711852804308992, 6372041728408420352 and 6379571150749433856.
Because both gaps and overlaps between fields exist, the actual area coverage must be computed for each region of the sky where one desires to extract a sample, if the density of sources has to be estimated. Tables will be posted on the author’s web site http://dolomiti.pha.jhu.edu/uvsky to facilitate area calculations of custom-chosen regions.
3.4 Content and Structure of the Catalog
2 gives the number of sources included in each catalog, both total and with various selections.
An overall view of the density of UV sources and their characteristics across the sky is shown in Figures 3 (bottom) and 4. Figure 5 shows the distribution of magnitude and color of the UV sources. These are discussed in the next section.
The catalogs (one for AIS, one for MIS) contain several tags for every source, including position (R.A., Dec., Galactic l,b), photometry measurements in FUV and NUV and their errors (“nuv_mag” and “fuv_mag” are the “best” measurements as chosen by the pipeline, and preferable in most cases; other measurements are also included, such as PSF photometry, aperture photometry with different apertures, and Kron-like elliptical aperture magnitudes), and parameters useful to retrieve the original image from which the photometry was extracted (tag photoextractid), as well as artifact flags and extraction flags that can be used to eliminate spurious sources. The complete list of tags and their description is given in Appendix A.
The catalogs can be downloaded from the author’s web site:
http://dolomiti.pha.jhu.edu/uvsky , and will be also available from the MAST web site,
and from the SIMBAD (Vizier) database,
which allows VO-type queries including cross-correlation with other catalogs in the
same database.
An early version of similar catalogs (with less data coverage and fewer parameters) is
VO-accessible with Vizier at:
http://vizier.u-strasbg.fr/viz-bin/VizieR-3?-source=II/312 , and from MAST at:
http://archive.stsci.edu/prepds/bianchi_gr5xdr7/ .
| Survey | # sources with error 0.5mag | # sources with error 0.3mag | # with error 0.3mag |
|---|---|---|---|
| in NUV / in FUV & NUV | in NUV / in FUV & NUV | FUV-NUV-0.1 / 0 | |
| AIS | 70,926,176 / 7,016,318 | 22,518,082 / 2,450,425 | 356,999 / 482,043 |
| MIS | 16,613,047 / 3,986,646 | 6,552,960 / 2,053,537 | 135,320 / 202,875 |
Note: The first number in columns 1 and 2 (“in NUV”) is the total number of sources detected in NUV, regardless of FUV detection; the second number in columns 1 and 2, and the numbers in column 3, are source counts when the error cut is applied to both FUV and NUV measurements. The last columns give source counts also with a FUV-NUV cut.
3.5 Bright Object Limits
We recall here that UV sources with a high countrate cause non-linearity to set in, beginning with a 10% rolloff at 109 counts s-1 for FUV and 311 counts s-1 for NUV. These countrates correspond to FUV=13.73 ABmag (1.53 e-13 erg s-1 cm-2 Å-1) and NUV=13.85 (6.41 e-14 erg s-1 cm-2 Å-1). A correction for non-linearity is applicable over a limited range, as shown by Morrissey et al.(2007; their figure 8), after which the measured countrates saturate and the true source flux is no longer recoverable. The bright-object limit during the major part of the mission was 30,000 counts s-1 per source, corresponding to 9thmag for NUV (7 e-12 erg s-1 cm-2 Å-1) and 5,000 counts s-1 per source in FUV ( 9.6 ABmag, 6 e-12 erg s-1 cm-2 Å-1). GALEX tiles were positioned avoiding stars brighter than the above limits in the field of view; in many regions near the Galactic plane bright stars are numerous, making it impossible to find a location as large as the GALEX field of view in between too-bright sources, and causing the known gaps in coverage during the main mission phase, when the FUV detector was working.
4 Discussion. The UV sky.

4.1 Completeness and General Considerations.
In any analysis of astrophysical samples we must be concerned with the completeness of the catalog, and aware of possible biases. We kept the two catalogs, MIS and AIS, separate because of the 2 mag difference in depth. When density of sources (counts per unit area) is compared among fields, for example as a function of Galactic latitude and longitude, it is useful to have a sample with roughly consistent magnitude limits. Note, however, that the magnitude limit reached for a typical AIS observation (with equal exposure time in both detectors) differs between FUV and NUV by about 1 mag (Section 3.1), because of the instrument sensitivity; instead, an equal magnitude limit in both detectors is reached at MIS depth, for equal exposures, because the sky background is darker in FUV than in NUV (see Bianchi 2011 for more details). Therefore, for example, a sample with FUV-NUV=0 will be limited by the FUV-magnitude completeness at AIS depth, but a sample with FUV-NUV=-1 would extend in FUV to the same depth as in NUV, one magnitude fainter. Instead, at MIS depth, sources with FUV-NUV=0 have the same magnitude limit in FUV and NUV, but for “bluer” (negative FUV-NUV) sources the completeness limit is set by the NUV magnitude limit, and viceversa, for redder sources, by the FUV limit. It is important to take into account these limits, since different types of sources have different magnitude and color distributions, as discussed below.
4.2 Density and Distribution of the UV Sources. Dust Extinction
The catalogs contain sources of various nature: stars, reflecting the density of the Milky Way’s stellar populations (thin disk, thick disk, halo) with their different age and relative content of hot stars, and different geometry (spatial distribution); QSOs whose UV colors (and UVoptical colors) depend on redshift and intensity of emission lines (e.g. Bianchi et al. 2009); galaxies whose relative UV-to-total flux depends on galaxy type, star-formation rate, age of the populations, metallicity, inclination (see e.g. Figures 5 and 6 of Bianchi 2011; Marino et al. 2013, 2011), as well as on redshift.
In addition to the intrinsic distributions, UV counts of both Galactic and extragalactic objects are modulated by the foreground extinction from the Milky Way dust, which is severe near the Galactic plane (e.g. Figure 2 of Bianchi et al. 2011a). UV measurements are very sensitive to extinction, since the selective extinction Aλ/ increases steeply at short wavelengths. Therefore, high reddening makes observed UV fluxes much fainter than their instrinsic values, effectively limiting the detections and source counts to brighter intrinsic magnitudes. However, while both GALEX FUV and NUV passbands have higher Aλ/ than optical and IR bands, for a Milky-Way type extinction curve with =3.1 the extinction coefficients of the two UV bands are very similar, making the FUV-NUV color almost reddening-free. This is due to the 2175Å extinction feature being included in the very broad NUV bandpass (see Bianchi 2011 for more details). Therefore, a selection of objects (e.g. hot stars) by FUV-NUV color is very robust, and almost unaffected by reddening (as long as the selective extinction is Milky Way typical). Of course, this is not the case for a UVoptical color. For example, for a Milky Way-type extinction curve with 3.1, AFUV/ = 8.06 and ANUV/ = 7.95, hence E(FUV-NUV)/= 0.11, while for example /0.70. However, in lines of sight where the extinction curve is steeper, such as found in star-forming sites, E(FUV-NUV)/ can be up to a few magnitudes. By consequence, assumptions on the type of selective extinction bear severely on the results derived from UV magnitudes. Coefficients for extinction correction of GALEX magnitudes, AFUV/ and ANUV/, for different dust assumptions, can be found in Table 2 of Bianchi 2011.
The relative fraction of Galactic stars over extragalactic objects decreases steeply towards fainter magnitudes. It is approximately equal at AIS depth (Bianchi et al. 2007) although in more detail the Galactic hot-star counts strongly depend on the Galactic structure, their observed density varying with latitude by a factor of 7 even before extinction effects are accounted for (Bianchi et al. 2011a).
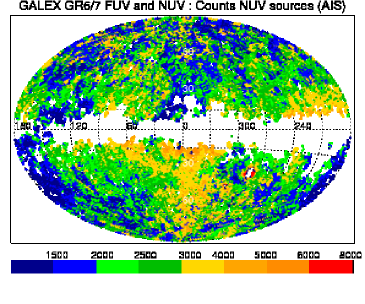
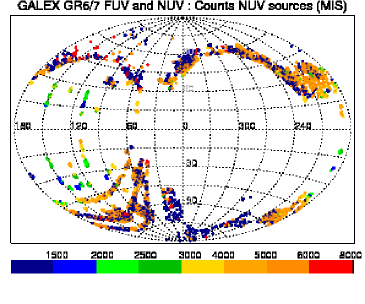
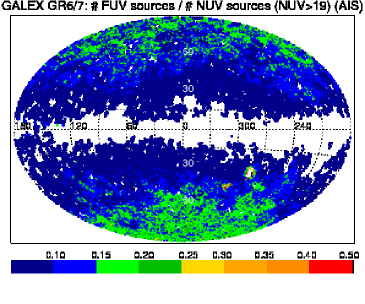
The panels in the second row of Figure 3 and in Figure 4 show the density of sources detected in NUV, and the fraction of FUV detections over NUV detections, in each field location.
The source counts shown in the figures are estimated within a circle of 0.5∘ radius around each field center. To obtain density per unit area, they can be re-scaled to an area of one square degree ( 1.27324). The NUV-source counts (Figure 3) reflect the effects of foreground extinction and intrinsic source distribution. The intrinsic distribution of extragalactic sources is independent of sight-line, but their number is strongly increasing towards fainter magnitudes. Star density increases from the halo to the thick disk and to the thin disk, with a marked dependence mainly on Galactic latitude. Yet we see in the source-density maps (Figure 3) strong variations with both latitude and longitude. This reflects the exinction by Milky Way dust. In fact, there is a remarkable correspondence between this map (density of UV sources) and the Milky Way dust maps, such as those produced by the Planck satellite (e.g. Abergel et al. 2011): the observed density of UV sources is largely anti-correlated with the major dust emission structures, showing the sensitivity of UV fluxes to extinction. Some small-scale, patchy inhomogeneities in the counts, e.g. at North Galactic latitudes, are due to longer-than-average exposure times as can be seen in the top panels. This is also the cause for counts enhancement towards the South Galactic pole at longitude 0. When we restrict these plots to observations with more homogeneous exposure times, between 150 and 250 sec for the AIS catalog, and between 1500 and 2500 sec for the MIS catalog, some features such as the overdensity at the South Galactic pole are eliminated. Comparison between the top-row and second-row panels of Figure 3 shows where the overdensities of counts are due to longer exposure times. Other features are largely due to extinction.
4.3 Characteristics of the UV Sources
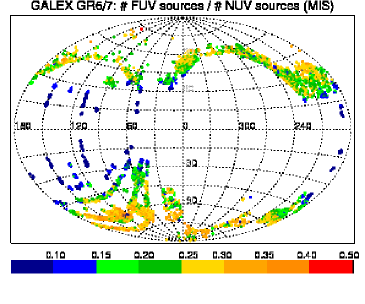
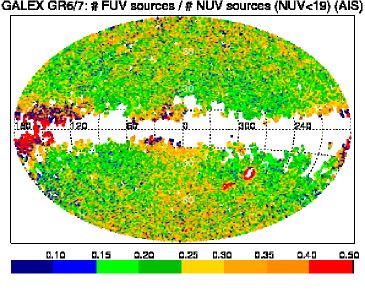
The fraction of FUV detections over NUV detections, i.e. NUV-detected sources that also have a significant FUV measurement, shown in the middle panels of Figure 4, increases towards the Galactic poles, where extinction is less and therefore fainter magnitudes are reached in both filters. In more detail, this trend strongly depends on the magnitude range considered (e.g. Bianchi et al. 2011b). Hot stars are intrinsically more numerous towards the Milky Way disk, but they are rare. Fainter magnitudes include a higher fraction of extragalactic sources. This effect is illustrated in the bottom panels of Figure 4, showing the fraction of FUV detections over NUV detections for sources brighter, and fainter, than NUV=19mag.
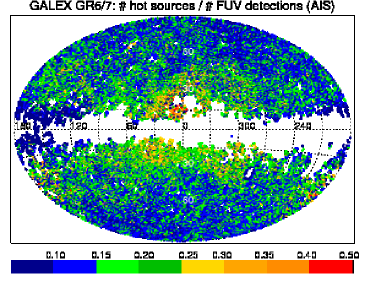
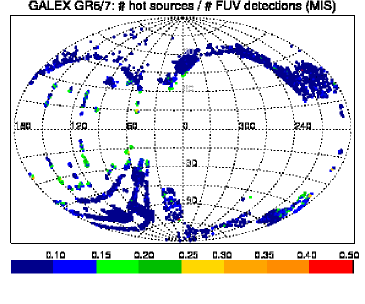
The fraction of “hot” sources (FUV-NUV-0.1, which corresponds e.g. to stars with 18,000K, the exact limit depending on gravity, metallicity, and model assumptions) is shown in the top panels of Figure 4. It is the result of the combined effect of extinction, actual number of hot stars (both increasing towards low latitudes but having opposite effects on the counts), and the relative fraction of extragalactic objects again being different at different magnitudes, although extragalactic objects mostly have FUV-NUV 0 (Bianchi 2011). As we mentioned previously, the FUV-NUV color is almost reddening-free (for average Milky Way dust type). Therefore, reddening has not a big effect on the source selection by color, but it limits the source counts, having a large effect on each UV magnitude. By showing the ratio between sources with negative FUV-NUV and total number of FUV sources, we minimize the influence of count reduction by reddening on the resulting picture (except for the variation of the ratio Galactic/extragalactic sources at different limiting magnitudes).
The difference between the behaviour of Galactic versus extragalactic samples can be appreciated qualitatively by comparing the maps for AIS and MIS (left and right panels respectively in Figures 3 and 4, and bottom panels of 4), the latter being two magnitudes deeper (NUV) and therefore having a much higher fraction of galaxies and QSOs. This explains why the relative number of MIS objects with negative FUV-NUV is much lower than in the AIS sample, where stars are a substantial fraction.
We saw that our catalogs do not have precisely homogeneous exposure times (section 3.1). When we restrict the plots to data with homogeneous exposures, the resulting maps have less uniform coverage (some gaps are introduced), but the overall distribution is very similar to the maps shown, which include all data; deviations concerning individual fields do not stand out in the general trends when the whole sky is presented at a glance.
Finally, to separate the sources into classes of astrophysical objects, more colors are needed, as was shown for example by Bianchi (2009) and Bianchi et al. (2007, 2011a) on earlier, smaller samples matched to optical data (see next Section). The maps in Figures 3 and 4 show for the first time a complete and unbiased view of the UV source distribution, without biases and limits of the optical matches.
5 Matched catalog of UV sources with optical surveys


In order to select samples of objects by astrophysical class with high purity, i.e. minimizing contamination from other types of objects, and to perform a detailed analysis and characterization of their physical parameters, it is useful to match the UV catalogs with databases at longer wavelengths. In most previous works, GALEX catalogs have been analyzed together with Sloan-Digital-Sky-Survey (SDSS) data, the widest optical survey easily available since the beginning of the GALEX mission. The latter provides 5 optical magnitudes (u g r i z) which are a useful addition to the GALEX FUV and NUV bands, as well as spectra for a subsample of the sources. The spectra are useful to validate the photometrically-derived parameters, which are available for the larger photometric sample, and the object selection, although the spectroscopic sample is serendipitous but not unbiased. Examples are shown e.g. in Bianchi et al. (2011a, 2009, 2007), Treyer et al. (2007), among others.
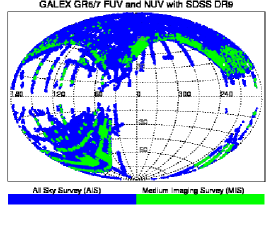
For science applications concerning Milky Way stellar populations, and the distribution of UV sources across the sky, the overlap between the SDSS and GALEX footprints provides insufficient coverage in l,b to disentangle the effects of Galactic structure of dust and stellar populations, as seen in the bottom-left panel of Figure 1. For this panel, the overlap of our GALEX catalogs with SDSS data release 9 (DR9) has been estimated by matching the locations of our GALEX fields to the SDSS source catalog: those positions where counts of SDSS sources are not zero are deemed to be inside the SDSS footprint. This is necessary because the SDSS footprint-query tool is currently not working for DR9, and because for previous releases we noted that such footprint queries may give both false-positive and false-negative results (see Bianchi et al. 2011a). The depth of the SDSS data matches well the AIS catalog, while in the GALEX MIS catalog the hottest stars, even with very small radii, are detected all the way out to the Galactic halo, in sight-lines of low reddening, but these sources are too faint for the SDSS limits (Bianchi et al. 2011a).
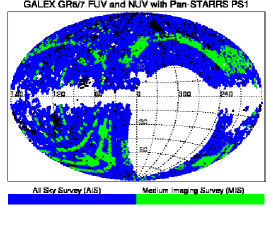
An important improvement in coverage, and a slight improvement in depth, in terms of optical matches, is afforded by the Pan-STARRS PS1 survey. Pan-STARRS’s PS1 “3 survey” provides g r i z y measurements, about a half a magnitude deeper than SDSS over a region of the sky several times larger (Fig. 1, bottom-right panel). Matched UV-optical catalogs with the 3 survey will enable for example a conclusive census, and analysis, of Milky Way hot WDs, extricating effects of stellar evolution from geometry of the stellar populations and dust distribution in the Milky Way, ultimately constraining some still obscure stages of stellar evolution. We plan to provide these catalogs after the 3 survey is completed.
GSC-II provides some optical magnitudes over the whole sky; its nominal depth matches that of the GALEX AIS (the survey with the widest sky coverage), but in practice its completeness is limited to brighter magnitudes and is not homogeneous (Bianchi et al. 2011b). It is therefore of little use for statistical studies. Yet, it provides to date the only way to explore the distribution of UV-optical sources over any direction in the sky, albeit limited to very bright objects, possibly supporting and complementing studies of local WD samples (for which proper motions and parallax are also available), and providing selection of nearby bright objects accessible for spectroscopy, outside the Pan-STARRS and SDSS coverage.
We are preparing matched-source catalogs correlating the final GALEX AIS and MIS catalogs presented here with SDSS-DR9, GSC-II and Pan-STARRS 3 surveys; these will made available from the same web sites as our GALEX catalogs. They will also include corollary data such as proper motions and parallaxes when available.
6 Summary
After eight years of GALEX observations, we have presented here a global view of the UV sources across the sky derived from the GALEX surveys. We constructed distilled catalogs of UV sources from the two major surveys, AIS containing 71million sources over 22,000 square degrees down to 20/21mag (FUV/NUV), and MIS with 16.6million sources over 2,250 square degrees with a depth of 22.7mag. The catalogs presented here contain “unique sources”: duplicate measurements of the same object have been eliminated, which greatly facilitates all statistical studies where source counts of given classes of objects are needed. The present version of the catalogs is limited to observations where both FUV and NUV detectors were exposed, so that any sample selections by UV color will be unbiased. We have shown the significant effect of the Milky Way dust on the UV source counts, and global features such as the increase of hot stars from the halo towards the Milky Way disk, with a clear dependence on Galactic latitude but also with local structures. Distributions of UV magnitudes and FUV-NUV color show that hot stars, cooler stars, and extragalctic sources (QSOs and galaxies) contribute to different extents in different regimes.
Acknowledgements: We express our gratitude and appreciation to the GALEX “Operation and Data Analysis Team”, who processed and delivered the extremely high data volume yielded by GALEX, and to the MAST archive team for making the GALEX data products available in a variety of formats, with convenient browsing tools. We are grateful to Ani Thakar who kindly helped us to diagnose issues in the SDSS footprint queries, which cannot be used.
References
- Abergel et al. (2011) Abergel, A., Ade, P. A. R.; Aghanim, N., et al. (Planck Collaboration) 2011. Planck early results. XXIV. Dust in the diffuse interstellar medium and the Galactic halo. Astronomy & Astrophysics, 536, A24:24-53.
- Bianchi (2012) Bianchi, L. 2012. New Advances in the Field of Planetary Nebulae from Ultraviolet Observations. in “Planetary Nebulae: An Eye to the Future”, editors A. Manchado, L. Stanghellini and D. Sch nberner, Cambridge University Press, IAU Symposium N. 283, p.45:45-52 .
- Bianchi (2011) Bianchi, L. 2011. GALEX and star formation. Astrophysics & Space Science, 335, 51:51-60, DOI: 10.1007/s10509-011-0612-2.
- Bianchi (2009) Bianchi, L. 2009. The Ultraviolet Sky Surveys: Filling the Gap in our View of the Universe. Astrophysics & Space Science, 320, 11:11-19.
- Bianchi et al. (2011a) Bianchi, L. , Efremova, B., Herald, J., et al. 2011a. Catalogs of Hot White Dwarfs in the Milky Way from GALEX’s Ultraviolet Sky Surveys. Constraining stellar evolution. Monthly Notices of the Royal Astronomical Society, 411, 2770:2770-2791.
- Bianchi et al. (2011b) Bianchi, L., Herald, J., Efremova, B, et al. 2011b. GALEX Catalogs of UV sources: Statistical properties and sample science applications: Hot White Dwarfs in the Milky Way. Astrophysics & Space Science, 335, 161:161-169, DOI: 10.1007/s10509-010-0581-x.
- Bianchi et al. (2009) Bianchi, L., Hutchings, J.B., Efremova, B., et al. 2009. Ultraviolet Quasi Stellar Objects. Astronomical Journal, 137, 3761:3761-3777.
- Bianchi (2007) Bianchi, L. 2007. High Mass Stars: Stellar Populations. in “UV Astronomy: Stars from Birth to Death”, editors. A. Gomez de Castro & M. Barstow, Editorial Complutense (Madrid) 2007, ISBN 978-84-7491-852-6, p. 65:65-76
- Bianchi et al. (2007) Bianchi, L., Rodriguez-Merino, L., Viton, M., et al. 2007. Statistical Properties of the GALEX/SDSS Matched Source Catalogs, and Classification of the UV Sources. Astrophysical Journal Supplements, 173, 659:659-672.
- Bianchi et al. (2003) Bianchi, L., Madore, B., Thilker, D., et al. 2003. The GALEX Nearby Galaxies Survey (NGS). in “The Local Group as an Astrophysical Laboratory”, STScI electronic publication Series (Baltimore), M. Livio & T. Brown eds., p.10:10-15.
- Conti et al. (2013) Conti, A., Bianchi, L., Chopra, N., et al. 2013. A database of UV Variables from the GALEX survey. This publication, DOI: http://dx.doi.org/10.1016/j.asr.2013.07.022
- de Martino et al. (2008) de Martino, C., Bianchi, L., Pagano, I., et al. 2008. GALEX Ultraviolet Photometry of NGC2420: searching for WDs. Memorie della SOcietá Astronomica Italiana, Vol. 79, p. 704:704-706 (arXiv:0712.0755)
- Efremova et al. (2011) Efremova, B., Bianchi, L., Thilker, D., et al. 2011. The Recent Star Formation in NGC6822: a UV study. Astrophysical Journal, 730, 88:88-103.
- Gezari et al. (2013) Gezari, S., Martin, D. C., Forster, K., et al. 2013. The GALEX Time Domain Survey I. Selection and Classification of Over a Thousand UV Variable Sources. Astrophysical Journal, 766, 60:60-73.
- Gil de Paz et al. (2007) Gil de Paz, A., Boissier, S., Madore, B., et al. 2007. The GALEX Ultraviolet Atlas of Nearby Galaxies. Astrophysical Journal Supplements, 173, 185:185-255.
- Hutchings et al. (2010) Hutchings, J.B., & Bianchi, L. 2010. A Catalog of 19000 QSO Candidates with redshift 0.5 to 1.5 Astronomical Journal, 140, 1987:1987-1994.
- Kang et al. (2009) Kang, Y.-B., Bianchi, L., Rey, S.-C. 2009. An Ultraviolet Study of Star-Forming Regions in M31. Astrophysical Journal, 703, 614:614-627.
- Marino et al. (2013) Marino, A., Rampazzo, R., Mazzei, P., et al. 2013. Galaxy Evolution in Groups. USGC U268 and USGC U376 in the Leo cloud. submitted to this publication.
- Marino et al. (2011) Marino, A., Bianchi, L., Rampazzo, R., et al. 2011, Signatures of recent star formation in nearby S0 galaxies. Astrophysics and Space Science, 2011, 335, 243:243-248.
- Marino et al. (2010) Marino, A., Bianchi, L., Rampazzo, R., et al. 2010. Galaxy Evolution in Local group Analogs. I. A GALEX study of nearby groups dominated by late-type galaxies. Astronomy & Astrophysics, 511, 29:29-46.
- Martin et al. (2005) Martin, D. C., Fanson, J., Schiminovich, D. et al. 2005. The Galaxy Evolution Explorer: A Space Ultraviolet Survey Mission. Astrophysical Journal Letters, 619, L1-6.
- Martin et al. (2007) Martin, D. C., Small, T., Schiminovich, D., et al. 2007. The Star Formation and Extinction Coevolution of UV-Selected Galaxies over 0.05 z 1.2. Astrophysical Journal Supplements, 173, 415:415-431.
- Morrissey et al. (2007) Morrissey, P., Conrow, T., Barlow, T., et al. The On-orbit Performance of the Galaxy Evolution Explorer. Astrophysical Journal Supplements, 173, 682:682-697. 2007
- Sahai et al. (2008) Sahai, R., Findeisen, K., Gil de Paz, A., S nchez Contreras, C. 2008. Binarity in Cool Asymptotic Giant Branch Stars: A GALEX Search for Ultraviolet Excesses. Astrophysical Journal, 689, 1274:1274-1278.
- Schlegel et al. (1998) Schlegel, D. J., Finkbeiner, D. P., & Davis, M. 1998. Maps of Dust Infrared Emission for Use in Estimation of Reddening and Cosmic Microwave Background Radiation Foregrounds. Astrophysical Journal, 500, 525:525-553.
- Simons et al. (2013) Simons, R., Thilker, D., & Bianchi, L., et al. 2013. The Ultraviolet View of the Magellanic Clouds from GALEX: A First Look at the LMC Source Catalog. This publication (DOI: http://dx.doi.org/10.1016/j.asr.2013.07.016)
- Treyer et al. (2007) Treyer, M., Shiminovich, D., Johnson, B. et al. 2007. Extinction Corrected Star Formation Rates Empirically Derived from Ultraviolet-optical colors. Astrophysical Journal Supplements, 173, 256:256-266.
- Thilker et al. (2007a) Thilker, D., Bianchi, L., Meurer, G. et al. 2007a. A Search for Extended Ultraviolet Disk galaxies in the Local Universe. Astrophysical Journal Supplements, 173, 538:538-571.
- Thilker et al. (2007b) Thilker, D., Boissier, S., Bianchi, L., et al. 2007b. GALEX and SPITZER Observations of Young Stellar Complexes, Star Forming Regions and Dust in NGC7331. Astrophysical Journal Supplements, 173, 572:572-596.
- Wheatley et al. (2012) Wheatley, J. Welsh, B. Y., Browne, S. E. 2012. RR Lyrae Variables in the Ultraviolet: The View from GALEX. PASP, 124, 552:552-558.
- Welsh et al. (2006) Welsh, B. Y., Wheatley, J., Browne, S. E., et al. 2006. GALEX high time-resolution ultraviolet observations of dMe flare event. Astronomy & Astrophysics, 458, 921:921-930.
- Welsh et al. (2007) Welsh, B. Y., Weathley, J., Seibert, M., et al. 2007. The Detection of M Dwarf UV Flare Events in the GALEX Data Archives. Astrophysical Journal Supplements, 173, 673:673-681.
- Welsh et al. (2011) Welsh, B. Y., Wheatley, J. M., & Neil, J. D. 2011. GALEX observations of quasar variability in the ultraviolet. Astronomy & Astrophysics, 527, 15:15-26.
- Wyder, T. et al. (2009) Wyder, T., Martin, C., Barlow, T., et al. 2009. The Star Formation Law at Low Surface Density. ApJ, 696, 1834:1834-1853.
Appendix A Description of The Catalogs’ Columns
Below we list the tags included in the online catalogs presented in this paper, and available at http://dolomiti.pha.jhu.edu (as well as from MAST and SIMBAD in the future). The columns of greatest interest in most cases are in bold in the Table below. Catalogs with reduced size, including only tags listed in bold-face, are posted on the web site for quick download.
| Tag | Description |
|---|---|
| photoextractid | Pointer to photoExtract Table (identifier of original observation) |
| mpstype | which survey (e.g, ”MIS”) |
| avaspra | R.A. of center of field where object was measured |
| avaspdec | Decl. of center of field where object was measured |
| objid | GALEX identifier for the source |
| ra | source’s Right Ascension (degrees). |
| dec | source’s Declination (degrees) |
| glon | source’s Galactic longitude (degrees) |
| glat | source’s Galactic latitude (degrees) |
| tilenum | “tile” number |
| img | image number (exposure # for _visits) |
| subvisit | number of subvisit if exposure was divided |
| fov_radius | distance of source from center of the field in which it was measured |
| type | Obs.type (0=single,1=multi) |
| band | Band number (1=nuv,2=fuv,3=both) |
| e_bv | E(B-V) Galactic Reddening (from Schlegel et al. 1998 maps) |
| istherespectrum | Does this object have a (GALEX) spectrum? Yes (1), No (0) |
| chkobj_type | Astrometry check type |
| fuv_mag | FUV calibrated magnitude |
| fuv_magerr | FUV calibrated magnitude error |
| nuv_mag | NUV calibrated magnitude |
| nuv_magerr | FUV calibrated magnitude error |
| fuv_mag_auto | FUV Kron-like elliptical aperture magnitude |
| fuv_magerr_auto | FUV RMS error for AUTO magnitude |
| nuv_mag_auto | NUV Kron-like elliptical aperture magnitude |
| nuv_magerr_auto | NUV RMS error for AUTO magnitude |
| fuv_mag_aper_4 | FUV Magnitude aperture ( 8 pxl ) |
| fuv_magerr_aper_4 | FUV Magnitude aperture error ( 8 pxl ) |
| nuv_mag_aper_4 | NUV Magnitude aperture ( 8 pxl ) |
| nuv_magerr_aper_4 | NUV Magnitude aperture ( 8 pxl ) error |
| fuv_mag_aper_6 | FUV Magnitude aperture ( 17 pxl ) |
| fuv_magerr_aper_6 | FUV Magnitude aperture ( 17 pxl ) error |
| nuv_mag_aper_6 | NUV Magnitude aperture ( 17 pxl ) |
| nuv_magerr_aper_6 | NUV Magnitude aperture ( 17 pxl ) error |
| fuv_artifact | FUV artifact flag (logical OR near source) |
| nuv_artifact | NUV artifact flag (logical OR near source) |
| fuv_flags | Extraction flags |
| nuv_flags | Extraction flags |
| fuv_flux | FUV calibrated flux (micro Jansky) |
| fuv_fluxerr | FUV calibrated flux (micro Jansky) error |
| nuv_flux | NUV calibrated flux (micro Jansky) |
| nuv_fluxerr | NUV calibrated flux (micro Jansky) error |
| fuv_x_image | Object position along x |
| fuv_y_image | Object position along y |
| nuv_x_image | Object position along x |
| nuv_y_image | Object position along y |
| fuv_fwhm_image | FUV FWHM assuming a gaussian core |
| nuv_fwhm_image | NUV FWHM assuming a gaussian core |
| fuv_fwhm_world | FUV FWHM assuming a gaussian core (WORLD units) |
| nuv_fwhm_world | NUV FWHM assuming a gaussian core (WORLD units) |
| nuv_class_star | S/G classifier output |
| fuv_class_star | S/G classifier output |
| nuv_ellipticity | 1 - B_IMAGE/A_IMAGE |
| fuv_ellipticity | 1 - B_IMAGE/A_IMAGE |
| nuv_theta_J2000 | Position angle (east of north) (J2000) |
| nuv_errtheta_J2000 | Position angle error (east of north) (J2000) |
| fuv_theta_J2000 | Position angle (east of north) (J2000) |
| fuv_errtheta_J2000 | Position angle error (east of north) (J2000) |
| fuv_ncat_fwhm_image | FUV FWHM_IMAGE value from -fd-ncat.fits (px) |
| fuv_ncat_flux_radius_3 | FUV FLUX_RADIUS #3 (-fd-ncat)(px)[0.80] |
| nuv_kron_radius | Kron apertures in units of A or B |
| nuv_a_world | Profile RMS along major axis (world units) |
| fuv_kron_radius | Kron apertures in units of A or B |
| fuv_b_world | Profile RMS along major axis (world units) |