050004 \journalyear2013 \editorG. Mindlin 050004
Realistic mathematical modeling of voice production has been recently boosted by applications to different fields like bioprosthetics, quality speech synthesis and pathological diagnosis. In this work, we revisit a two-mass model of the vocal folds that includes accurate fluid mechanics for the air passage through the folds and nonlinear properties of the tissue. We present the bifurcation diagram for such a system, focusing on the dynamical properties of two regimes of interest: the onset of oscillations and the normal phonation regime. We also show theoretical support to the nonlinear nature of the elastic properties of the folds tissue by comparing theoretical isofrequency curves with reported experimental data.
Revisiting the two-mass model of the vocal folds
99 \institutioninst1 Laboratorio de Sistemas Dinámicos, Depto. de Física, FCEN, Universidad de Buenos Aires. Pabellón I, Ciudad Universitaria, 1428EGA Buenos Aires, Argentina.
1 Introduction
In the last decades, a lot of effort was devoted to develop a mathematical model for voice production. The first steps were made by Ishizaka and Flanagan [1], approximating each vocal fold by two coupled oscillators, which provide the basis of the well known two-mass model. This simple model reproduces many essential features of the voice production, like the onset of self sustained oscillation of the folds and the shape of the glottal pulses.
Early analytical treatments were restricted to small amplitude oscillations, allowing a dimensional reduction of the problem. In particular, a two dimensional approximation known as the flapping model was widely adopted by the scientific community, based on the assumption of a transversal wave propagating along the vocal folds [2, 3]. Moreover, this model was also used to successfully explain most of the features present in birdsong [4, 5].
Faithful modeling of the vocal folds has recently found new challenges: realistic articulatory speech synthesis [6, 7, 8], diagnosis of pathological behavior of the folds [9, 10] and bioprosthetic applications [11]. Within this framework, the 4-dimensional two-mass model was revisited and modified. Two main improvements are worth noting: a realistic description of the vocal fold collision [13, 14] and an accurate fluid mechanical description of the glottal flow, allowing a proper treatment of the hydrodynamical force acting on the folds [15, 8].
In this work, we revisit the two-mass model developed by Lucero and Koenig [7]. This choice represents a good compromise between mathematical simplicity and diversity of physical phenomena acting on the vocal folds, including the main mechanical and fluid effects that are partially found in other models [15, 13]. It was also successfully used to reproduce experimental temporal patterns of glottal airflow. Here, we extend the analytical study of this system: we present a bifurcation diagram, explore the dynamical aspects of the oscillations at the onset and normal phonation and study the isofrequency curves of the model.
This work is organized as follows: in the second section, we describe the model. In the third section, we present the bifurcation diagram, compare our solutions with those of the flapping model approximation and analyze the isofrecuency curves. In the fourth and last section, we discuss our results.
2 The model
Each vocal fold is modeled as two coupled damped oscillators, as sketched in Fig. 1.
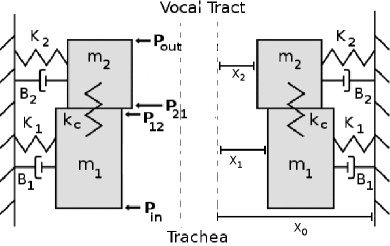
Assuming symmetry with respect to the saggital plane, the left and right mass systems are identical (Fig. 1) and the equation of motion for each mass reads
| (1) | ||||
for or 2 for lower and upper masses, respectively. and represent the restitution and damping of the folds tissue, the hydrodynamic force, is the mass and the coupling stiffness. The horizontal displacement from the rest position is represented by .
We use a cubic polynomial for the restitution term [Eq. (2)], adapted from [1, 7]. The term with a derivable step-like function [Eq. (5)] accounts for the increase in the stiffness introduced by the collision of the folds. The restitution force reads
| (2) | ||||
with
| (5) |
where is the rest position of the folds.
For the damping force, we have adapted the expression proposed in [7], making it derivable, arriving at the following equation:
| (6) | ||||
where , and is the damping ratio.
In order to describe the hydrodynamic force that the airflow exerts on the vocal folds, we have adopted the standard assumption of small inertia of the glottal air column and the model of the boundary layer developed in [7, 11, 15]. This model assumes a one-dimensional, quasi-steady incompressible airflow from the trachea to a separation point. At this point, the flow separates from the tissue surface to form a free jet where the turbulence dissipates the airflow energy. It has been experimentally shown that the position of this point depends on the glottal profile. As described in [15], the separation point located at the glottal exit shifts down to the boundary between masses and when the folds profile becomes more divergent than a threshold [Eq. (11)].
Viscous losses are modeled according to a bi-dimensional Poiseuille flow [Eqs. (8) and (11)]. The equations for the pressure inside the glottis are
| (7) | ||||
| (8) | ||||
| (11) | ||||
| (12) |
As sketched in Fig. 1, the pressures exerted by the airflow are: at the entrance of the glottis, at the upper edge of , at the lower edge of , at the entrance of the vocal tract and the subglottal pressure.
The width of the folds (in the plane normal to Fig. 1) is ; and are the lengths of the lower and upper masses, respectively. are the cross-sections of the glottis, ; and are the viscosity and density coefficient of the air; is the airflow inside the glottis, and is an experimental coefficient. We also assume no losses at the glottal entrance [Eq. (7)], and zero pressure at the entrance of the vocal tract [Eq. (12)].
The hydrodynamic force acting on each mass reads:
| (15) |
| (19) |
3 Analysis of the model
3.1 Bifurcation diagram
The main anatomical parameters that can be actively controlled during the vocalizations are the subglottal pressure and the folds tension controlled by the laryngeal muscles. In particular, the action of the thyroarytenoid and the cricothyroid muscles control the thickness and the stiffness of folds. Following [1], this effect is modeled by a parameter that scales the mechanic properties of the folds by a cord-tension parameter: , and . We therefore performed a bifurcation diagram using these two standard control parameters and .
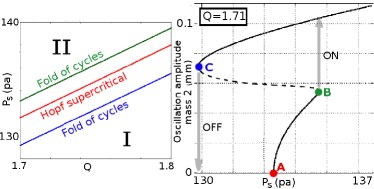
Five main regions of different dynamic solutions are shown in Fig. 2. At low pressure values (region I), the system presents a stable fixed point. Reaching region II, the fixed point becomes unstable and there appears an attracting limit cycle. At the interface between regions I and II, three bifurcations occur in a narrow range of subglottal pressure (Fig. 3, left panel), all along the axis. The right panel of Fig. 3 shows the oscillation amplitude of . At point A, oscillations are born in a supercritical Hopf bifurcation. The amplitude grows continuously for increasing until point B, where it jumps to the upper branch. If the pressure is then decreased, the oscillations persist even for lower pressure values than the onset in A. When point C is reached, the oscillations suddenly stop and the system returns to the rest position. This onset-offset oscillation hysteresis was already reported experimentally in [12].
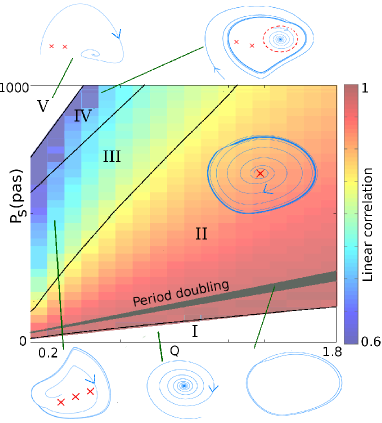
The branch AB depends on the viscosity. Decreasing , points A and B approach to each other until they collide at , recovering the result reported in [3, 10, 14], where the oscillations occur as the combination of a subcritical Hopf bifurcation and a cyclic fold bifurcation.
On the other hand, the branch BC depends on the separation point of the jet formation. In particular, for increasing , the folds become stiffer and the separation point moves upwards toward the output of the glottis. From a dynamical point of view, points C and B approach to each other until they collapse. In this case, the oscillations are born at a supercritical Hopf bifurcation and the system presents no hysteresis, as in the standard flapping model [17].
Regions II and III of Fig. 2 are separated by a saddle-repulsor bifurcation. Although this bifurcation does not represent a qualitative dynamical change for the oscillating folds, its effects are relevant when the complete mechanism of voiced sound production is considered. Voiced sounds are generated as the airflow disturbance produced by the oscillation of the vocal folds is injected into the series of cavities extending from the laryngeal exit to the mouth, a non-uniform tube known as the vocal tract. The disturbance travels back and forth along the vocal tract, that acts as a filter for the original signal, enhancing the frequencies of the source that fall near the vocal tract resonances. Voiced sounds are in fact perceived and classified according to these resonances, as in the case of vowels [18]. Consequently, one central aspect in the generation of voiced sounds is the production of a spectrally rich signal at the sound source level.
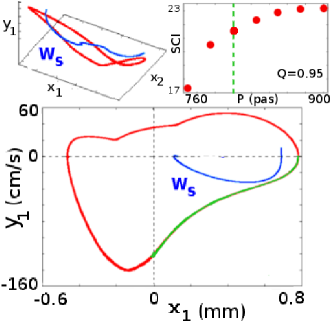
Interestingly, normal phonation occurs in the region near the appearance of the saddle-repulsor bifurcation. Although this bifurcation does not alter the dynamical regime of the system or its time scales, we have observed that part of the limit cycle approaches the stable manifold of the new fixed point (as displayed in Fig. 4), therefore changing its shape. This deformation is not restricted to the appearance of the new fixed point but rather occurs in a coarse region around the boundary between II and III, as the flux changes smoothly in a vicinity of the bifurcation. In order to illustrate this effect, we use the spectral content index SCI [21], an indicator of the spectral richness of a signal: , where is the Fourier amplitude of the frequency and is the fundamental frequency. As the pressure is increased, the SCI of increases (upper right panel of Fig. 4), observing a boost in the vicinity of the saddle-repulsor bifurcation that stabilizes after the saddle point is generated.
Thus, the appearance of this bifurcation near the region of normal phonation could indicate a possible mechanism to further enhance the spectral richness of the sound source, on which the production of voiced sounds ultimately relies.
In the boundary between regions III and IV, one of the unstable points created in the saddle-repulsor bifurcation undergoes a subcritical Hopf bifurcation, changing stability as an unstable limit cycle is created [19]. Finally, entering region V, the stable and the unstable cycles collide and disappear in a fold of cycles where no oscillatory regimes exist.
In Fig. 2, we also display a color map that quantifies the difference between the solutions of the model and the flapping approximation. The flapping model is a two dimensional model that, instead of two masses per fold, assumes a wave propagating along a linear profile of the folds, i.e., the displacement of the upper edge of the folds is delayed with respect to the lower. The cross sectional areas at glottal entry and exit ( and ) are approximated, in terms of the position of the midpoint of the folds, by
| (22) |
where is the midpoint displacement from equilibrium , and is the time that the surface wave takes to travel half the way from bottom to top. Equation (22) can be rewritten as . We use this expression to quantify the difference between the oscillations obtained with the two-mass model solutions and the ones generated with the flapping approximation, computing the linear correlation coefficient between and . As expected, the correlation coefficient decreases for increasing or decreasing . In the region near normal phonation, the approximation is still relatively good, with . As expected, the approximation is better for increasing , since the effect of colliding folds is not included in the flapping model.
3.2 Isofrequency curves
One basic perceptual property of the voice is the pitch, identified with the fundamental frequency of the vocal folds oscillation. The production of different pitch contours is central to language, as they affect the semantic content of speech, carrying accent and intonation information. Although experimental data on pitch control is scarce, it was reported that it is actively controlled by the laryngeal muscles and the subglottal pressure. In particular, when the vocalis or interarytenoid muscle activity is inactive, a raise of the subglottal pressure produces an upraising of the pitch [16].
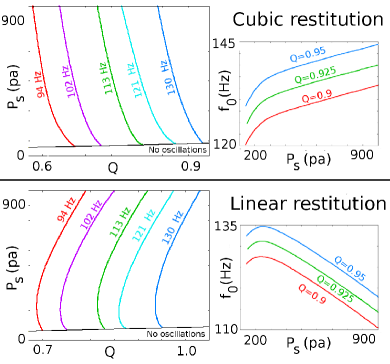
Compatible with these experimental results, we performed a theoretical analysis using as a single control parameter for pitch. In the upper panels of Fig. 5, we show isofrequency curves in the range of normal speech for our model of Eqs. (1) to (19). Following the ideas developed in [22] for the avian case, we compare the behavior of the fundamental frequency with respect to pressure in the two most usual cases presented in the literature: the cubic [1, 7] and the linear [10, 14] restitutions. In the lower panels of Fig. 5, we show the isofrequency curves that result from replacing the cubic restitution by a linear restitution .
Although the curves are not affected by the type of restitution at the very beginning of oscillations, the changes become evident for higher values of , with positive slopes for the cubic case and negative for the linear case. This result suggests that a nonlinear cubic restitution force is a good model for the elastic properties of the oscillating tissue.
4 Conclusions
In this paper, we have analyzed a complete two-mass model of the vocal folds integrating collisions, nonlinear restitution and dissipative forces for the tissue and jets and viscous losses of the air-stream. In a framework of growing interest for detailed modeling of voice production, the aspects studied here contribute to understanding the role of the different physical terms in different dynamical behaviors.
We calculated the bifurcation diagram, focusing in two regimes: the oscillation onset and normal phonation. Near the parameters of normal phonation, a saddle repulsor bifurcation takes place that modifies the shape of the limit cycle, contributing to the spectral richness of the glottal flow, which is central to the production of voiced sounds. With respect to the oscillation onset, we showed how jets and viscous losses intervene in the hysteresis phenomenon.
Many different models for the restitution properties of the tissue have been used across the literature, including linear and cubic functional forms. Yet, its specific role was not reported. Here we showed that the experimental relationship between subglottal pressure and pitch is fulfilled by a cubic term.
Acknowledgements.
This work was partially funded by UBA and CONICET.References
- [1] K Ishizaka, J L Flanagan, Synthesis of voiced sounds from a two-mass model of the vocal cords, Bell Syst. Tech. J. 51, 1233 (1972).
- [2] I R Titze, The physics of small‐amplitude oscillation of the vocal folds, J. Acoust. Soc. Am. 83, 1536 (1988).
- [3] M A Trevisan, M C Eguia, G Mindlin, Nonlinear aspects of analysis and synthesis of speech time series data, Phys. Rev. E 63, 026216 (2001).
- [4] Y S Perl, E M Arneodo, A Amador, F Goller, G B Mindlin, Reconstruction of physiological instructions from Zebra finch song, Phys. Rev. E 84, 051909 (2011).
- [5] E M Arneodo, Y S Perl, F Goller, G B Mindlin, Prosthetic avian vocal organ controlled by a freely behaving bird based on a low dimensional model of the biomechanical periphery, PLoS Comput. Biol. 8, e1002546 (2012).
- [6] B H Story, I R Titze Voice simulation with a body‐cover model of the vocal folds, J. Acoust. Soc. Am. 97, 1249 (1995).
- [7] J C Lucero, L Koening Simulations of temporal patterns of oral airflow in men and women using a two-mass model of the vocal folds under dynamic control, J. Acoust. Soc. Am. 117, 1362 (2005).
- [8] X Pelorson, X Vescovi, C Castelli, E Hirschberg, A Wijnands, A P J Bailliet, H M A Hirschberg, Description of the flow through in-vitro models of the glottis during phonation. Application to voiced sounds synthesis, Acta Acust. 82, 358 (1996).
- [9] M E Smith, G S Berke, B R Gerratt, Laryngeal paralyses: Theoretical considerations and effects on laryngeal vibration, J. Speech Hear. Res. 35, 545 (1992).
- [10] I Steinecke, H Herzel Bifurcations in an asymmetric vocal‐fold model, J. Acoust. Soc. Am. 97, 1874 (1995).
- [11] N J C Lous, G C J Hofmans, R N J Veldhuis, A Hirschberg, A symmetrical two-mass vocal-fold model coupled to vocal tract and trachea, with application to prosthesis design, Acta Acust. United Ac. 84, 1135 (1998).
- [12] T Baer, Vocal fold physiology˝͑, University of Tokyo Press, Tokyo, (1981).
- [13] T Ikeda, Y Matsuzak, T Aomatsu, A numerical analysis of phonation using a two-dimensional flexible channel model of the vocal folds, J. Biomech. Eng. 123, 571 (2001).
- [14] J C Lucero, Dynamics of the two-mass model of the vocal folds: Equilibria, bifurcations, and oscillation region, J. Acoust. Soc. Am. 94, 3104 (1993).
- [15] X Pelorson, A Hirschberg, R R van Hassel, A P J Wijnands, Y Auregan, Theoretical and experimental study of quasisteady‐flow separation within the glottis during phonation. Application to a modified two‐mass model, J. Acoust. Soc. Am. 96, 3416 (1994).
- [16] T Baer, Reflex activation of laryngeal muscles by sudden induced subglottal pressure changes, J. Acoust. Soc. Am. 65, 1271 (1979).
- [17] J C Lucero, A theoretical study of the hysteresis phenomenon at vocal fold oscillation onset-offset, J. Acoust. Soc. Am. 105, 423 (1999).
- [18] I Titze, Principles of voice production, Prentice Hall, (1994).
- [19] J Guckenheimer, P Holmes, Nonlinear oscillations, dynamical systems and bifurcations of vector fields, Springer, (1983).
- [20] E Doedel, AUTO: Software for continuation and bifurcation problems in ordinary differential equations, AUTO User Manual, (1986).
- [21] J Sitt, A Amador, F Goller, G B Mindin, Dynamical origin of spectrally rich vocalizations in birdsong, Phys. Rev. E 78, 011905 (2008).
- [22] A Amador, F Goller, G B Mindlin, Frequency modulation during song in a suboscine does not require vocal muscles, J. Neurophysiol. 99, 2383 (2008).