Towards First Principles prediction of Voltage Dependences of Electrolyte/Electrolyte Interfacial Processes in Lithium Ion Batteries
Abstract
In lithium ion batteries, Li+ intercalation and processes associated with passivation of electrodes are governed by applied voltages, which are in turn associated with free energy changes of Li+ transfer () between the solid and liquid phases. Using ab initio molecular dynamics (AIMD) and thermodynamic integration techniques, we compute for the virtual transfer of a Li+ from a LiC6 anode slab, with pristine basal planes exposed, to liquid ethylene carbonate confined in a nanogap. The onset of delithiation, at =0, is found to occur on LiC6 anodes with negatively charged basal surfaces. These negative surface charges are evidently needed to retain Li+ inside the electrode, and should affect passivation (“SEI”) film formation processes. Fast electrolyte decomposition is observed at even larger electron surface densities. By assigning the experimentally known voltage (0.1 V vs. Li+/Li metal) to the predicted delithiation onset, an absolute potential scale is obtained. This enables voltage calibrations in simulation cells used in AIMD studies, and paves the way for future prediction of voltage dependences in interfacial processes in batteries.
keywords: lithium ion batteries; voltage prediction; density functional theory; ab initio molecule dynamics; computational electrochemistry
I Introduction
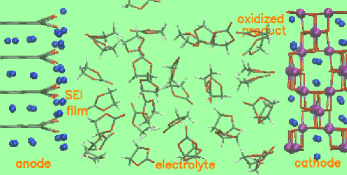
Imposing a potential difference between electrodes is the among most basic operations in electrochemical experiments. In lithium ion batteries (LIB), critical processes such as Li+ intercalation into anodes and cathodes, and electrochemical reductive/oxidative decomposition of organic-solvent based electrolytes, are governed by half-cell voltages. For example, widely used electrolytes based on a mixture of ethylene carbonate (EC), dimethyl carbonate (DMC, or similar linear carbonates), lithiun ions, and hexafluorophosphide counterions (PF) start to decompose on the anode at 0.7-0.8 V relative to lithium metal foil reference (Li+/Li(s)), while Li+ insertion into commerical graphite anodes occurs at much lower, 0.1-0.2 V, potentials. To prevent continuous loss of electrolyte and exfoliation of graphite during charging, anode-passivation by self-limiting films (called solid-electrolyte interphase or SEI films) formed via electron-injection-induced electrolyte degradation is critical for LIB operations.book2 ; book ; book1 ; review Proposed high-voltage cathode materials like LiMn1.5Ni0.5O4 intercalate Li+ above the experimentally observed stability voltage limit of EC/DMC/LiPF6. Either new electrolytes need to be discovered, or the liquid-solid interfaces must be artificially passivated to avoid electrolyte oxidation on these cathode surfaces. To understand and control degradation processes at atomic/electronic lengthscales, there is arguably an urgent need to use electronic structure computational tools (e.g., Density Functional Theory, DFT) to calculate the voltage dependence of interfacial processes.
However, DFT and quantum chemistry techniques deal with fixed numbers of electrons (), not fixed voltages. The two properties are conjugate, like pressure and volume; specifying means that potentials are implicitly defined. In cluster calculations, where periodic boundary conditions are not used,truhlar ; dupuis ; friesner ; batista intrinsic redox potentials can be readily calculated at the expense of excluding electrodes in the models. Ab initio molecular dynamics-based redox calculations with explicit treatment of pure liquid environments have also been an area of fruitful study.adriannse However, calculating potentials on electrodes in a DFT context and condensed-phase settings has long been recognized as a challenge in computational electrochemistry.halley ; sprik10 ; sprik12 ; gross08 ; gross11 ; otani08 ; otani06 ; selloni10 ; schmickler ; santos ; arias12 ; norskov12 ; neurock06 ; rossmeisl13 ; rossmeisl08 ; rossmeisl11 It is further complicated by subtle issues of whether “Galvani” and “Volta” voltages are well-defined, can be measured, or even computed.guggen ; pratt92 ; sprik12
 (a)
(a)
 (b)
(b)
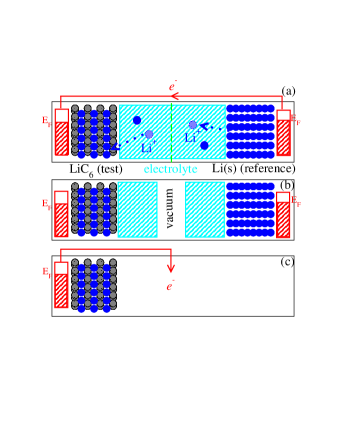
Part of the challenge arises because, unlike classical force fields depiction of electrodes, e.g., using the polarizable Siepmann-Sprik model,siepmann ; borodin12a ; borodin13 ; madden ; madden1 ; chandler ; pratt_cap one-electrode simulation cells are universally applied in DFT electrochemistry calculations (Fig. 1).halley ; sprik10 ; sprik12 ; gross08 ; gross11 ; otani08 ; otani06 ; selloni10 ; schmickler ; santos ; arias12 ; norskov12 ; neurock06 This is partly because accounting for both a cathode and an anode in a DFT simulation cell (Fig. 1a) can easily lead to unphysical migration between the electrodes. In lithium ion batteries, the salt concentration is typically 1.0 M, consistent with small a Debye screening length of 3 Å, so anodes and cathodes are indeed well-screened from each other and independent. But with only one electrode present, imposing a fixed voltage would mean allowing to fluctuate on the electrode. This implies permitting the net charge of periodically replicated simulation cells to change, which makes the total energy undefinedsaunders ; electr ; lyndenbell except in special cases or with specialized boundary conditions.pratt96 ; otani08 These voltage-specific difficulties are compounded by other challenges associated with electronic structure modeling of solid-liquid interfaces,interface such as the inherent difficulty of finding reasonable surface atomic, electronic, and magnetic structuresmeng12 ; greeley ; persson13 and the increased computational cost of modeling liquids at finite temperature.pccp ; interface
In this work, we focus on the interface between liquid EC and fully lithiated graphite (stoichiometry LiC6)ohzuku in lithium ion batteries. When the coulomb efficiency of LIB is close to 100% (e.g., with well-chosen voltage windows or passivated electrodes, so that the electrolyte is no longer being decomposed), the applied voltage should be governed by Li+ transfer between electrodes and the electrolyte, and should only move along the external electrical circuit:
| (1) |
The free energy associated with Li+ transfer, denoted henceforth, is relatively straight-forward, if costly, to compute. When is tuned to zero by adjusting the net surface electronic density, LiC6 is at the onset of deltihiation – experimentally known to occur at 0.1 V vs. Li+/Li(s). In other words, the left behind by delithiation is at a Fermi level () 0.1 eV below that of Li(s) used as reference in batteries. This fixed point permits concrete comparison of predictions with measurements. Further discussions along these lines are given in Sec. II.
associated with Li+ transfer at liquid EC/solid LiC6 interfaces are conducted using thermodynamic integration (TI) techniques which closely follow AIMD solvation calculations.ion Our calculations are operationally similar to some AIMD pKa simulations at water-oxide interfaces.pka1 ; pka2 ; pka3 These methods fall under the umbrella of “chemical space” or alchemical transformations.anatole The Li+ transfer is virtual; no low energy, physical pathway exists for Li+ to diffuse from inside LiC6 solid, through the graphite (0001) plane, to the liquid region.
This paper is organized as follows. Section 2 provides further justifications for our approach. Section 3 describes the thermodynamic integration method used in bulk liquid EC and at interfaces. Section 4 discusses the computed voltages as surface charge densities on electrodes vary, and compares the predictions with changes in electrostatic potentials and instantaneous Kohn-Sham band alignments. A discussion of methodology improvement is given in Sec. 5, and Sec. 6 concludes the paper.
II Justification of approach
A more detailed rationale for our voltage assignment can be made as follows. The casual reader is encouraged to skip to Sec. III.
The implicit reference electrode is Li+/Li(s) (Fig. 2a) at its equilibrium potential:
| (2) |
When an Li+ is removed to the electrolyte, an is left behind at the metallic Li(s) Fermi level, just as an is left at of the working LiC6 electrode (Eq. 1). If we had used a two-electrode simulation cell like Fig. 2a or b, the potential of the working electrode relative to the Li(s) reference can be obtained without experimental input. The lithiated graphite potential should be +0.1 V vs. Li(s), modulo DFT errors. However, we do not actually model Li(s) electrodes and their complex, SEI-covered surfaces which exhibit unknown surface structures and charge densities. Instead, when both Li(s) and LiC6 are at their respective =0.0 eV, in the two electrodes differs by 0.10 V according to experiments, and Eq. 1 must be at 0.10 V relative to Eq. 2. In the language of Ref. sprik12, , Eq. 18, Li+ has the same Galvani potentials inside the electrolyte, LiC6, and Li(s) under these conditions, and the full-cell voltage is just the difference in of the electrodes divided by .
The schematic in Fig. 2b further clarifies that the “Fermi levels” of Fig. 2a can be formally related to measurable work function differences referenced to the vacuum.sprik12 Here a vacuum layer is heuristically inserted in middle of the electrolyte. The surface potentials of the two vacuum/liquid interfaces are clearly equal for the two electrolyte layers covering the electrodes. They cancel each other and yield the same potential difference between the electrodes as Fig. 2a. In other words, Li(s) and LiC6 are in equilibrium with a liquid EC/Li+ electrolyte at the same absolute potential relative to vacuum, regardless of whether the vacuum layer exists. As discussed below, it is computationally advantageous to avoid vacuum regions.
By incorporating the experimentally known 0.1 V voltage difference, an external “electrical circuit” (Fig. 2a) is heuristically completed without directly computing orbital levels in or the cohesive energy of Li(s). Ambiguities about the measurability of half-cell potentialsguggen ; sprik12 ; pratt92 should be avoided. The assumption that on Li metal is at 1.37 V versus vacuum under Eq. 2 conditions, which is analogous to the 4.44 V standard hydrogen electrode reference in aqueous systems, is not used; this information is subsumed into the 0.1 V potential difference and LiC6 calculations which incorporate Li+ solvation effects.
By construction, the hidden Li(s) reference is at equilibrium (=0). But it is a requirement in our scheme to search for =0 with LiC6. is a function of the surface electron density () on LiC6. For the purpose of this computational paper, at each , we assign as the voltage of the anode on short timescales, as if LiC6 were a capacitor or an “ideally polarizable” electrode. This assumes that is adjusted on time scales fast compared to Li+ lithiation/delithiation which may alter the voltage. Indeed, we have frozen all atoms in the LiC6 electrodes in our simulations. By calculating over a range of , the condition under which Eq. 1 is at equilibrium () is obtained. This aspect appears related to Rossmeisl et al.’s calculations of H+ at Pt(111)/H2O interfaces, with the difference that there is no vacuum region in our work. We also define the “lithiation potential of zero charge” (LPZC) of LiC6 as the value when =0. LPZC is not necessarily measurable, but it will allow a check against an alternate, thermodynamic estimate that assumes liquid-solid interface effects are minimal on charge-neutral electrodes (Fig. 2c).
In reality, at low voltages, anodes should be covered with SEI films regardless of its material composition.book2 ; book ; book1 ; review ; harris Our calculations on pristine basal planes are meant to reflect the transient period before SEI starts to form and covers the anode surface; the predicted voltage dependence is precisely what is needed to understand initial SEI formation processes. The LiC6 stochiometry is chosen over unintercalated graphite (which is more appropriate at higher potentials) because the onset of LiC6 delithiation (0.1 V vs. Li+/Li(s)) is much better establishedohzuku than the onset of lithiation into graphite; the latter depends on edge site chemistry. The relatively unreactive graphite basal terminating surfaces are chosen to slow down parasitic reactions that may occur while statistics are being collected. In the future, LiC6 edge planes, more pertinent to lithium intercalation, will be considered. At the same applied voltage, the surface charge densities of different crystal facets differ, as do those of pristine electrodes and electrodes covered with SEI.
A brief comparison between our approach/philosophy, and methods used in the aqueous electrochemistry (especially fuel cell) literature, is next given. Many computational electrochemistry applications are based on surface science methods. Structural optimization is applied at zero temperature; this extends to the configuration of electrolyte molecules, if present. A dielectric approximation is sometimes used to mimic the finite-temperature liquid environment. For catalytic metal electrode surfaces, the theoretical voltage dependence of molecular reactions is calibrated by a combination of Fermi level and thermodynamic cycle estimates. While successful for fuel cell applications, zero temperature-based methods appear to lack the versatility to deal with ionic processes, such as Li+ intercalation from solvent into anodes and the parasitic reactions of its counter ion, PF,book ; oakridge in batteries. Indeed, net charges on electrode and ions in the electrolyte are seldom explicitly included in T=0 K calculations because ions are insoluble (i.e., they “salt out”) in crystalized solvents, and because simulation cells containing material/vacuum interface must be charge-neutral for their energies to be meaningful.except ; rossmeisl08 Most previous assignment of Li potential on LIB electrode surfaces, include our own, apply this imperfect surface science route.pccp ; meng_review We will show that LiC6 basal plane/liquid electrolyte interfaces should in fact be negatively charged. Note that combining dielectric continuum approaches with condensed-phase applications of DFT has shown promise.otani06 ; arias12 ; galli ; marzari However, in LIB, both solvents and salts providing the dielectric environment can participate in electrochemical reactions. Using an all-atom DFT treatment permits unconstrained simulations of their reaction mechanisms, and is prefered.
Recently, metal surfaces covered by thin layers of water have been simulated at finite temperature using AIMD methods.gross08 ; gross11 ; otani08 ; otani06 Even though statistical uncertainties can be significant,gross08 average work functions can be unambiguously predicted. The work function of an electrode covered with a sufficiently thick liquid layer should yield electronic band alignment needed to elucidate its potential relative to vacuum, defined as absolute zero energy.sprik12 However, adding a vacuum layer in LIB models significantly increases the simulation cell size, particularly because symmetric slabs with liquid layers on both electrode surfaces are desirable to mimic battery systems. Here, we are most interested in calculating the voltage dependence of condensed-phase simulation cells used to study electrolyte decompositionpccp ; ald ; oakridge ; mno and Li+ intercalation dynamcis.abe ; borodin12 Model systems with vacuum gaps are no longer the same simulation cells used for studying the phenomena mentioned above. In battery experiments, vacuum or vapor regions do not exist unless an ionic liquid is used as electrolyte.sullivan It appears ideal to avoid artificially opening vacuum gaps in simulations if an alternative connection to experimental fixed points can be established.
Finally, we compare our approach with rigorous, seminal theoretical studies of band alignment at TiO2/H2O interfaces.sprik10 ; sprik12 Sprik et al. reference their TiO2 electronic bands to the standard hydrogen electrode (SHE) potential at the pH of zero charge of TiO2.
| (3) |
All pocesses associated with Eq. 3 are computed in water-filled simulation cell containing the oxide slab. The pH of zero charge of TiO2 has been measured, and properties computed at the PZC can be compared to experiments. In LIB, potentials of zero charge, determined not by pH but by the net electron surface density (), are unknown. Furthermore, the lack of a liquid H2O environment inside LIB renders calculating Eq. 3 in LIB simulation cells meaningless. In LIB half-cell measurements, lithium metal foils are used as counter electrodes. Unfortunately, it is impractical to place a Li metal slab in our LiC6 simulation cell and compute reference properties analogous to Eq. 3. Not only is there substantial lattice mismatch, but pristine Li(s) reacts violently with organic solvents.ald Our approach is agnostic to the vacuum level or the SHE, but uses the experimental LiC6 voltage at the onset of Li+ delithiation as reference. Unlike TiO2, LiC6 is metallic; removing a Li+ from LiC6 leaves an excess on the Fermi level, not in a localized state. For LIB cathode oxides which are electronic insulators, our approach needs to be significantly modified.
III Method
III.1 Li+ solvation free energy
The basic thermodynamic integration formula used in this work is
| (4) |
where parameterizes the continuous creation or deletion of a Li+ ion and denotes averaging with intermediate Hamiltonian, , sampled using molecular dynamics trajectories.
First we apply it to compute Li+ absolute solvation free energies () in bulk EC liquid. Liquid EC simulation cells are of dimensions (15.2442 Å)3 and are filled with 32 EC molecules and a Liλ+ ion (Fig. 3a). Liλ+ is represented by a VASP Li+ pseudopotential without core electrons and with all -dependent parts scaled uniformally by . The success of such a scaling has been previously demonstrated in another solvent.ion The integrands are evaluated at either 2 or 6 discrete points, each sampled every 0.1 ps interval of an AIMD trajectory with a Liλ+ pseudopotential. -derivatives are computed via finite difference with =0.025. Integrand values at or are not physically significant. They only serve to evaluate the integral in Eq. 4, which should be path independent. Other functional forms for can be used to scale the pseudopotentials, and should give the same result.
Since a periodically replicated simulation cell is used in conjunction with Ewald summation of electrostatics, and cells that contain Liλ+ ions have a net charge, several electrostatic corrections are needed.pratt97 ; pratt96 ; saunders ; electr ; lyndenbell The well-known monopole correction is /(2), where is the box length and is the Madelung constant. =1 is imposed for gas phase calculations when evaluating the energies of bare Liλ+ which needs to be subtracted while = is assumed for the high dielectric EC liquid. The quadrupole correctionion ; pratt92 ; saunders
| (5) |
is computed using optimized gas phase EC geometry. The EC carbonyl carbon, positioned at , is chosen as molecular center; and are the EC density and the total (electronic plus nuclear) charge density, respectively. Finally, the dipolar contribution to the surface potential, computed using the carbonyl carbon as molecular center for consistency,pratt92 is estimated using classical force fields; see the supporting information (S.I.) for details. The corrections arise from the long-range nature of electrostatics; all higher multiple contributions vanish.pratt92 ; saunders ; electr
III.2 Free energy of Li+ transfer from LiC6 to liquid EC
There is neither sufficient static/dynamic symmetry nor reasonable physical boundaries to evaluate the quadrupole moment correction (Eq. 5) in simulation cells containing an electrode (Fig. 1b).electr Consequently, the energies of charged simulation cells require corrections that cannot be readily evaluated. In this work, only interfacial cells with constant and overall charge neutrality are considered. We freeze all atoms of a “LiC6” slab with a C288Li36 stoichiometry (3 layers of Li intercalated between 4 graphite sheet with basal planes exposed, Fig. 1b), select one Li in the middle Li slab, and scale all -dependent parts of its pseudopotential by . At the same time, a Liλ+ pseudopotential is created at a fixed position in the liquid electrolyte, halfway between electrode surfaces. Bare Liλ+ contributions cancel and their energies do no need to computed. Eq. 4 is approximated with a 2-point gaussian quadrature formula, which is justified and corrected in Sec. IV.1. The simulation cells have dimensions 34.0012.9614.96Å3. 32 EC molecules, 0 to 4 mobile Li+, and in some cases a Liλ+ and/or 2 Li+PF ion pairs fill the gap between electrode surfaces. The presence of mobile Li+ mimics experimental conditions, but creates hurdles for AIMD trajectories which are typically short compared to Li+ diffusion time scale. Despite this, we have found reasonable agreement among predicted when initial Li+ configurations are varied.
We have only considered removing Li+ from the middle of the LiC6 slab because these are proof-of-principle “virtual” calculations aimed at elucidating the thermodynamics of Li+ transfer. In reality, Li+ escapes LiC6 through graphite edge, and Li+ intercalation potentials at those edge sites often functionalized with oxygen groups will differ from those inside LiC6. This will be addressed in future publications. variations as a function of Li+ position inside the electrolyte is expected to be small, and is discussed at the end of Sec. IV.5.
The Li(1-λ)+ and Liλ+ ions being “transferred” are frozen in space. Hence the TI procedure omits vibrational and translational entropies of these ions. Assuming each Li+ is independent inside LiC6, the Hessian matrix elements ==3.04, 0.90, and 0.92 eV/Å2 for = and are found to be zero otherwise, where E is the total energy of the LiC6 solid and are the Cartesian coordinates of the tagged Li+. The Li+ translational/volumetric entropy corresponding to a 1.0 M salt solution ( [ ln(1660Å3)]) and its vibrational free energy ( [ ln(]) are added to and subtracted from , respectively. The correction amounts to eV.
III.3 AIMD Details
AIMD calculations are conducted using the Vienna Atomic Simulation Package (VASP) version 4.6vasp ; vasp1 and the PBE functional.pbe A 400 eV planewave energy cutoff, -point Brillouin zone sampling, and a 10-6 eV convergence criterion are applied at each Born-Oppenheimer time step, 1 fs in duration. The -space sampling is spot-checked using a denser 122 grid. The trajectories are kept at an average temperature of T=450 K using Nose thermostats. The elevated temperature reflects the need to “melt” EC, which has an experimental freezing point above room temperature, and to improve sampling efficiency.water In real batteries DMC cosolvent molecules reduce the viscosity, but DMC is not included herein. Minor differences in that may arise from the use of a mixed solvent in real batteries are neglected in this work. Tritium masses on EC are substituted for protons. The first 1 ps of each AIMD trajectory is discarded and the rest is used for sampling Eq. 4. The different AIMD simulations and trajectory lengths are described in Table 2.
AIMD trajectories are initialized from configurations pre-equilibrated using simple, rigid-body classical molecular force fields,pccp ; bal Monte Carlo (MC) simulations, and the Towhee code.towhee At least 40,000 MC passes at T=1000, 700, and then 400 K are successively conducted, and the final configuration is used for AIMD simulations. In that sense, the electrical double layer should be well-equilibrated to the extent that the simple classical force field used is accurate. When PF and excess mobile Li+ are both present in the electrolyte, the MC simulation procedure yields Li+/PF, but not Li(λ+)/PF, contact ion pairs.
We have also applied flexible classical molecular force fields to perform molecular dynamics so as to estimate the dipole contribution to the surface potential of pure liquid EC.tenney These calculations enable the prediction of absolute Li+ , defined as the free energy change of moving an Li+ from vacuum through the liquid-vacuum interface into EC liquid (see the S.I.).
IV Results
IV.1 Li+ solvation in EC liquid
(a) 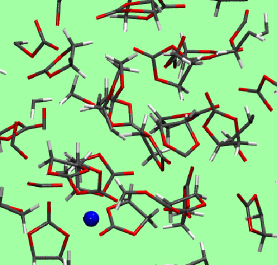 (b)
(b) 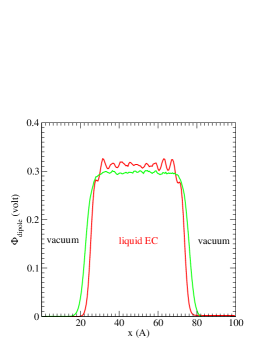
Although not the main purpose of this work, Li+ calculations illustrate the non-trivial effect of interfaces and highlights important electrostatic considerations. Table 1 lists predictions for Li+ in EC liquid at T=450 K. Our predicted is larger in magnitude than that computed using a bare Li+ plus a dielectric continuum approximation.johansson It is smaller than predicted in acetonitrile solvent, reported without surface potential corrections.borodin12 ; liox The 2-pt and 6-pt formulas for Li+ solvation differ by 0.15 eV (see the S.I.), which is within twice the standard deviation, but larger than the discrepancy obtained in H2O solvent.ion In the rest of this work, a global eV correction is applied to all computed using the 2-point formula because also involves Li+ solvation effects. This correction does not affect the relative as the voltage varies.
We have also considered the energy () of a Liλ+ embedded in bulk LiC6 solid while all atoms are frozen and is held fixed. The S.I. shows that a low-order integration suffices for . These findings are used to justify the 2-pt formula for Eq. 4 when we simultaneously annihilate a Li+ inside LiC6 and create a Li+ inside EC liquid.
The dipole contribution to the EC liquid-vapor surface potential is depicted in Fig. 3b. This quantity depends on the choice of the molecular center; only the sum of the dipolar and quadrupolar contribution is physical.pratt92 Nevertheless, Fig. 3b serves to illustrate that the surface potential between a pure liquid and the vacuum is in general on the order of a fraction of a volt.pratt87 When salt is present, some ions may be repelled from the liquid surface while others may be attracted there, setting up further, non-trivial electric fields.jungwirth Thus, if we had opened up an artificial gap in the electrolyte region to estimate band alignment relative to absolute zero energy, we would have introduced two addition interfaces where distributions of ions are additional sources of concern. In our interfacial simulations, vacuum gaps are avoided, and no classical force field-generated contributions are included in .
| 2-pt | 6-pt | |||
|---|---|---|---|---|
| 2.042 | +0.300 | +5.389 | -5.0540.04 | -5.2010.04 |
IV.2 of Li+ transfer from LiC6 to EC liquid
| (Li) | (PF6-) | |||||
| A | 0 | 0 | 0.211 | 35.7 | +5.320.19 | |
| B | 0 | 0 | 0.789 | 16.7 | -6.570.11 | -1.00 |
| C | 0 | 0 | 0.211 | 30.1 | +5.520.10 | |
| D | 0 | 0 | 0.789 | 17.9 | -6.540.10 | -0.88 |
| E | 1 | 0 | 0.211 | 18.0 | +6.060.14 | |
| F | 1 | 0 | 0.789 | 17.9 | -6.210.05 | -0.45 |
| G | 2 | 0 | 0.211 | 15.1 | +6.230.11 | |
| H | 2 | 0 | 0.789 | 18.4 | -5.650.11 | -0.08 |
| I | 2 | 0 | 0.211 | 18.0 | +6.450.07 | |
| J | 2 | 0 | 0.789 | 16.8 | -5.730.11 | -0.04 |
| K | 4 | 2 | 0.211 | 15.6 | +6.580.12 | |
| L | 4 | 2 | 0.789 | 16.0 | -5.820.11 | +0.01 |
| M | 4 | 0 | 0.211 | 3.9 | NA | |
| N | 4 | 0 | 0.789 | 3.9 | NA | |
| O | 0 | 0 | NA | 16.4 | NA | |
| P | 2 | 0 | NA | 15.0 | NA | |
| Q | 4 | 0 | NA | 9.2 | NA |
Figure 4 depicts associated with Li+ transfer from LiC6 to the EC liquid with 0, 1, and 2 excess in the LiC6 anode compensated with the same number of mobile Li+ ions in the electrolyte. It is compiled using trajectories A-J (Table 2), and constitutes the main result of the paper.
The -axis denotes surface density. In the S.I., we show, as expected from classical electrostatics, that the excess density on the electrode is fairly evenly distributed on the two surfaces, although instantaneously the surfaces can exhibit variations in charges; the x-axis reflects an average over them (see the S.I.). Henceforth we report a uniform surface density LiC6 surfaces, , where Å2 is the lateral surface area of the simulation cell. After a Li+ is transferred from LiC6 to liquid EC, an extra resides on the anode compared to before Li+ transfer. In our finite simulation cell, the resulting change in is not negligable. Hence we have marked the three ’s at halfway points, at values consistent with , , and excess in LiC6. On macroscopic electrodes, adding one extra does not affect . By placing our data point at halfway marks, we are effectively extrapolating towards this infinite size limit. The -axis depicts in units of volt. V represents the point where Li+ is equally favored inside or outside LiC6 anode. Thus =0 denotes the onset of delithiation. Experimentally, this is known to occur at 0.1 V versus Li+/Li(s). This reference point allows us to assign an absolute voltage scale. Above the green line, LiC6 is thermodynamically unstable. This emphasizes that anode surfaces, or at least pristine LiC6 basal planes, need to be negatively charged to retain Li+.
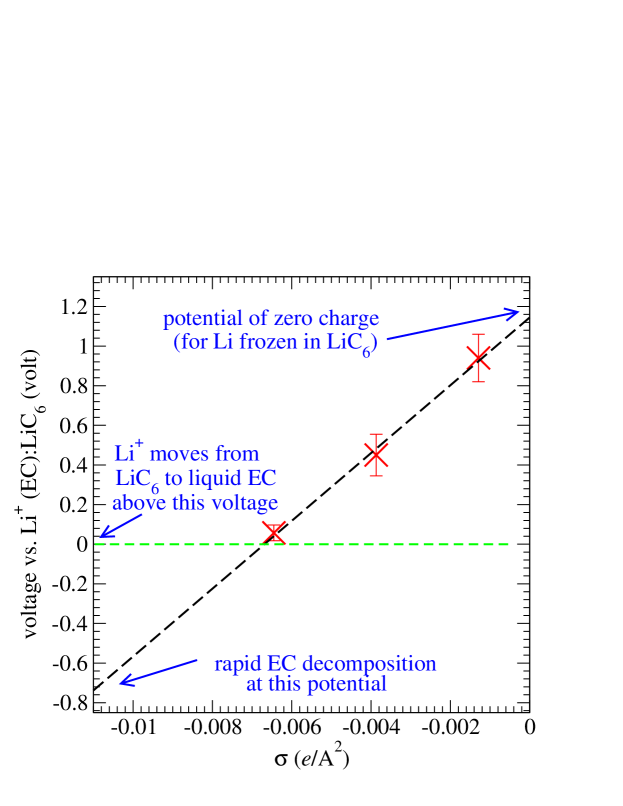
Despite the statistical noise, the three points approximately lie on a straight line, with /0.44 V/. Linearity is reasonable over such a small voltage window but is not essential to our analysis. If we treat LiC6 as a capacitor, and factor in the electrode surface area, /(potential)=8.3 C/cm2/V. This value is larger than the predicted capacitances of unlithiated carbon nanotube arrays in propylene carbonatepratt_cap and porous carbon electrode models in ionic liquids,borodin13 and smaller than the capacitances of metallic electrodes.arias12
IV.3 Statistical Uncertainties and Other Spot Checks
values are tabulated in Table 2, which also lists statistical uncertainties and illustrates the dependence on initial configurations. We have run two trajectories each for =0.211 and =0.789 with 0 and 2 excess on the anode. In all cases, with =0.789 exhibit smaller numerical uncertainties and dependence on initial conditions compared to integrands evaluated at =0.211, even when the AIMD sampling trajectory is longer for the smaller . We have further considered a third set with two excess on the anode plus four Li+ and two PF mobile ions in the electrolyte region (trajectories K & L). During equilibration with force fields, each PF forms a contact ion pair (CIP) with a Li+. Such ion-pairing has been predicted to occur with considerable probability using polarizable classical force fields.borodin3 As might be expected, the charge-neutral CIPs do not appreciably affect (trajectories K & L).
In the S.I., snapshots of Li+ configuration as well as their distributions as functions of are depicted. They clearly show that Li+ spatial configurations are not completely converged within 15-35 ps AIMD trajectories. Despite this, the configurations of large-dipole-moment EC molecules appear to compensate for differences in Li+ positions and make =0.789 integrand values relatively consistent (e.g., trajectories H and J). On the other hand, even =0.211 integrands in simulation cells without mobile Li+ (trajectories A & C) exhibit a considerable dependence on initial configurations. In contrast, Li+ calculations conducted in the absence of the electrode does not exhibit larger uncertainty at small . This enhanced sensitivity at small is as yet not completely understood. In Fig. 4, we have averaged the results from the two sets of initial conditions and have reported the error bar as the difference between these two runs. The exception is the one mobile Li+ simulation (trajectories E & F); with only one set of data, we have reported the uncertainty by assuming gaussian distributions of noise in -windows. As becomes more negative, EC orients themselves so that their partially positively charged C2H4 termini start to align and point towards the LiC6 surface (not shown). Detailed studies of charge-dependent orientational effects are more suited to classical force field methodsborodin3 than AIMD.
The effect of -point sampling in the lateral ( and ) directions has been spot-checked as follows. Trajectories G and H are sampled every 1 ps. These configurations are used to calculate with both 122 and -point Mohhorst-Pack grids. The resulting computed differ by only eV. An almost identical small discrepancy of eV is found for trajectories A and B when using the two -point grid sizes. We have not added this small correction to the final results (Fig. 4, Table 2).
IV.4 Lithiation Potential of Zero Charge
Extrapolating the results in Fig. 4 to =0 yields the lithiation potential of zero charge (LPZC) for LiC6 basal planes. It is predicted to occur at 1.14 V vs. Li+/LiC6 (1.24 V vs. Li+/Li(s)). At this potential, Li+ should diffuse out of LiC6 into the electrolyte. Thus LPZC for LiC6 basal planes cannot be measured. Delithiated graphite exhibits a potential of zero charge which has no relation to the LiC6 LPZC.pzc
A back-of-the-envelope calculationtrasatti supports the existence of a positive LPZC. If interfacial effects and excess negative charge at basal plane surfaces were absent, the contributions to can be estimated via the following thermodynamic pathway. (1) Remove an Li atom from bulk LiC6; (2) Li(g)Li+(g)+; (3) put the ionized back into LiC6 (reverse of the work function, see the S.I.); (4) Li+(g)Li+(EC). The energies of these processes are computed using DFT/PBE and listed in Table 3. They add to a eV exothermicity for removing Li+ to the EC liquid, or about volt versus Li+/Li(s). An also identical value of 2.00 volt is obtained by focusing only on the energy of at the Fermi level, i.e., the LiC6 workfunction, and subtracting the standard 1.37 V. This is because the experimental equivalents of Table 3 are present when deriving the 1.37 V Li(s) reference.
In Fig. 4, is 1.24 V vs. Li+/Li(s) at . This estimates, and the 1.94 V discussed above, are both large and positive. Their difference must be due to the neglect of solid-liquid interface effects in the latter, known to reduce the work function of charge-neutral water-covered metal surfaces by eV.sprik12 ; pushback Other factors and systematic/statistical errors may also contribute to the difference. Battery techologists focus on voltage variations and arguably do not have a pressing need to measure . However, it is crucial for theorists to impose the correct explicit surface charge in DFT calculations to represent realistic, experimental potentials. This consideration has arguably been neglected in most AIMD interfacial calculations (see the discussions in Ref. interface, ), although the previous works reveal important electrolyte decomposition mechanisms which should be relevant over large voltage windows.
| anode | Li in anode | IP (Li gas) | - (anode) | Li+ | net |
|---|---|---|---|---|---|
| LiC6 | +1.65 | +5.30 | -3.37 | -5.20 | -1.84 |
| Li(s) | +1.56 | +5.30 | -3.05 | -5.20 | -1.56 |
IV.5 Electrostatic/Exchange-Correlation Potentials as varies
Next, we analyze potential differences in cases where 0, 2, and 4 excess reside on the LiC6 slab (trajectories O, P, and Q) using a electrostatic analysis complementary to calculating ion transfer free energies. The simulation cells considered (O-P in Table 2) do not contain -scaled lithium ions and are independent of Li+-transfer simulations. Figure 5 depicts the average potential () which include electrostatic and DFT exchange-correlation contributions, sampled every 1.0 ps. The differences between in the electrolyte and LiC6 regions, bracketed by the green lines in the figure, are 5.80, 4.75, and 4.15 V respectively for 0, 2, and 4 excess . More excess on the anode translates into a higher there (less favorable for electrons to reside in). The 1.05 V difference in between the first two runs is reasonably similar to the 0.88 V difference observed in Fig. 4. The two values are not expected to be identical because Fig. 5 averages almost the entire electrolyte region, not at one value of . Absolute voltages cannot be estimated from electrostatic potential differences.
From the similarity in the -dependence of and , it may be argued that only needs to be computed at one ; the -potential relation can then be determined using /. This intriguing alternate strategy comes with the following caveat. The prediction for 4 excess e- on the anode (Fig. 5) deviates from the linear relation of Fig. 4. It should be taken with a grain of salt because Li+ ions adsorbed directly on the basal planes (Fig. 7, below) are excluded from the region arbitarily chosen for sampling (green lines in Fig. 5). Thus may depend on how many mobile Li+ ions are included in the averaging procedure. The electrolyte is also experiencing decomposition, and this trajectory has to be prematurely terminated (see Sec. IV.7).
The statistical uncertainties depicted in Fig. 4 can in principle be measured as time-dependent properties. The numerical uncertainties associated with Fig. 5, which are about 0.15 V, are however unphysical unless a nanosize probe is used. Assuming the system size is well-converged and fluctuations in each copy of the simulation cell are statistically independent, doubling the lateral dimensions of the cell (i.e., increasing by a factor of 4) should yield a standard deviation half as large. Such cell size-dependence fluctuations should be true of previous calculations of work functions of water-covered metal surfaces as well.gross08 ; gross11
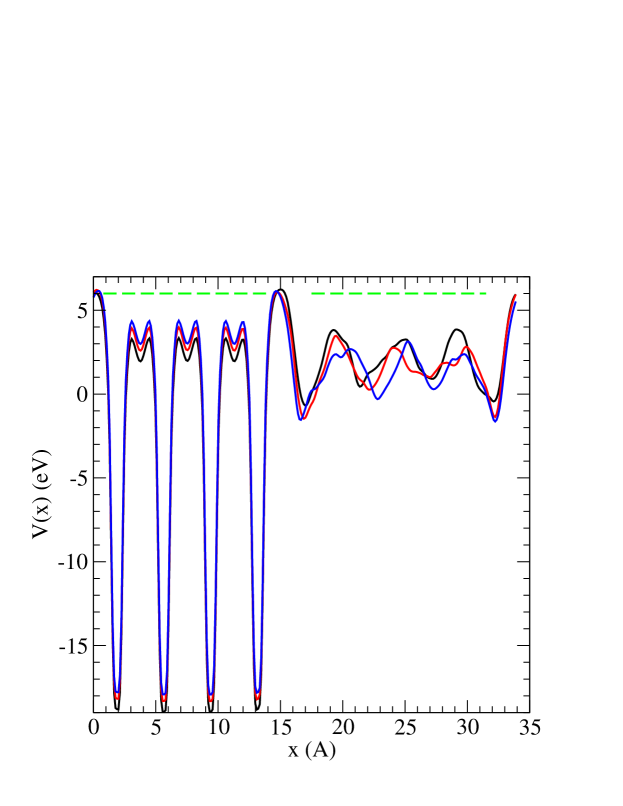
is rather structured in the nanoconfined electrolyte region, reflecting solvent layering which is observed even in classical force field simulations (Fig. 2b). We have conducted short AIMD test runs to show that such layering has little impact on Li+ distributions. First, a Li+ is frozen at either =23.0 Å or =24.7 Å, respectively a valley and peak in the curve. The rest of the electrolyte around the fixed Li+ is pre-equilibrated with classical force fields. Then AIMD is initiated, with the tagged Li+ and all electrolyte molecules allowed to move. In each case, the tagged Li+ is found to fluctuate in space over the course of a few picoseconds, but does not exhibit significant net displacement in the direction. The one initially at Å does not fall into potential wells in computed in the absence of the tagged Li+. This underscores the fact that Li+-solvent interactions are far stronger than the solvent-solvent interactions which determine . This observation dovetails with classical force field predictions that the free energy profile (i.e., “potential of mean force”) of Li+ displacement towards the electrode is much less structured than the mean electrostatic potential; it suggests that using Li+ transfer to calculate electrode voltages may lead to faster convergence with respect to the thickness of the liquid electrolyte layer.
IV.6 Kohn Sham Band Structure as Varies
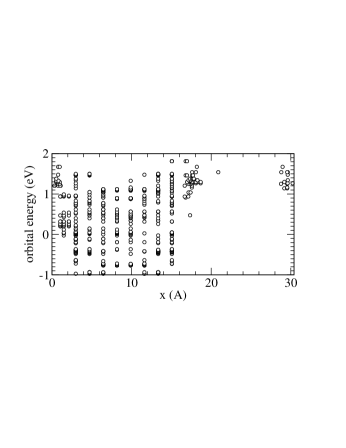
Next we correlate with shifts in the bottom of the conduction band in the electrolyte region as varies. Figure 6 depicts Kohn-Sham band structures in a single snapshot towards the end of trajectories O, P, and Q, with 0, 2, and 4 excess in LiC6 respectively. Here the charge density on each Kohn-Sham orbital is split among atoms at positions ; if 0.005, the histogram at is incremented. The arbitary cutoff means that some orbitals in the electrode are omitted; the density of state is somewhat higher than shown in Fig. 6. Referenced to , always set at 0.0 eV, the electrolyte conduction band minimum is shifted downwards by roughly 1 eV with each successive injection of 2 excess into the LiC6 slab. The magnitude of the shift is consistent with both predictions (Fig. 4, 0.88 V for every two added) and electrostatic potential estimates (Fig. 5, 1.05 V per two ), although these shifts may vary somewhat from one snapshot to the next.
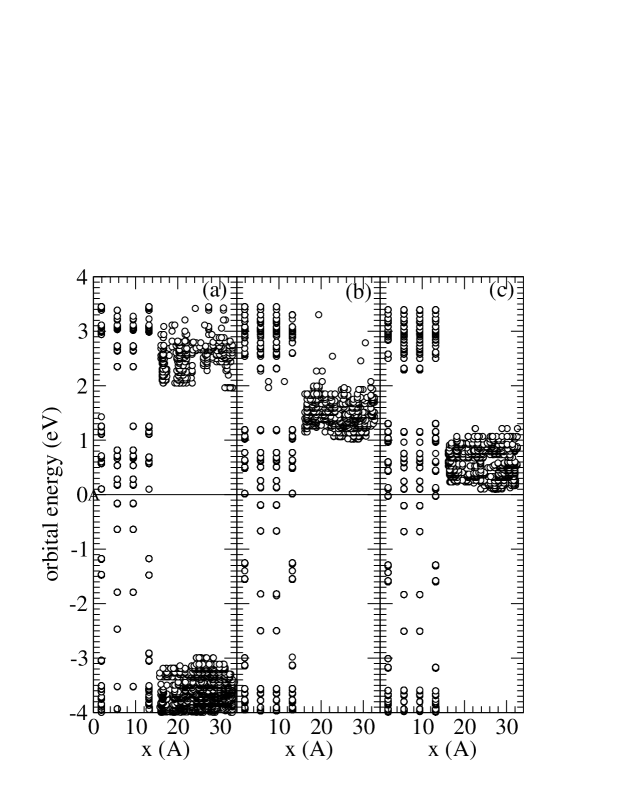
Figure 6c is particular interesting because the snapshot is taken less than 1 ps prior to an EC absorbing two and decomposing. The bottom of the electrolyte conduction band is almost at the Fermi level, enabling rapid transfer to and decomposition of the electrolyte.
IV.7 Electrolyte Decomposition at Low Voltages
(a) 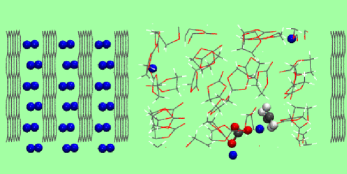
(b) 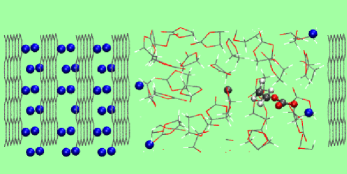
AIMD simulations with excess in the model anode are metastable. According to Fig. 4, their potentials are below the experimentally known EC reduction potential ( V vs. Li+/Li(s)). With 2 excess , / is close to the Li(s) plating potential ( V vs. Li+/Li(s)), which is another source of battery safety concern. Despite this, electrolyte decomposition is not yet observed in those short AIMD trajectories because the basal plane is relatively inert. However, with at least 4 excess in the LiC6 slab, a EC molecule absorbs two and decomposes within picoseconds. Fig. 7 shows snapshots at the end of trajectories Q and N. In each case, a EC molecule breaks an oxygen-ethylene carbon (O-CE) bond, not an oxygen-carbonyl carbon (O-CC) bond. Quantum chemistry calculations on EC2- predict that the latter barrier is smaller.e2 However, on a material surface, we have found that the (O-CE) cleavage barrier can be reduced.ald It is also possible that the extremely low effective voltage associated with these trajectories has changed the dominant decomposition mechanism. Given the limited bond-breaking statistics available in these trajectories, the potential dependence of bond-breaking mechanism cannot be completely resolved but is an important consideration for future studies.
The very fast, adiabatic transfer to EC molecules apparently occurs via fluctuation-induced band-crossing. As discussed in Sec. IV.6, the bottom of the conduction band in the electrolyte region almost coincides with the Fermi level residing in the electron-conducting anode (Fig. 6c). can thus pour into the liquid region. This seems to explain why in Fig. 7a, even an EC in the middle of the electrolyte region can accept two and decompose. Electron motion of this nature may be sensitive to details of DFT functionals (e.g., accuracy of predicted conduction band positions). Fortunately, such negative potentials vs. Li+/Li(s) are not relevant to battery operations, where voltage control is exercised to prevent over-charging. Under normal conditions, the electrolyte conduction band mininum resides above the anode Fermi level (Fig. 6a or b). Fluctuations in EC geometries are then required to lower EC lowest unoccupied molecular orbital levels and permit transfer to EC. Such geometric fluctuations help surmount transfer barriers associated with reorganization free energies enunciated in Marcus Theory.ald
We have not observed Li(s) plating on LiC6 surfaces even at the lowest voltages because Li+ diffusion and nucleation to form Li(s) clusters occur on long timescales.
IV.8 EC/Li(s) Interface: Preliminary Investigations
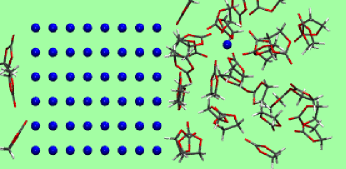
It must be stressed that other interfaces may exhibit very different behavior. For example, EC molecules directly coordinated to more reactive electrode surfaces may more readily participate in transfer due to strong electronic coupling. We have re-analyzed the initial configuration of an AIMD simulation of EC/Li(s) (100) interfaces reported in Ref. ald, , in the absence of excess electrons (i.e., at instantaneous lithiation potential of zero charge, Fig. 8). The electrolyte conduction band minimum lies at least 2.0 eV above the Li metal Fermi level (not shown in Fig. 8a). However, there is significant hybridization between Fermi level metallic states on the electrodes and EC orbitals spatially located near metal surfaces. When an AIMD trajectory is launched from this configuration, EC molecules on the surface rapidly absorb and decompose to form mostly CO gas.ald Using a hybrid DFT functional does not change this picture. In contrast, on LiC6 basal planes, the Kohn-Sham conduction bands in the electrolyte region exhibit negligable coupling with the anode near the Fermi level unless is large and negative (Fig. 6).
 (a)
(a)
 (b)
(b)
Explicit calculations are unlikely to succeed for pristine Li(s) anodes because their extreme reactivity causes rapid solvent decomposition and precludes sufficient AIMD sampling. Instead, in Table 3, we have estimated the LPZC by calculating contributions to the free energy of Li+ transfer from Li(s) to liquid EC if interfacial effects were absent and the surface were uncharged. Analogous to LiC6, LPZC is large and positive under these assumptions. Yet, as mentioned above, EC rapidly decomposes on the charge-neutral Li metal surface, contrary to EC on LiC6 basal planes where reductive decomposition is observed only at large negative potentials. This comparison emphasizes that rates of transfer and electrolyte decomposition strongly depend on surface details.
V Discussions
So far we have performed voltage calculations on one type of electrode surface. At the same applied voltage, different anode crystal facets should exhibit variations in surface charge densities. On carbon surfaces containing edge sites – e.g., pockets framed by C=O functional groups where Li+ can be strongly trappedpccp – the present formalism can determine the instantaneous voltage with a fixed number of Li+ trapped at edge sites if we virtually transfer a Li+ from the anode interior to the solvent. At longer timescales such that Li+ can desorb from surface sites, the potential becomes a function of both excess surface density and the amount of bound Li+ on the electrode surface in equilibrium with mobile Li+ in the liquid region. The resulting surface concentration of Li+ ions (which are likely coordinated to some solvent molecules) may be substantially different from zero temperature DFT estimates performed in the absence of the liquid electrolyte.interface ; meng_review In a similar vein, on SEI-covered anodes, Li+ (and perhaps less likely, PF6-) may adsorb on the SEI surface, and the total net charge of a SEI-covered anode model may have a surface charge-potential relationship quite different from that in Fig. 4. The goal in this work is to use free energy methods to elucidate initial SEI formation, p͡rior to full SEI formation, but the ability to compute surface charge/voltage profiles for SEI-coated electrodes will be essential for future studies of voltage-dependent Li+ transport through the SEI film.
The spatial distribution of mobile Li+ ions is not fully converged within AIMD timescales currently available. Hence it is difficult to quantify the structure or function of the double layer in the simulations reported in this work. It is possible that the up to 0.12 eV statistical uncertainties and the small Debye screening lengths have obscured double-layer effects. Advanced simulation techniques to accelerate salt sampling will be an extremely valuable improvement. However, we stress that the initial AIMD configuration is pre-equilibrated by Monte Carlo simulations of classical force field models, where the electrodes are not polarizable but exhibit the expected constant surface charge density. Therefore the electric double layer should be represented to the extent that the force fields for electrodes and electrolytes are accurate.
Previous studies have shown that the M06-L functional yields the most accurate Li+ solvation free energy in acetonitrile.liox The M05-2X and PBE-derived functionals have also been shown to predict Li+/EC binding energies that differ by up to a few kcal/mol (0.12 eV). This can be a source of small systematic error in , which involves Li+ solvation in EC liquid as an end point.
We have not considered the different stages of lithium-intercalated graphite. At higher voltages, LiC12, LiC18, LiC24 stochiometries, and even graphite free of Li content, dominate.persson ; holzwarth AIMD simulations of interfaces are not ideally suited to accommodating the changes in Li-content and lattice constant variations as these stages transform into each other. Instead we have focused on the LiC6 stoichiometry, consistent with Li intercalation at the lowest potential, to facilitate the study of liquid-solid interfacial effects. We have also frozen all Li ions inside the slab so far. Finally, dispersion-corrected DFT can be used in the future.grimme This is not expected to change the results substantially because AIMD simulations start from classical force field-initiated configurations which are partly determined by dispersion forces.
VI Conclusions
In this work, we have applied AIMD simulations to calculate the free energy of Li+ transfer () from an electronically conducting LiC6 anode to liquid EC electrolyte, in condensed-phase settings appropriate to lithium ion batteries. We have correlated with the voltage on the anode, which in turn depends on the net surface charge. Negative surface charge densities are compensated by mobile, solvated Li+ in the electrolyte in charge-neutral simulation cells. The approach, which does not require a vacuum gap, should be rigorous for modeling electrochemical reactions on macroscopic metallic electrodes in lithium ion batteries in the limit of large simulation cell sizes and long trajectories. Even in the present applications to nanoscale simulation cells, the results are useful for calibrating voltages that cause low-barrier electrolyte decomposition reactions in the same simulation cells.pccp ; ald ; mno ; oakridge These calculations can also potentially be corroborated with state-of-the-art nanoelectrochemical measurements.
As a proof-of-principle example, we have considered LiC6 basal planes and their interfaces with ethylene carbonate (EC). These electrochemically inert graphite surfaces slow down EC decomposition and permit sufficient sampling of over picosecond timescales. Only at large negative potentials relative to Li+/Li(s) are electrolyte decomposition events observed in picosecond timescales. We predict that the basal planes need to be negatively charged to retain Li+. A “lithiation potential of zero charge” (LPZC) of 1.24 V vs. Li+/Li (s) is predicted for LiC6 basal planes. This quantity is not measurable; Li de-intercalation would have occurred at this voltage if edge planes were present to permit it.
At present, the statistical uncertainty in these computationally intensive voltage calculations is on the order of 0.12 V. The spatial distributions of mobile Li+ may not be extremely well-converged within AIMD time scales used. However, our empirical finding is that voltages predicted with salt present do not exhibit significantly larger statistical uncertainties than simulations conducted without mobile ions. Our qualitative conclusion about average surface charges at electrode/electrolyte interfaces is robust, well within the margins of estimated uncertainties. Interesting future applications include anode surfaces which are more reactive, e.g., graphite edge planes and electrode surfaces containing spatial/chemical inhomogeneities.
Acknowledgement
We thank John Sullivan, Michiel Sprik, Andrew Leenheer, Marie-Pierre Gaigeot, Marialore Sulpizi, Oleg Borodin, Kevin Zavadil, and Peter Feibelman for useful discussions. Sandia National Laboratories is a multiprogram laboratory managed and operated by Sandia Corporation, a wholly owned subsidiary of Lockheed Martin Corporation, for the U.S. Deparment of Energy’s National Nuclear Security Administration under contract DE-AC04-94AL85000. AIMD simulations were supported by Nanostructures for Electrical Energy Storage (NEES), an Energy Frontier Research Center funded by the U.S. Department of Energy, Office of Science, Office of Basic Energy Sciences under Award Number DESC0001160. Classical force field simulations were funded by Sandia’s Laboratory-Directed Research and Development program.
Supporting Information Available
Further documentation are available regarding classical force field calculations, snapshots and Li+ distributions along AIMD trajectories, and DFT work function predictions. This information is available free of charge via the Internet at http://pubs.acs.org/.
References
- (1) Advances in lithium-ion batteries, edited by van Schalkwijk, W.A. & Scrosati, B. (Kluwer, New York, 2002).
- (2) Lithium-ion batteries: solid-electrolyte interphase, edited by Wang Y.; Balbuena P.B. (Imperial College, London, 2004).
- (3) Lithium Batteries E. Peled. (Academic Press, London, 1983).
- (4) K. Xu. Nonaqueous Liquid Electrolytes for Lithium-Based Rechargeable Batteries. Chem. Rev. 2004, 104, 4303-4417.
- (5) Winget, P.; Cramer, C.J.; Truhlar, D.G. Computation of Equilibrium Oxidation and Reduction Potentials for Reversible and Dissociative Electron-transfer Reactions in Solution. Theor. Chem. Acc. 2004, 112, 217-227.
- (6) Chen, S.T.; Raugei, S.; Rousseau, R.; Dupuis, M.; Bullock, R.M. Homogeneous Ni Catalysts for H2 Oxidation and Production: An Assessment of Theoretical Methods, from Density Functional Theory to Post Hartree-Fock Correlated Wave-Function Theory. J. Phys. Chem. A 2010, 114, 12716-12724.
- (7) Hughes, T.F.; Friesner, R.A. Development of Accurate DFT Methods for Computing Redox Potentials of Transition Metal Complexes: Results for Model Complexes and Application to Cytochrome P450. J. Chem. Theor. Comput. 2012, 8, 442-459.
- (8) Konezny, S.J.; Doherty, M.D.; Luca, O.R.; Crabtree, R.H.; Soloveichik, G.L.; Batista, V.S. Reduction of Systematic Uncertainty in DFT Redox Potentials of Transition-Metal Complexes. J. Phys. Chem. C 2012, 116, 6349-6356.
- (9) Adriaanse, C.; Cheng, J.; Chau, V.; Sulpizi, M.; VandeVondele, J.; Sprik, M. Aqueous Redox Chemistry and the Electronic Band Structure of Liquid Water. J. Phys. Chem. Lett. 2012, 3, 3411-3415.
- (10) Halley, J.W.; Mazzolo, A.; Zhou, Y.; Price, D. First-principles Simulations of the Electrolde/Electrolyte Interface. J. Electroanal. Chem. 1998, 450, 273-280.
- (11) Cheng, J.; Sprik, M. Aligning Electronic Energy Levels at the TiO2/H2O Interface. Phys. Rev. B 2010, 82, 081406.
- (12) Cheng, J.; Sprik, M. Alignment of Electronic Energy Levels at Electrochemical Interfaces. Phys. Chem. Chem. Phys. 2012, 14, 11245-11267.
- (13) Schnur, S.; Gross, A. Properties of Metal-Water Interfaces Studied from First Principles. New J. Phys. 2009, 11, 125003.
- (14) Schnur, S.; Gross, A. Challenges in the First-Principles Description of Reactions in Electrocatalysis. Catalysis Today 2011, 165, 129-137.
- (15) Otani, M.; Hamada, I.; Sugino, O.; Morikawa, Y.; Okamoto, Y.; Ikeshoji, T. Electrode Dynamics from First Principles. J. Phys. Soc. Jpn 2008, 77, 024802.
- (16) Otani, M.; Sugino, O. First-principles Calculations of Charged Surfaces and Interfaces: A Plane-Wave Non-repeated Slab Approach. Phys. Rev. B 2006, 73, 115407.
- (17) Zipoli, F.; Car, R.; Cohen, M.H.; Selloni, A. Simulation of Electrocatalytic Hydrogen Production by a Bioinspired Catalyst Anchored to a Pyrite Electrode. J. Am. Soc. Chem. 2010, 132, 8593-8601.
- (18) Nazmutdinov, R.R.; Bronshtein, M.D.; Berezin, A.S.; Soldano, G.; Schmickler, W. Bond Breaking Electron Transfer Across a Conducting Nanowire(nanotube)/Electrolyte Solution Interface: The Role of Electrical Double Layer Effects. J. Electroanal. Chem. 2011, 660, 309-313.
- (19) Santos, E.; Quaino, P.; Schmickler, W. Theory of Electrocatalysis: Hydrogen Evolution and More. Phys. Chem. Chem. Phys. 2012, 14, 11224-11233.
- (20) Letchworth-Weaver, K.; Arias, T. A. Joint Density Functional Theory of the Electrode-electrolyte Interface: Application to Fixed Electrode Potentials, Interfacial Capacitances, and Potentials of Zero Charge. Phys. Rev. B 2012, 96, 075140.
- (21) Viswanathan, V.; Hansen, H.A.; Rossmeisl, J.; Jaramillo, T.F.; Pitsch, H.; Norskov J.K. Simulating Linear Sweep Voltammetry from First-Principles: Application to Electrochemical Oxidation of Water on Pt(111) and Pt3Ni(111). J. Phys. Chem. C 2012, 116, 4698-4704.
- (22) Taylor, C.D.; Wasileski, S.A.; Filhol, J.-S.; Neurock, M. First Principles Reaction Modeling of the Electrochemical Interface: Consideration and Calculation of a Tunable Surface Potential From Atomic and Electronic Structure. Phys. Rev. B 2006, 73, 165402.
- (23) Bjorketun, M.E.; Zeng, Z.H.; Ahmed, R.; Tripkovic, V.; Thygesen, K.S.; Rossmeisl, J. Avoiding Pitfalls in the Modeling of Electrochemical Interfaces. Chem. Phys. Lett. 2013, 555, 145-148.
- (24) Rossmeisl, J.; Skulason, E.; Bjorketun, M.E.; Tripkovic, V.; Norskov, J.K. Modeling the Electrified Solid-Liquid Interface. Chem. Phys. Lett. 2008, 466, 68-71.
- (25) Tripkovic, V.; Bjorketun, M.E.; Skulason, E. Rossmeisl, J. Standard Hydrogen Electrode and Potential of Zero Charge in Density Functional Calculations. Phys. Rev. B 2011, 84, 115452.
- (26) Guggenheim, E.A. The Conceptions of Electrical Potential Difference Between Two Phases and the Individual Activities of Ions. J. Phys. Chem. 1929, 33, 842-849.
- (27) Pratt, L.R. Contact Potentials of Solution Interfaces: Phase Equilibrium and Interfacial Electric Fields. J. Phys. Chem. 1992, 96, 25-33.
- (28) Siepmann, J.I.; Sprik, M. Influence of Surface Topology and Electrostatic Potential on Water/Electrode Systems. J. Chem. Phys. 1995, 102, 511-524.
- (29) Vatamanu, J.; Borodin, O.; Smith, G.D. Molecular Dynamics Simulation Studies of the Structure of a Mixed Carbonate/LiPF6 Electrolyte near Graphite Surface as a Function of Electrode Potential. J. Phys. Chem. C 2012, 116, 1114-1121.
- (30) Xing, L.; Vatamanu, J.; Borodin, O.; Bedrov, D. On the Atomistic Nature of Capacitance Enhancement Generated by Ionic Liquid Electrolyte Confined in Subnanometer Pores. J. Phys. Chem. Lett. 2013, 4. 132-140.
- (31) Yang, L.; Fishbine, B.H.; Migliori, A.; Pratt, L.R. Molecular Simulation of Electric Doube-Layer Capacitors Baseed on Carbon Nanotube Forests. J. Am. Chem. Soc. 2009, 131, 12373-12376.
- (32) Merlet, C.; Salanne, M.; Rotenberg, B.; Madden, P.A. Imidazolium Ionic Liquid Interfaces with Vapor and Graphite: Interfacial Tension and Capacitance from Coarse-Grained Molecular Simulations. J. Phys. Chem. C 2011, 115, 16613-16618.
- (33) Merlet, C.; Rotenberg, B.; Madden, P.A.; Taberna, P.-L.; Simon, P.; Gogotsi, Y.; Salanne, M. On the Molecular Origin of Supercapacitance in Nanoporous Carbon Electrodes. Nat. Mater. 2012, 11, 306-310.
- (34) Willard, A.P.; Reed, S.K.; Madden, P.A.; Chandler, D. Water at an Electrochemical Interface – a Simulation Study. Faraday Discuss. 2009, 141, 423-441.
- (35) Saunders, V.R.; Freyria-Fava, C.; Dovesi, R.; Salasco, L.; Roetti, C. On the Electrostatic Potential in Crystalline Systems where the Charge-Density is Expanded in Gaussian Functions. Mol. Phys. 1992, 77, 629-665.
- (36) Leung, K.; Marsman, M. Energies of Ions in Water and Nanopores Within Density Functional Theory. J. Chem. Phys. 2007, 127, 154722.
- (37) Lozovoi, A.Y.; Alavi, A.; Kohanoff, J.; Lynden-Bell, R.M. Ab initio Simulation of Charged Slabs at Constant Chemical Potential. J. Chem. Phys. 2001, 115, 1661-1669.
- (38) Hummer, G.; Pratt, L.R.; Garcia, A.E. Free Energy of Ion Hydration. J. Phys. Chem. 1996, 100, 1206-1215.
- (39) Leung, K. Electronic Structure Modeling of Electrochemical Reactions at Electrode/Electrolyte Interfaces in Lithium Ion Batteries. J. Phys. Chem. C 2013, 117, 1539-1547.
- (40) Qian, D.; Hinuma, Y.; Chen, H.; Du, L.-S.; Carroll, K.J.; Ceder, G.; Grey, C.P.; Meng, Y.S. Electronic Spin Transition in Nanosize Stochimetric Lithium Cobalt Oxide. J. Am. Chem. Soc. 2012, 134, 6096-6099.
- (41) Chen, M.K.Y.; Wolverton, C.; Greeley, J.P. First Principles Simulations of the Electrochemical Lithiation and Delithiation of Faceted Crystalline Silicon. J. Am. Chem. Soc. 2012, 134, 14362-14374.
- (42) Karim, A.; Fosse, S.; Persson, K.A. Surface Structure and Equilibrium Particle Shape of the LiMn2O4 Spinel from First-principles Calculations. Phys. Rev. B 2013, 87, 075322.
- (43) Leung, K.; Budzien, J.L. Ab initio Molecular Dynamics Simulations of the Initial Stages of Solid-Electrolyte Interphase Formation on Lithium Ion Battery Graphitic Anodes. Phys. Chem. Chem. Phys. 2010, 12, 6583-6586.
- (44) Ohzuku, T.; Iwakoshi, Y.; Sawai, K. Formation of Lithium-graphite Intercalation Compounds in Nonaqueous Electrolytes and their Application as a Negative Electrode for a Lithium Ion (Shuttlecock) Cell. J. Electrochem. Soc. 1993, 140, 2490-2498.
- (45) Leung, K.; Rempe, S.B.; von Lilienfeld, O.A. Ab initio Molecular Dynamics Calculations of Ion Hydration Free Energies. J Chem. Phys. 2009, 130, 204507.
- (46) Tazi, S.; Rotenberg, B.; Salanne, M.; Sprik, M.; Sulpizi, M. Absolute Acidity of Clay Edge Sites from Abi-initio Simulations. Geochim. Cosmochim. Acta 2012, 94, 1-11.
- (47) Sulpizi, M.; Gaigeot, M.-P.; Sprik, M. The Silica-Water Interface: How the Silanols Determine the Surface Acidity and Modulate the Water Properties. J. Chem. Theor. Comput 2012, 8, 1037-1047.
- (48) Motta, A.; Gaigeot, M.-P.; Costa, D. Ab initio Molecular Dynamics Study of the AlOOH Boehmite/Water Interface: Role of Steps in Interfacial Grotthus Proton Transfers. J. Phys. Chem. C 2012, 116, 12514-12524.
- (49) von Lilienfeld, O.A. First Principles View on Chemical Compound Space: Gaining Rigorous Atomistic Control of Molecular Properties. Int. J. Quant. Chem. 2013, 113, 1676-1689.
- (50) See, e.g., Shi, S.; Lu, Peng, Liu, Z.; Qi, Y.; Hector, L.G.; Li, H.; Harris, S.J. Direct Calculation of Li-Ion Transport in the Solid Electrolyte Interphase. J. Am. Soc. Chem. 2012, 134, 15476-15487, and references therein.
- (51) Ganesh, P.; Kent, P.R.C.; Jiang, D. Solid-Electrolyte Interphase Formation and Electrolyte Reduction at Li-Ion Battery Graphite Anodes: Insights from First-Principles Molecular Dynamics. J. Phys. Chem. C 2012, 116, 24476-24481.
- (52) Exceptions are calculations that include H+ and compensating on metal electrodes. See Ref. rossmeisl13, .
- (53) For a recent review of modeling of solid state cathode materials, see Meng, Y.S.; Arroyo-de Dompablo, M.E. First Principles Computatoinal Materials Design for Energy Storage Materials in Lithium Ion Batteries. Energy Envir. Sci. 2009, 2, 589-609.
- (54) Leung, K.; Qi, Y.; Zavadil, K.R.; Jung, Y.S.; Dillon, A.C.; Cavanagh, A.S.; Lee, S.H.; George, S.M. Using Atomic Layer Deposition to Hinder Solvent Decomposition in Lithium Ion Batteries: First-Principles Modeling and Experimental Studies. J. Am. Chem. Soc. 2011, 133, 14741-14754.
- (55) Leung K. First-Principles Modeling of the Initial Stages of Organic Solvent Decomposition on LixMn2O4(100) Surfaces. J. Phys. Chem. C 2012, 116, 9852-9861.
- (56) Abe, T.; Fukuda, H.; Iriyama, Y.; Ogumi, Z. Solvated Li-ion Transfer at Interface between Graphite and Electrolyte. J. Electrochem. Soc. 2004, 151, A1120-A1123.
- (57) Cresce, A.v.W.; Borodin, O.; Xu, K. Correlating Li+ Solvation Shealth Structure with Interphasial Chemistry on Graphite. J. Phys. Chem. C 2012, 116, 26111-26117.
- (58) Fatteberg, J.L.; Gygi, F. Density Functional Theory for Efficient Ab Initio Molecular Dynamics Simulations in Solution. J. Comput. Chem. 2002, 23, 662-666.
- (59) Andreussi, O.; Dabo I.; Marzari, N. Revised Self-consistent Continuum Solvation in Electronic-structure Calculations. J. Chem. Phys. 2012, 136, 064102.
- (60) Zhang, L.Q.; Liu, X.H.; Liu, Y.; Huang, S.; Zhu, T.; Gui, L.; Mao, S.X. Ye, Z.Z.; Wang, C.M. Sullivan, J.P.; Huang, J.Y. Controlling the Lithiation-Induced Strain and Charging Rate in Nanowire Electrodes by Coating. ACS Nano 2011, 5, 4800-4809.
- (61) Hummer, G.; Pratt, L.R.; Garcia, A.E. Ion Sizes and Finite-Size Corrections for Ionic-Solvation Free Energies. J. Chem. Phys. 1997, 107, 9275-9277.
- (62) In DFT/PBE simulations of water, it is well known that elevated temperature is needed to reproduce experimental pair correlation at T=300 K. See, e.g., Schwegler, E.; Grossman, J.C.; Gygi, F.; Galli, G. Towards an Assessment of the Accuracy of Density Functional Theory for First Principles Simulations of Water. II. J. Chem. Phys. 2004, 121, 5400-5409.
- (63) Kresse, G.; Furthmüller, J. Efficienct Iterative Schemes for Ab Initio Total-Energy Calculations Using a Plane-wave Basis Set. Phys. Rev. B 1996, 54, 11169.
- (64) Kresse, G.; Joubert, J. From Ultrasoft Pseudopotentials to the Porjector Augmented-Wave Method. Phys. Rev. B 1999, 59, 1758-1775.
- (65) Perdew, J.P.; Burke, K.; Ernzerhof, M. Generalized Gradient Approximation Made Simple. Phys. Rev. Lett. 1996, 77, 3865-3868.
- (66) Li, T.; Balbuena, P.B. Theoretical Studies of Lithium Perchlorate in Ethylene Carbonate, Propylene Carbonate, and Their Mixtures. J. Electrochem. Soc. 1999, 146, 3613-3622.
- (67) Martin, M.G.; Thompson, A.P. Industrial Property Prediction using Towhee and LAMMPS. Fluid Phase Equil. 2004, 217, 105-110.
- (68) Tenney, C.M.; Cygan, R.T. Analysis of Molecular Clusters in Simulations of Lithium-Ion Battery Electrolytes. J. Phys. Chem. C (submitted).
- (69) Johansson, P.; Jacobsson, P. Lithium Salt Dissociation in Non-aqueous Electrolytes Modeled by Ab Initio Calculations. Solid State Ionics 2006, 177, 2691-2697.
- (70) Bryantsev, V.S. Calculation of Solvation Free Energies of Li+ and O and Neutral Lithium-oxygen Compounds in Acetonitrile using Mixed Cluster/continuum Models. Theor. Chem. Acc. 2012, 131, 1250-1257.
- (71) Borodin, O.; Smith, G.D.. Quantum Chemistry and Molecular dynamics Simulation Study of Dimethyl Carbonate:Ethylene Carbonate Electrolytes Doped with LiPF6. J. Phys. Chem. B 2009, 113, 1763-1776.
- (72) Wilson, M.A.; Pohorille, A.; Pratt, L.R. Surface Potential of the Water Liquid-Vapor Interface. J. Chem. Phys. 1987, 88, 3281-3285.
- (73) Jungwirth, P.; Winter, B. Ions at Aqueous Interfaces: From Water Surface to Hydrated Proteins. Annu. Rev. Phys. Chem. 2008, 59, 1457-1463.
- (74) Zhu, L.; Hommet, F.; Salace, G.; Claude-Montigny, B.; Melrot, A. STM Observation of the Electro-adsorption of Lithium Ions onto Graphite and of the Ensuing Solid Electrolyte Interphase Formation. Sur. Sci. 2002, 512, 84-96.
- (75) See, e.g., Trasatti, S. Surface Science and Electrochemistry: Concepts and Problems. Sur. Sci. 1995, 335, 1-9.
- (76) Leung, K. Two-electron Reduction of Ethylene Carbonate: a Quantum Chemistry Re-examination of Mechanisms. Chem. Phys. Lett. 2013, 568-569, 1-8.
- (77) The “quantum mechanical push back” effect, operative at water-metal interfaces, is however likely less significant on graphite basal planes. See Bagus, P.S.; Staemmler, V.; Wöll, C. Exchangelike Effects for Closed-Shell Adsorbates: Interface Dipole and Work Function. Phys. Rev. Lett. 2002, 89, 096104.
- (78) Smith, G.D.; Borodin, O.; Russo, S.P.; Rees, R.J.; Hollenkamp, A.F. A Molecular Dynamics Simulation Study of LiFePO4/electrolyte interfaces: Structure and Li+ Transport in Carbonate and IOnic Liquid Electrolytes. Phys. Chem. Chem. Phys. 2008, 11, 9884-9897.
- (79) Persson, K.; Hinuma, Y.; Meng, Y.S.; van der Ven, A.; Ceder, G. Thermodynamic and Kinetic Properties of the Li-Graphite System from First Principles Calculations. Phys. Rev. B 2010 82, 125416.
- (80) Holzwarth, N.A.W.; Louie, S.G.; Rabii, S. Lithium-Intercalated Graphite: Self-consistent Electronic Structure for Stages One, Two, and Three. Phys. Rev. B 1983, 28, 1013-1025.
- (81) Grimme, S. Semi-empirical GGA-type Density Functional Constructed with a Long-range Dispersion Correction. J. Comp. Chem. 2006. 27, 1787-1799.