HCO+ and radio continuum emission from the star forming region G75.78+0.34
Rogemar A. Riffel111e-mail address: rogemar@ufsm.br & Everton Lüdke222e-mail address: eludke@hotmail.com
Universidade Federal de Santa Maria, Departamento de Física,
Centro de Ciências Naturais e Exatas, 97105-900, Santa Maria, RS, Brazil
Abstract
We present 1.3 and 3.6 cm radio continuum images and a HCO+ spectrum of the massive star forming region G75.78+0.34 obtained with the Very Large Array (VLA) and with the Berkley Illinois Maryland Association (BIMA) interferometer. Three structures were detected in the continuum emission: one associated to the well known cometary H ii region, plus two more compact structures located at 6′′ east and at 2′′ south of cometary H ii region. Using the total flux and intensity peak we estimated an electron density of 1.510, an emission measure of 610, a mass of ionized gas of and a diameter of 0.05 pc for the cometary H ii region, being typical values for an ultracompact H ii region. The HCO+ emission is probably originated from the molecular outflows previously observed in HCN and CO.
Keywords: Interstellar medium; Radio Continuum; Molecular emission; HII regions

1 Introduction
H ii regions are classified as ultracompact, compact and classical according to their sizes, ionized gas masses, densities and emission measures [e.g. 4]. Classical H ii regions such as the Orion nebulae have sizes of 10 pc, densities of 100 cm−3, 105 M⊙ of ionized gas and EM102 pc cm−6. Compact H ii regions have densities 103 cm−3, sizes of 0.5 pc, ionized gas mass of 1 M⊙ and EM107 pc cm-6 while Ultracompact H ii regions have sizes of 0.1 pc, and thermal electron densities of 104 cm−3, mass of ionized gas of 10-2 M⊙ and EM107 pc cm-6 [3, 8].
The study of the physical properties of H ii regions and their classification is a fundamental key to understand how they evolute and how stars form. The radio continuum emission at centimeter wavelengths traces the emission of the ionized gas. In the other hand, the study of the molecular gas next to H ii regions provides significant information about these objects and issues of star formation theory applied to these objects. So far, most of the studies of the molecular gas are based on CO emission, which has a low dipole moment, implying that low rotational transitions do not trace dense gas, while molecules with higher dipole moments can be used to observe high density gas. The high density cores () can be studied from mm and submm line emission of the HCN and HCO+ molecules [1].
In this work, we use 1.3 and 3.6 cm Very Large Array images to study the physical conditions of the gas in the ultracompact H ii region G75.78+0.34, as well as Berkley Illinois Maryland Association (BIMA) interferometric data at 3 mm. This object presents a well known molecular outflow observed in CO [17, 18] and HCN [13], is located the giant molecular cloud ON2 and was firstly identified by Matthews et al. [9] with observations at 5 and 10.7 GHz. Sánchez-Monge et al. [16] used the VLA observations to study the gas content of G75.78+0.34. They found radio emission coming from three components: a cometary ultracompact H ii region, excited by a B0 type star, and with no associated dust emission, an almost unresolved ultracompact H ii region, associated with a compact dust clump detected at millimetric and mid-infrared wavelengths and a compact source embedded in a dust condensation. The continuum emission at 3.5 mm of G75.78+0.34 is dominated by free-free emission from the ionized gas surrounding the exciting star and dust emission may contribute only with a small fraction of its 3.5 mm continuum [13].
This paper is organized as follows. In section 2 we describe the observations, section 3 presents our results, which are discussed in section 4. The conclusions of this work are presented in section 5.
2 Observations
2.1 The BIMA data
The observations of the emission of HCO at 89.1885 GHz and HCN at 88.63 GHz from G75.78+0.34 and G75.77+0.34 were performed with the Berkley Illinois Maryland Association (BIMA) interferometer Welch et al. [21] in June, 1999 using its shortest baseline configuration (D-array).
Mars and 3C273 observations were used as primary amplitude and bandpass calibrators and the data reduction followed standard procedures with the software miriad Sault, Teuben & Wright [15]. The full width at half maximum (FWHM) of the synthesized map is about 18 arcsec and the resulting velocity sampling is . The HCN emission has already been presented and discussed in Riffel & Lüdke [13], where more details about the observations and data reduction process can be found. Here, we present and discuss the spectrum for the HCO+.
2.2 Radio continuum images
We used Very Large Array (VLA) radio-continuum observations of G75.78+0.34 at 8.46 GHz (3.6 cm) and 22.46 GHz (1.3 cm) from the VLA data archive obtained using the interferometric array at configuration “A”. These observations were processed following the standard procedure of VLA radio continuum imaging processing using the NRAO Astronomical Image Processing System (aips). The angular resolution at these frequencies are 024 and 008 for 3.6 cm and 1.3 cm observations, respectively. These resolutions corresponds to a spatial resolution of pc and pc assuming a distance of 5.6 kpc to G75.78+0.34 [22] from which we estimate the sizes of the main components A, B and C are respectively 0.065, 0.013 and 0.027 pc.
3 Results
3.1 Continuum emission
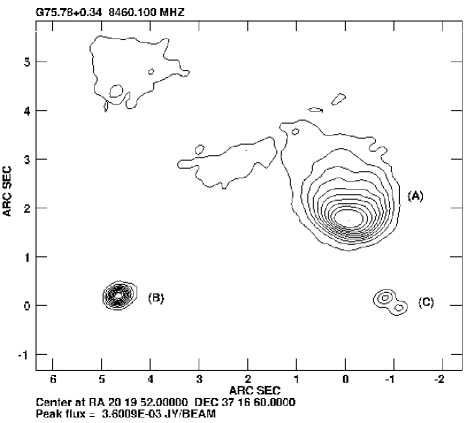
In Figure 1 we show the 1.3 cm continuum image of G75.78+34, showing thee components identified as A, B and C in the figure. Our image is in good agreement with the one presented by Sánchez-Monge et al. [16] using the same instrument configuration. The component A show a complex structure, being more extended to the north-south direction and presenting at least two knots of higher emission. It is associated to the cometary H ii region observed at 6 cm by Wood & Churchwell [22] and their image appears to be smoother than ours, probably because of its lower spatial resolution. In the other hand, the components B and C are more compact and were not detected at 6 cm. The component C is co-spatial with the water maser emission detected by Hofner & Churchwell [6].
The 3.6 cm image of G75.78+0.34 is shown in Figure 2, showing the same three components observed at the 1.3 cm image. The complex structure seen for the component A at 1.3 cm is not seen at 3.6 cm image, because of its lower spatial resolution. Our 3.6 cm image is very similar to the one shown by Wood & Churchwell [22]. The linear sizes of the components seen at 3.6 cm image are similar to those listed above for the 1.3 cm image.
| Component | A | B | C |
|---|---|---|---|
| Sν(1.3 cm) (mJy) | 42.4 | 8.6 | 8.2 |
| Sν(3.6 cm) (mJy) | 50.4 | 4.7 | 1.6 |
| Iν(1.3 cm) (mJy/beam) | 6.7 | 8.4 | 5.9 |
| Iν(3.6 cm) (mJy/beam) | 3.6 | 3.4 | 1.0 |
3.2 HCO+ line emission
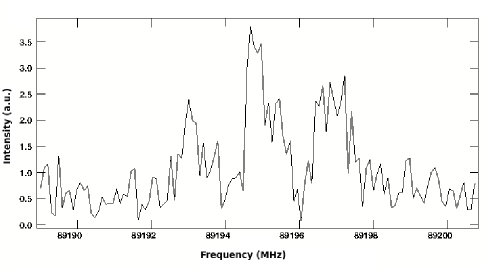
The signal-to-noise ratio of our BIMA observations was not high enough to construct emission line flux maps and channel maps across the HCO+ profile for BIMA in the closest spacing configuration with hybrid self-calibration and closure mapping, as we were able to do for the HCN in Riffel & Lüdke [13] discussed as our first results. The HCO+ spectrum is shown in figure 3 and it was obtained by integrating over the whole field of our BIMA observations and include both, G75.78+0.34 and G75.77+0.34 H ii regions. The HCO+ emission shows three intensity peaks, at 89.193, 89.195 and 89.197 GHz, suggesting the presence of HCO+ clouds with distinct kinematics.
4 Discussion
4.1 Ionized gas
The radio continuum images presented here can be used to investigate the properties of the ionized gas associated to G75.78+0.34. We can use the total fluxes and peak intensities from Table 1 to calculate some physical parameters for the component A associated to the cometary H ii region. Following Panagia & Walmsley [12] under the assumption that the H ii region has a roughly spherical geometry, we can obtain the electron density () by
| (1) |
where Sνis the total flux, is the electron temperature, is the distance to the object, is the angular radius in arcminutes and
The emission measure is given by the following equation
| (2) |
The mass of ionized gas can be obtained by [12]:
| (3) |
where is the abundance of He+ relative to H+.
The brightness temperature for a compact radio source is given by [e.g. 22]
where is the frequency, is the peak intensity in mJy/beam is the Boltzmann constant, and is the solid angle of the beam given by [e.g. 14]
| (4) |
where is the angular resolution of the observations in radians.
Finally, the optical depth () is estimated using
| (5) |
In order to obtain the physical parameters above, we assumed typical values for the electron temperature and abundance of =104 K and =0.07, respectively. Using the equations above and the angular resolutions of section 2, we obtain and = 1.710-13 sr for the 1.3 cm image and e = 1.5 10-12 sr for the 3.6 cm image. The radius () of the component A can be measured directly from Figures 1 and 2 and thus, we can estimate relevant physical parameters for G75.78+0.34.
| Parameter | 1.3 cm | 3.6 cm |
|---|---|---|
| (arcsec) | 0.9 | 1.2 |
| () | ||
| () | ||
| (K) | 2530 | 1100 |
| 0.29 | 0.12 | |
| Diameter (pc) | 0.05 | 0.06 |
In Table 2 we present the physical parameters estimated by the equations above, which can be compared with previous estimates from the literature. The values obtained for the electron density are in reasonable agreement with those obtained by Wood & Churchwell [22] from the 6 cm radio emission () and with the value obtained from 7 mm observations – [2], as well as with the one found by Sánchez-Monge et al. [16] from a multi-frequency study (). The emission measure found here is between the values found by Matthews, Andersson & Macdonald [10] of , by Wood & Churchwell [22] of and the one from Sánchez-Monge et al. [16] of . Wood & Churchwell [22] found and and thus, our values obtained from the 1.3 cm emission are in good agreement with theirs, while those estimated from the 3.6 cm are a bit smaller. The mass of G75.78+0.34 obtained here is about one order of magnitude smaller than the value found by Matthews, Andersson & Macdonald [10] and about one order of magnitude larger than the value obtained by Sánchez-Monge et al. [16], probably due to differences in the size of the region used to integrate the flux by these authors and by us, as well as due to the assumptions used in the calculations. The parameters presented in table 2 confirm that G75.78+0.34 is an ultracompact H ii region [8], confirming previous results of Sánchez-Monge et al. [16].
For the components B and C, we estimate the physical parameters using only the 1.3 cm image, since it has the highest spatial resolution. For the component B, we obtain cm-3, and a mass of ionized gas of M⊙, assuming a radius of 0.25 arcsec for the region. Assuming a radius of 0.4 arcsec for the component C, we obtain cm-3, and M⊙. These values are similar to those espected for ultracompact H ii regions [3, 8]. In fact, Sánchez-Monge et al. [16] identified the component C as being an ultracompact H ii region associated to dust emission in the millimetric and mid-infrared wavelengths, while the component B seems to be embedded in dust.
4.2 Molecular gas
Although, the signal-to-noise ratio of the HCO+ data was not high enough to construct flux and channel maps, as it has been done for the HCN in Riffel & Lüdke [13] using the same data, its detection can tell us some information about the star-forming region G75.78+0.34. The complex line profile shown in Fig. 3 suggests that the HCO+ emission is originated from gas with a disturbed kinematics and since it is usually originated from high density gas, the HCO+ emission may be tracing also the bipolar molecular outflows observed in HCN for G75.78+0.34 in our previous paper. A similar conclusion has been presented for the Serpens star-forming region using BIMA observations by Hogerheijde [5], for which it is found that the HCN and HCO+ present enhanced emission near outflows, while the N2H+ reflects the distribution of the cloud.
4.2.1 SEST observations and the non detection of SiO emission
Besides the BIMA data, we have also employed the Swedish-ESO Submillimeter Telescope (SEST) in 20th April 2003 in order to detect higher excitation lines like SiO (2-1 at 86.646 GHz), SiO (3-2 at 130.268 GHz) and SiO (5-4 at 217.104 GHz) and SiO (8-7, 347.330 GHz) to make a spectral line survey of maser emission from G75.78+0.34 and G75.77+0.34 at higher excitations. Even with longer integration times of about one hour per transition, we were unable to detect these lines at a confidence better than above the instrumental noise level.
On the other hand, the H13CN at 86.338 GHz was present in our SEST observations, presenting a similar profile than the one of the HCN (1-0) suggesting that the emission may occur within zones of similar physical and kinematical conditions. Our observations therefore suggest that SiO lines may not be good observational tracers of shock-driven outflows in G75.78+0.34.
This conclusion is supported in a similar result obtained for the star-forming core W3-SE using the Combined Array for Research in Millimeter-wave Astronomy (CARMA) by Zhu et al. [20], in which the authors report the detection of the HCO+ associated to outflows, while the SiO (2-1) line at 86.243 GHz was also not detected for W3-SE in independent observations. This certainly brings the fact that there are difficulties in using SiO to obtain information on the astrophysical conditions of this compact object within the production of SiO by destruction of dust grains by radiatively-driven MHD shock front from young and massive stars.
On the other hand, we must emphasize that there are several works for UCH ii regions and more evolved objects showing that the SiO is a good tracer of outflows [e.g. 7, 11, 19] and a possible explanation for the absence of excited SiO lines in G75.78+0.34 could be due to low sensitivity of the SEST observations. New and more sensitivity observations are henceforth needed to better constrain the SiO emission or its absence in G75.78+0.34 and to unravel such apparently contradictory statements.
5 Conclusions
We studied the radio continuum and molecular emission from the star forming region G75.78+0.34 using VLA and BIMA observations. Our main conclusions are:
-
•
The 3.6 and 1.3 cm radio continuum images for the H ii region G75.78+0.34 present three components, one associated to the cometary H ii region, other located at 6′′ east of the cometary H ii region and another structure located at 2′′ south of it.
-
•
The cometary H ii region present an electron density of 1.510, an emission measure of 610, ionized gas of and a diameter of 0.05 pc, consistent with the values expected for an Ultracompact H ii region.
-
•
The HCO+ (J=1-0) seems to be originated from the gas which follows the same astrophysical conditions of outflows previously observed in main HCN transitions. Nevertheless, new interferometric observations with enhanced sensitivity and resolution are needed to better constraint the HCO+ origin in G75.78+0.34.
-
•
The SiO higher transitions up to 200 GHz were not detected using single dish observations with SEST of G75.78+0.34, suggesting that either it is not a good tracer of outflows in dense cores or that more sensitivity is needed at those relevant frequencies.
Acknowledgments:
We thank the referee for valuable suggestions that helped to improve the present paper. E. Lüdke particularly would like to thank the BIMA Staff and the SEST Observing Team at ESO La Silla for comments which improved the observations. The SEST Radiotelescope was operated by Onsala Radio Observatory/Sweden. The Very Large Array is a facility operated by the National Radio Astronomy Observatory under cooperative agreement by Associated Universities Inc. and the National Science Foundation.
The authors have been partially supported by the Brazilian institutions CNPq, CAPES and FAPERGS.
Conflict of Interests:
The authors declare that there is no conflict of interests regarding the publication of this article.
References
- Afonso, Yun & Clemens [1998] Afonso, J. M., Yun, J. L., & Clemens, D. P., 1998, AJ, 115, 1111
- Carral et al. [1997] Carral, P., Kurtz, S. E., Rodríguez, L. F., De Pree, C., & Hofner, P., 1997, ApJ, 486, L103.
- Franco et al. [2000] Franco, J., Kurtz, S., García-Segura, G., & Hofner, P., 2000, ApSS, 272, 179.
- Habing & Israel [1979] Habing, H. J., Israel, F. P., 1979, ARAA, 17, 345.
- Hogerheijde [2002] Hogerheijde, M. R. 2003, SFChem 2002: Chemistry as a Diagnostic of Star Formation, proceedings of a conference held August 21-23, 2002 at University of Waterloo, Waterloo, Ontario, Canada N2L 3G1. Edited by Charles L. Curry and Michel Fich. NRC Press, Ottawa, Canada, 305.
- Hofner & Churchwell [1996] Hofner, P., & Churchwell, E., 1996, A&AS, 120, 286.
- Kumar, Tafalla & Bachller [2004] Kumar, M. S. N., Tafalla, M. & Bachller, R., 2004, A&A, 426, 195.
- Kurtz [2005] Kurtz, S., 2005, Proceedings IAU Symposium 227, Massive Star Birth: A Crossroads of Astrophysics, R. Cesaroni, M. Felli, E., Churchwell & C. M. Walmsley, eds. pg. 111.
- Matthews et al. [1973] Matthews, H. E., Goss, W. M., Winnberg, A., Habing, H. J., 1973, A&A, 29, 309.
- Matthews, Andersson & Macdonald [1986] Matthews, N., Andersson, M., Macdonald, G. H., 1986, A&A, 155, 99.
- Minh et al. [2010] Minh, Y. C., Su, Y.-N., Chen, H.-R., Liu, S.-Y., Yan, C.-H., Kim, S.-J., 2010, ApJ, 723, 1231.
- Panagia & Walmsley [1978] Panagia, N. & Walmsey, C. M.,1978, A&A, 70, 711.
- Riffel & Lüdke [2010] Riffel, R. A., & Lüdke, E., 2010, MNRAS, 404, 1449.
- Rohlfs & Wilson [2000] Rohlfs, K., & Wilson, T. L., 2000, Tools of Radio Astronomy Springer-Verlag.
- Sault, Teuben & Wright [1995] Sault, R.J., Teuben, P.J. & Wright, M.C.H., 1995, In Astronomical Data Analysis Software and Systems IV, ed. R. Shaw, H.E. Payne, J.J.E. Hayes, ASP Conference Series, 77, 433-436.
- Sánchez-Monge et al. [2013] Sánchez-Monge, A., Kurtz, S., Palau, A., Estalella, R., Shepherd, D., Lizano, S., Franco, J., Garay, G., 2013, ApJ, 766, 114.
- Shepherd & Churchwell [1996] Shepherd, D. S., & Churchwell, E., 1996, ApJ, 472, 225.
- Shepherd, Churchwell & Wilner [1997] Shepherd, D. S., Churchwell, E., & Wilner, D. J., 1997, ApJ, 482, 355.
- Zapata et al. [2008] Zapata, L. A., Leurini, S., Menten, K. M., Schilke, P., Rolffs, R., Hieret, C., 2008, A&A, 479, 25.
- Zhu et al. [2010] Zhu, L., Wright, M.C.H., Zhao, J., Wu, Y, 2010, ApJ, 712, 674.
- Welch et al. [1996] Welch W. J. et al., 1996, PASP, 108, 93.
- Wood & Churchwell [1989] Wood, D. O. S., & Churchwell, E., 1989, ApJs, 69, 831.