11email: akimasa.kataoka@nao.ac.jp 22institutetext: National Astronomical Observatory of Japan, Mitaka, Tokyo 181-8588, Japan 33institutetext: Department of Earth and Planetary Sciences, Tokyo Institute of Technology, Meguro, Tokyo, 152-8551, Japan 44institutetext: Institute of Low Temperature Science, Hokkaido University, Kita, Sapporo 060-0819, Japan
Opacity of fluffy dust aggregates
Abstract
Context. Dust grains coagulate to form dust aggregates in protoplanetary disks. Their porosity can be extremely high in the disks. Although disk emission may come from fluffy dust aggregates, the emission has been modeled with compact grains.
Aims. We aim to reveal the mass opacity of fluffy aggregates from infrared to millimeter wavelengths with the filling factor ranging from 1 down to .
Methods. We use Mie calculations with an effective medium theory. The monomers are assumed to be 0.1 sized grains, which is much shorter than the wavelengths that we focus on.
Results. We find that the absorption mass opacity of fluffy aggregates are characterized by the product , where is the dust radius and is the filling factor, except for the interference structure. The scattering mass opacity is also characterized by at short wavelengths while it is higher in more fluffy aggregates at long wavelengths. We also derive the analytic formula of the mass opacity and find that it reproduces the Mie calculations. We also calculate the expected difference of the emission between compact and fluffy aggregates in protoplanetary disks with a simple dust growth and drift model. We find that compact grains and fluffy aggregates can be distinguished by the radial distribution of the opacity index . The previous observation of the radial distribution of is consistent with the fluffy case, but more observations are required to distinguish between fluffy or compact. In addition, we find that the scattered light would be another way to distinguish between compact grains and fluffy aggregates.
Key Words.:
planets and satellites: formation – methods: numerical and analytical – protoplanetary disks1 introduction
Optical properties of dust grains have been investigated by many authors to understand the emission from various kinds of astronomical objects. In protoplanetary disks, dust grains are important not only as the emitter of radiation, but also as the seeds of planets. The size of dust grains increases by coagulation from submicron size to millimeter size or larger. A number of radio observations suggest that dust grains have been grown to millimeter-sized grains in protoplanetary disks (Andrews & Williams 2005; Isella et al. 2009; Ricci et al. 2010b, a; Guilloteau et al. 2011; van der Marel et al. 2013).
The silicate feature at 10 is evidence of grain growth (e.g., van Boekel et al. 2005). The infrared observations suggest that the size of silicate dust grains is spreading from to a few . The infrared emission is expected to come from the surface region of protoplanetary disks. Tiny grains are kinematically well coupled to the disk gas and thus stirred up to the disk surface. Thus, we cannot carry out information of dust grains larger than the micron size from infrared observations. In addition, infrared scattered light images of protoplanetary disks are less luminous than expected from other observations. This may infer the presence of large compact grains or porous aggregates at the disk surface (Mulders et al. 2013).
The opacity index at submillimeter wavelengths is used as another clue of grain growth (Beckwith et al. 1990; Beckwith & Sargent 1991; Miyake & Nakagawa 1993). The most striking evidence of dust growth is the opacity index , where ; is estimated from observed flux slope , where . If the dust emission is optically thin, the dust slope has a relation of . The index is typically from 1 to 0 in protoplanetary disks, which means grain growth in protoplanetary disks (Andrews & Williams 2005; Lommen et al. 2010; Pérez et al. 2012). The recent observations using radio interferometers have revealed the radial profile of . Pérez et al. (2012) made a model fit of and suggested that is different between in the inner and outer part of the disk. Thus, the dust grains in the inner part of the disk are expected to grow to a larger size.
Although the protoplanetary disk emissions are usually modeled with compact dust grains, recent numerical simulations have shown that dust grains coagulate to form fluffy structure, especially in the case of icy dust aggregates. With low speed collisions, dust grains form fluffy aggregates. However, it has been shown that aggregate are not effective in compressing the fluffy dust aggregates. Wada et al. (2008) and Suyama et al. (2008, 2012) investigated collisional compression of icy dust aggregates, and Okuzumi et al. (2012) performed coagulation simulations including the collisional compression. They revealed that the initial fractal growth stops when the collisional energy exceeds the rolling energy. They derived that the achievable lowest filling factor is , where is the aggregate mass when the impact energy is equal to the rolling energy. Moreover, Kataoka et al. (2013a, b) introduced the static compression of dust aggregates. They showed that the filling factor decreases to as low as even when considering the effects of the static compression. However, the porosity evolution of icy dust aggregates has not been confirmed by laboratory experiments yet.
The icy and fluffy aggregates are expected to overcome theoretical problems in planetesimal formation. Fluffy aggregates are expected to overcome the radial drift barrier (Okuzumi et al. 2012; Kataoka et al. 2013b) and the bouncing barrier (Wada et al. 2011). Moreover, if particles are composed of ice, the dust aggregates overcome the fragmentation barrier because they are sticky (Wada et al. 2009, 2013).
Dust coagulation has also been investigated in laboratory experiments. As an analog to silicate dust grains, which are expected to be inside the snowline in protoplanetary disks, silica particles have been used in laboratory experiments. Conditions for bouncing and fragmentation have been studied in laboratory experiments (Blum & Wurm 2008; Zsom et al. 2010) and some scenarios for planetesimal formation breaking through the bouncing barrier have been proposed (Windmark et al. 2012; Dra̧żkowska et al. 2013). From the viewpoint of porosity evolution, silicate dust aggregates are expected to be less fluffy than icy dust aggregates because the surface energy of silicate is lower than ice. Microgravity experiments have confirmed the hit-and-stick process of forming fluffy dust aggregates (Kothe et al. 2013). However, further growth concerning compression is still uncertain in laboratory experiments. Zsom et al. (2011) performed numerical simulations of dust coagulation of silicate particles, using the hit-and-stick model proposed by Okuzumi et al. (2009). They showed that the filling factor of dust aggregates can reach before the onset of compaction. 111 Zsom et al. (2010) obtained less fluffy aggregates than Zsom et al. (2011) because Zsom et al. (2010) adopted the porosity model proposed by Ormel et al. (2007), which is not as accurate as the model of Okuzumi et al. (2009).
Observational constraints of porosity of dust aggregates in protoplanetary disks are important. However, studies of interpreting disk observations have assumed (e.g., Birnstiel et al. 2010), which is relatively compact compared with the extremely porous aggregates, whose filling factor is , as discussed above. In this paper, as a first step to constrain the porosity of dust aggregates in protoplanetary disks, we investigate optical properties of dust aggregates including the extremely porous aggregates.
Opacity of porous aggregates has been investigated by several theoretical methods. In the context of explaining cometary dust, scattering properties of BPCA and BCCA aggregates have been studied (Kimura et al. 2003, 2006; Kolokolova et al. 2007). The number of constituent particles was limited to ( g in mass if the particle size is 0.1 ), and the opacity was only studied at infrared wavelengths. In the context of explaining the interstellar silicate feature, in addition, the effects of monomer shapes on optical properties at infrared wavelength have been also studied (Min et al. 2003, 2005, 2007). In this paper, we examine the absorption and scattering mass opacities of dust aggregates at wavelengths ranging from to 10 cm. The aggregates have a size ranging from micron to kilometer and a filling factor ranging from 1 to .
One of the popular methods for calculating the mass opacity of porous aggregates is the discrete dipole approximation (DDA) (Draine & Flatau 1994; Min et al. 2006). This calculation takes a huge computational time for large aggregates. To investigate the opacities of highly porous aggregates for a wide size range, the method would not be suitable. In this paper, we aim to reveal the mass opacity of fluffy aggregates from infrared to millimeter wavelengths with the filling factor ranging from 1 down to . Thus, we use the effective medium theory (EMT). This method is fast in calculation but inaccurate in some parameters. Kozasa et al. (1992) have shown that EMT reproduces the absorption opacity of BCCA and BPCA clusters, whose constituent monomers are up to 1024, within a error of a factor of two. The EMT is also known to be accurate for porous aggregates whose constituent particles are small compared with the wavelength of incident radiation (Voshchinnikov et al. 2005; Shen et al. 2008). Because the dust aggregates considered in this paper are highly porous aggregates consisting of submicron-sized monomers, EMT would be a good approximation for calculations in this paper. We note that the scattering opacity derived with EMT largely deviates from the actual value in some parameter space (Shen et al. 2009). The accuracy of EMT in a large parameter space should be tested in the future work.
This paper is organized as follows. We describe the composition of dust grains and the calculating method of mass opacities in Section 2. We show the results of the absorption and scattering mass opacities of highly porous aggregates by using Mie theory with EMT in Section 3. We derive analytic formulae to reproduce the results in Section 4. Then, we construct a simple dust growth and drift model in protoplanetary disks and propose a method to distinguish compact and fluffy aggregates in radio observations by using the slope at millimeter wavelengths, the so-called dust , in Section 5. Finally, we summarize and discuss the previous observations with porous aggregates in Section 6.
2 Method
Here, we briefly summarize the definitions of optical properties following Bohren & Huffman (1983, hereafter BH83) and Miyake & Nakagawa (1993). We consider a particle or an aggregate with radius and internal mass density . The radius of an aggregate represents the characteristic radius, defined as , where is the gyration radius (Mukai et al. 1992). We define the size parameter as
| (1) |
where is the wavelength. We also define the relative refractive index as
| (2) |
where and are the real and imaginary parts of the refractive index, respectively.
2.1 Dust grains: monomers
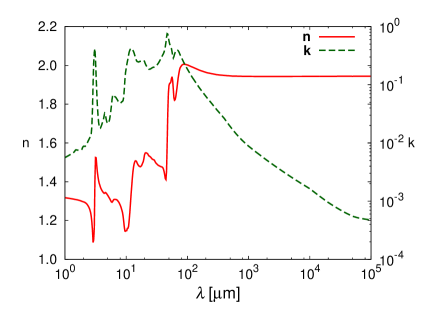
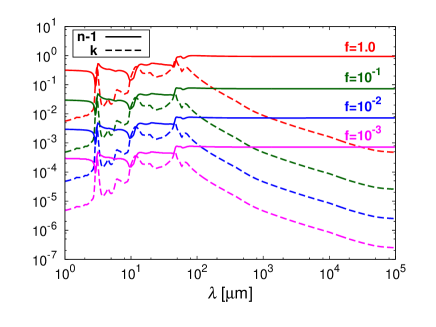
We consider a dust aggregate, which consists of a number of monomers. The monomers are assumed to be composed of silicate, organics, and water ice without any void structure. The mass fractional abundance is set to be consistent with Pollack et al. (1994), where , , and . The internal densities of silicate, organics, and ice are taken to be , , and , respectively. The mean internal density is therefore . The resultant volume fractions are 8 % of silicate, 26 % of organics, and 66 % of water ice. We use the refractive index of astronomical silicate from Weingartner & Draine (2001), organics from Pollack et al. (1994), and water ice from Warren (1984).
Here, we discuss the structure of a monomer composed of various materials. We assume that the monomer has a core-mantle structure, where silicate components are inside and ice and organics cover the silicate core. This assumption is reasonable because the condensation temperature of silicates is much higher than those of ices and organics. 222 The material properties of organics, such as surface energy and Young’s modulus, are still uncertain, but it is considered to be similar to those of ice (e.g., Kudo et al. 2002). The collisional and static compression and fragmentation velocity are determined by the surface material of monomers, which is expected to be ice or organics. Therefore, the structure and fluffiness of the aggregates are expected to be similar to icy aggregates (Okuzumi et al. 2012; Kataoka et al. 2013b).
The effective refractive index of the mixture can be derived from dielectric functions. By using Maxwell-Garnett rule without voids, the effective dielectric function is obtained as
| (3) |
where
| (4) |
and and represent the volume filling factor and the dielectric function of each species. The dielectric function is related to the refractive index as .
Figure 1 shows the real and imaginary part of the effective refractive index of the mixture. We use this effective refractive index as the material refractive index in the following discussion.
The simplified fractional abundance based on Pollack et al. (1994) has been widely used in several papers (e.g., D’Alessio et al. 2001; Tanaka et al. 2005; Isella et al. 2009; Ricci et al. 2010b, a; Pérez et al. 2012). Some recent studies use the dielectric functions of carbonaceous material (Zubko et al. 1996) instead of organics (Pollack et al. 1994; Li & Greenberg 1997). In protoplanetary disks, the carbonaceous materials would interact with other species to produce organics. Thus, we use the dielectric function of organics based on Pollack et al. (1994) in this paper. However, the optical properties of organics in protoplanetary disks have large uncertainties because astronomical organics may be different from laboratory data.
2.2 Aggregates of monomers
To calculate the opacity of fluffy aggregates, we use the effective medium theory again. In the case of the mixture of monomers and voids, Maxwell-Garnett theory is applicable to obtain the effective dielectric function as
| (5) |
where
| (6) |
is the effective dielectric function of the mixture, and is the volume filling factor of the aggregate.
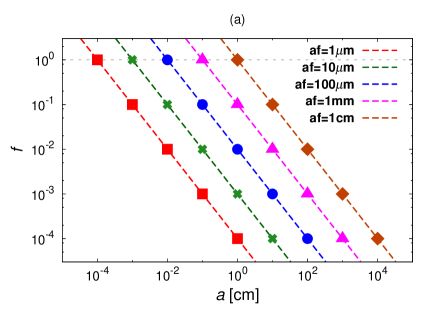
We will investigate the mass opacity of dust aggregates for a wide range of the dust radius and the filling factor . We adopt the Mie calculation with the effective medium theory described above. Voshchinnikov et al. (2005) show that the EMT is a good approximation when the inclusions are smaller than the wavelengths of radiation. Here, the monomer size is while the wavelengths are larger than 1 . Thus, the EMT would be a good approximation in the calculations in this paper. The filling factor is expected to decrease to and the dust radius grows from micron to kilometer (Kataoka et al. 2013b). Therefore, we will investigate the mass opacity in such parameter space.
We note that we do not choose a set of and where both and are too small. In the porosity evolution scenario proposed by Kataoka et al. (2013b), the dust aggregates grow as fractals in the very early stage of the coagulation. This stage corresponds to the lower limit of and . In this paper, we consider a set of and where .
2.3 Mass opacity
We use the Mie calculation with the effective medium theory to calculate dimensionless absorption and scattering coefficients and . Then, we obtain absorption and scattering mass opacities defined as
| (7) |
| (8) |
We note that the mass opacities are given per gram of dust. To obtain the mass opacities per gram of gas, one should divide the mass opacities by the dust-to-gas mass ratio.
3 Results
3.1 Absorption mass opacity
The absorption mass opacity of porous dust aggregates strongly depends on their size and filling factor. In protoplanetary disks, radio emission at millimeter wavelengths provide optically thin emission, in other words, directly reflects the opacity. Therefore, we aim to reveal what properties of dust aggregates determine the mass opacity.
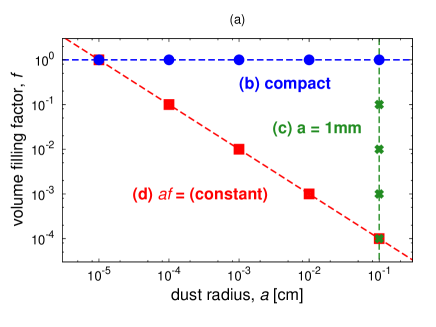
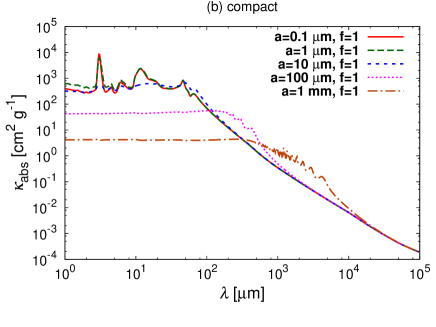
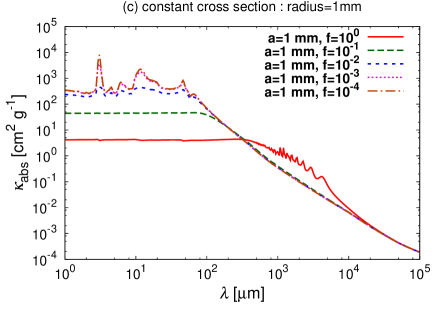
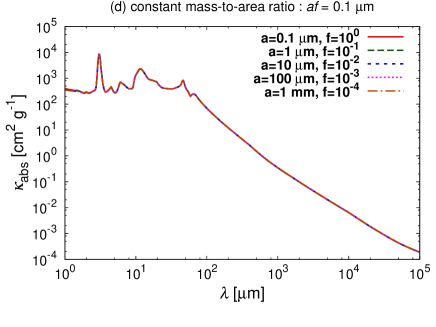
Figure 2 shows the dependency of the mass opacities of dust aggregates on the dust radius and the filling factor . Figure 2 (b) shows the mass opacity of different dust radius while the filling factor is fixed at unity (i.e., compact growth). The absorption mass opacity from optical to infrared wavelengths decreases as the aggregate size increases, and it has an enhancement because of the interference at the millimeter wavelengths depending on the aggregate size. This trend is well-known as the grain-growth effects on the dust opacity. Figure 2 (c) shows the mass opacity of different filling factors while the dust radius is fixed at mm. The mass opacity strongly depends on the filling factor but cannot be characterized by one parameter. Figure 2 (d) shows that the mass opacity when both and change but remains constant. The mass opacity is almost the same in this case. This result suggests that the optical properties of fluffy dust aggregates are characterized by .
Here, we introduce a new parameter , where is the dust radius and is the filling factor. Keeping constant corresponds to the constant mass-to-area ratio of the dust aggregates because (mass-to-area ratio) . We already find that the mass opacity is characterized by in the case of in Fig. 2 (d). Next, we investigate whether the mass opacity is characterized by one parameter in the wide range of .
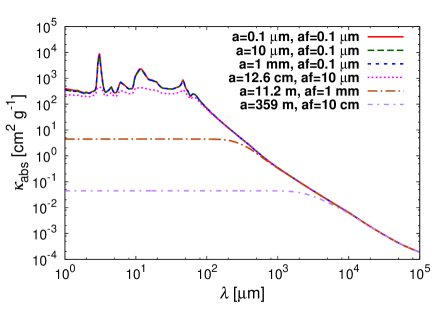
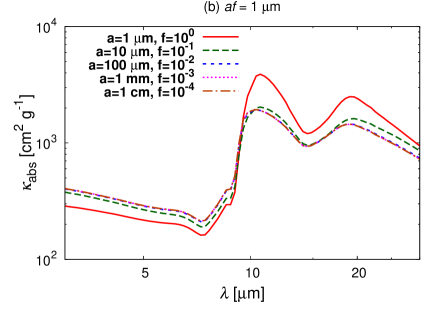
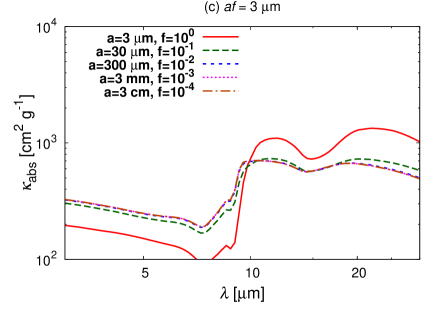
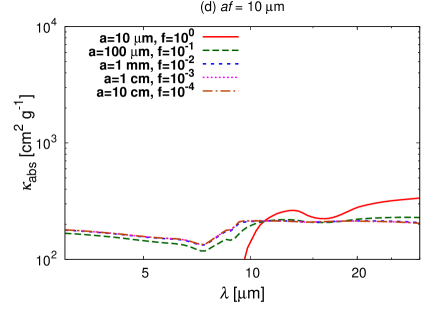
Figure 3 shows the mass opacity where is fixed for each panel: has values of , , , , and .
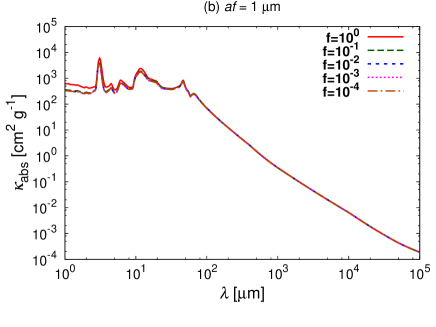
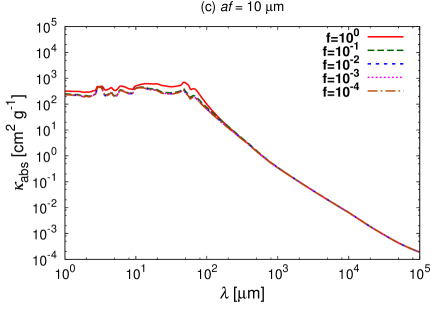
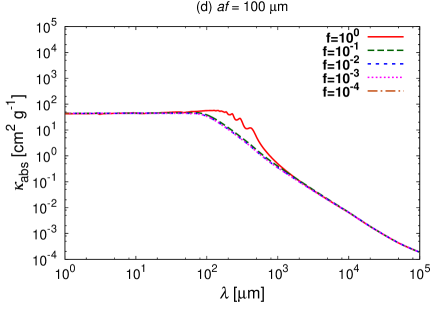
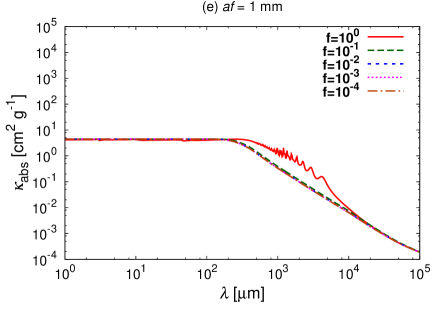
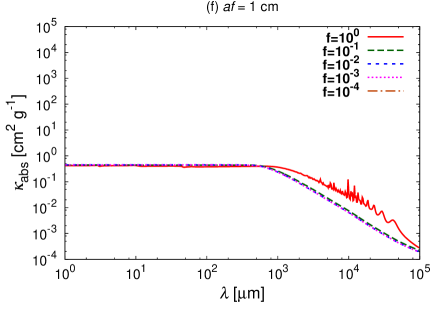
This figure clearly shows that the absorption mass opacity is almost the same in the cases of the same . For example, dust aggregates that have a size of 10 m and a filling factor of are optically equivalent to 1 mm compact grains except for the interference structure. We will show the reason why the absorption mass opacity is characterized by in Section 4.
That the absorption mass opacity is characterized by is a very naive result for observations: the filling factor cannot be measured because it is degenerated with the dust radius. Therefore, to derive both the filling factor and the dust radius separately, we should find another clue rather than the general behavior of the absorption mass opacity. We find two differences which might be ways to distinguish between and : the interference structure of the absorption mass opacity and the scattering mass opacity at long wavelengths. We discuss the interference first and will discuss the scattering mass opacity later in this section.
The only difference in the absorption mass opacity between the compact and fluffy cases if is the same is the interference structure, which appears when the size parameter is close to unity. In the case of 1 mm, for example, the absorption mass opacity in the compact case is one order of magnitude higher than the fluffy cases. This is a way to distinguish between compact grains and fluffy aggregates in protoplanetary disks. We will discuss the reason why the interference structure is unique only in the compact case in Section 4, and also discuss the feature as a way to distinguish between compact and fluffy aggregates by using the dust opacity index in Section 5.
3.2 Scattering mass opacity
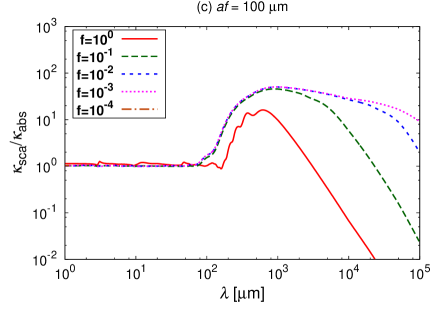
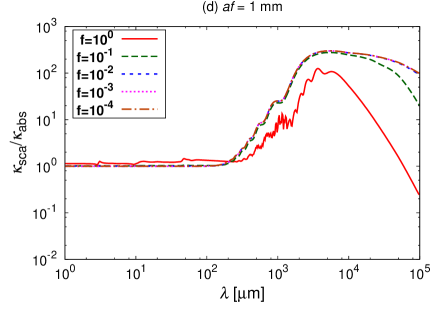
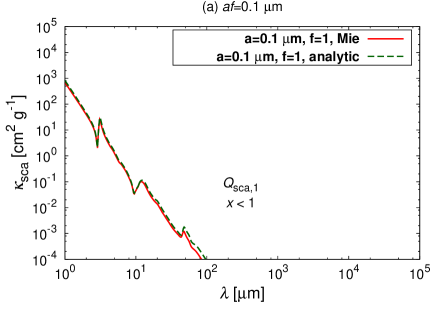
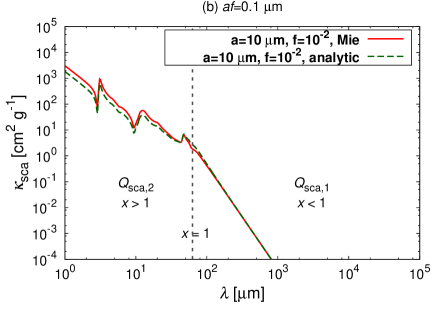
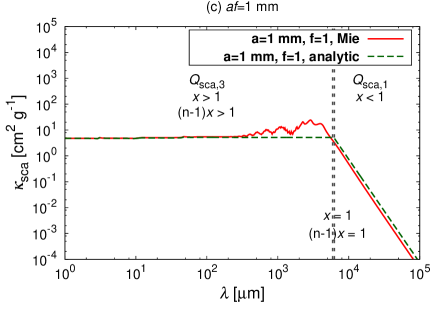
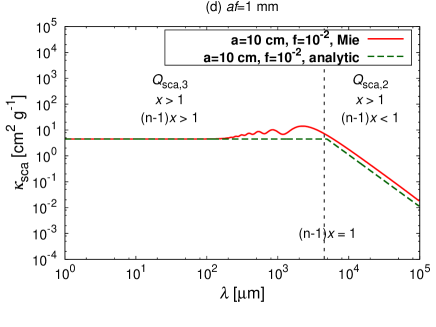
We also calculate the scattering mass opacity by using Mie calculations. Figure 4 shows the scattering mass opacities in the case of , , , and .
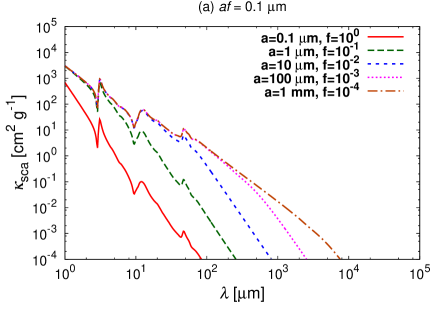
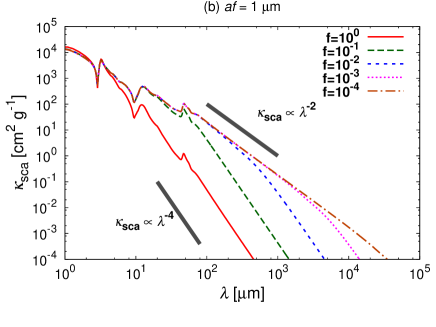
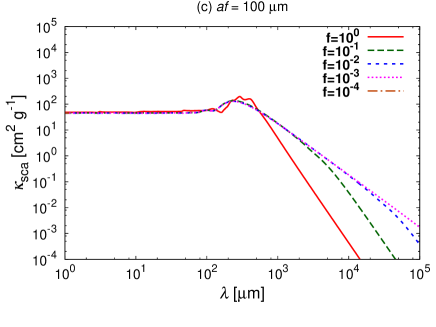
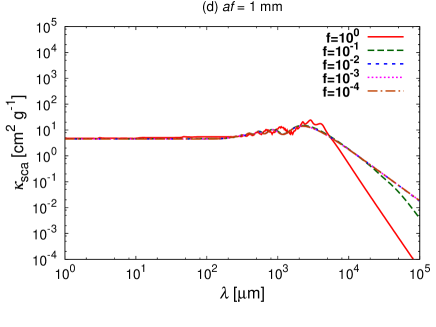
This figure suggests that the scattering mass opacity is not characterized by at the longer wavelengths. At the shorter wavelengths, the mass opacity corresponds to the geometric cross section. In the compact case, the mass opacity scales as at the longer wavelengths. On the other hand, in the fluffy case, the mass opacity scales as at the inter mediate wavelengths, then scales as at the longer wavelengths. We will come back to this point with a physical explanation in Section 4.
As shown in Figure 4, the scattering mass opacity of the fluffy aggregates is expected to be higher than the compact case at the longer wavelengths even when the absorption mass opacity is almost the same. Thus, we investigate the ratio of against . Figure 5 shows the ratio in each case corresponding to Fig. 4.
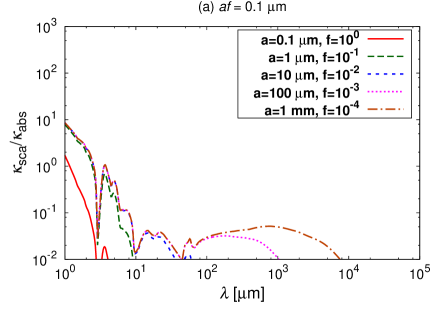
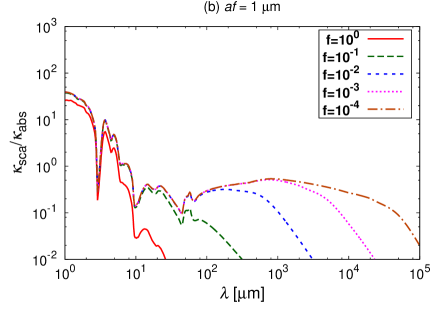
In the case of compact and , the scattering mass opacity is less than absorption. On the other hand, the scattering mass opacity dominates the absorption mass opacity in fluffy cases when . This greatly affects the infrared observations of dust grains. For example, Pagani et al. (2010) reported that dust grains in dense interstellar medium is composed of micron-sized grains (and not ) because of the high scattering efficiency observed by the Spitzer space telescope. Thus, they infer that the monomer size must be micron. However, figure 5 suggests that even if the monomers are in size, the aggregates of sized monomers represent the high albedo and thus might account for the observed high efficiency of scattering.
Figures 5 (c) and (d) show the scattering mass opacity in the case of and . The scattering mass opacity at the millimeter wavelengths is ten times larger than the absorption mass opacity in the compact case, and it is tens of times larger in the fluffy cases. This suggests that the millimeter continuum emission is dominated not by direct thermal emission, but by scattered emission in transition disks if the dust aggregates are grown to have a millimeter size. Moreover, determining the ratio of the scattering mass opacity over the absorption mass opacity at the millimeter wavelengths is a way to characterizing the porosity of the dust aggregates.
4 Analytic formulae of the opacities
In the previous section, we used the Mie calculations to obtain the mass opacity. In this section, we derive the analytic formulae of the mass opacity and compare them to the results of Mie calculations. By deriving analytic formulae, we explain why the mass opacity can be characterized by . In addition, the analytic formulae would be a computationally less expensive method to calculate the opacity of large aggregates.
4.1 Approximation of refractive index
When we consider fluffy aggregates, the filling factor satisfies . If , from Eq. (5) and , we obtain
| (9) | |||||
| (10) |
to the first order of . From these equations, we obtain that and in the case of fluffy aggregates where . We check the validity of the relations in Appendix A.1.
We do not assume when deriving the analytic formulae. After deriving the formulae, we assume and use the relations of and to explain why the mass opacity is characterized by .
4.2 Absorption mass opacity
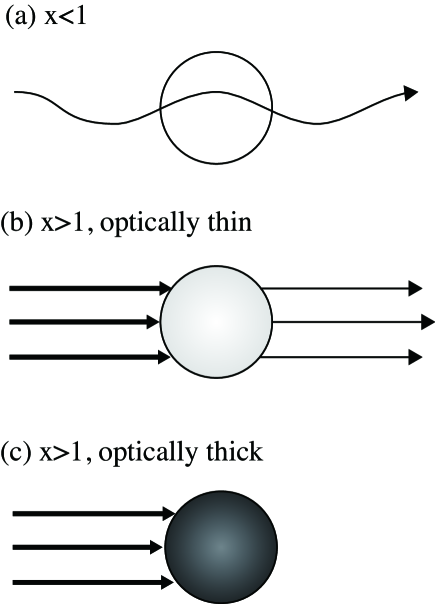
We derive the approximated formulae of in three limited cases, illustrated in Fig. 6: (1) , (2) and optically thin () media, and (3) and optically thick () media. We note that the absorption mass opacity is divided by the mass-to-area ratio of the aggregates.
4.2.1
When the dust radius is much smaller than the wavelength , the opacity goes into Reyleigh regime. This corresponds to . In this case, can be written as
| (11) |
(see Eq. (5.11) in BH83). The imaginary part of the refractive index is much smaller than the real part (see Fig. 1 and Fig. 15). So, we can approximate as
| (12) |
This equation explains the fact that the absorption mass opacity is characterized by mass-to-area ratio or . At the longer wavelengths, is almost unity while . Using , we obtain that is proportional to , which is mass-to-area ratio. Since is divided by mass-to-area ratio, is independent of dust properties.
4.2.2 and optically thin
When the dust radius is much larger than the wavelength , the opacity goes into geometric optics regime. In this regime, the optical properties can be understood by tracing the ray inside the material. The fraction of energy that transmits the material is where , and is the path of the ray inside the material. If , the incident light is weakly absorbed by the material because it is optically thin on the ray. We set the length , the diameter of the sphere. Thus, the condition corresponds to .
In the limit of (or equivalently ) and optically thin, we obtain
| (13) |
(see Eq. (7.2) in BH83).
We note that if , which is usually satisfied in the case of fluffy medium, yields
| (14) |
This equation is also characterized by the mass-to-area ratio or because and . We also note that the analytic formula between optically thick and thin regimes should be changed when is unity. Thus, we define optically thin as .
4.2.3 and optically thick
In the limit of (equivalent to ) and optically thick (), on the other hand, the absorption coefficient is described as
| (15) |
where the reflectance is written as
| (16) |
and
| (17) |
(see Eq. (2.71), Eq. (7.5), and Eq. (7.7) in BH83). This regime is valid at shorter wavelengths (see Appendix A.3 for the optical depth of the aggregate). As shown in Appendix A.2, : for compact case and for . These values are regarded as unity in application to astronomical observations. Therefore, for most cases: the absorption cross section yields the geometric cross section. Because has no dependency on and , is characterized by .
4.2.4 Analytic formula of absorption mass opacity
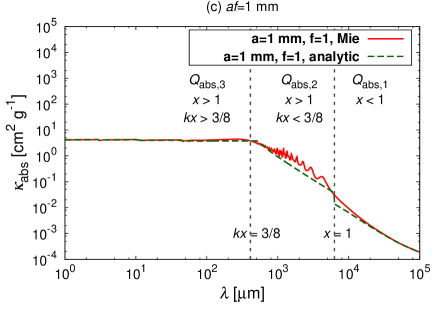
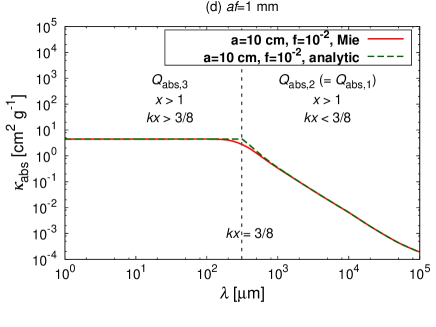
Combining the three limiting regimes, we obtain the analytic formula of the absorption mass opacity of dust aggregates as
| (18) |
Figure 7 shows the absorption mass opacities calculated with both the Mie calculation and the analytic formula.
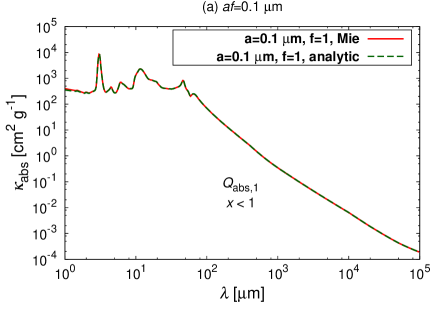
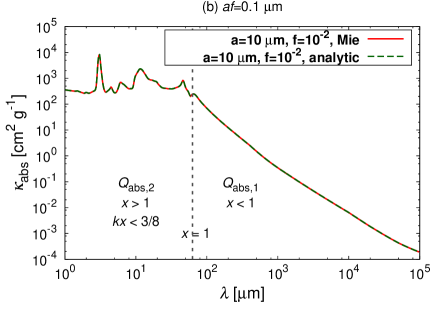
The absorption mass opacity of Figs. 7 (a) and (b) are the same because but only the filling factor is different ( and ), as shown in the previous sections (see Fig. 3). Figure 7 (a) shows the case of and (compact). The whole wavelengths in this panel satisfy , and thus . The analytic formula greatly reproduce the Mie calculations. Figure 7 (b) shows the case of and (fluffy). In this case, , and thus at . We use for and for and connect them at . This also reproduces the Mie calculation.
Figures 7 (c) and (d) show the case of , but the filling factor is 1 and 0.01, respectively. The absorption mass opacity of Figs. 7 (c) and (d) are almost the same except for the interference structure. The interference structure corresponds to where and , the optically-thin geometric optics regime. We note that the difference between the Mie calculation and the analytic formulae is the interference structure. In Fig. 7 (c), which is the compact case, the real part of the refractive index is greater than unity. Thus, has an enhancement because of the interference. In Fig. 7 (d), which is the fluffy case, on the other hand, the real part of the refractive index is almost unity and thus no enhancement appears and smoothly connects to region at the longer wavelengths. From the analytic formula, we conclude that the interference structure only appears in the compact cases because is still larger than unity when and .
4.3 Scattering mass opacity
In the same manner of obtaining the analytic formula of the absorption mass opacity, we also derive the analytic formula of the scattering mass opacity. In addition, by using the analysis, we explain why the mass opacity can and cannot be characterized by .
4.3.1
When , in the Rayleigh regime, can be written as
| (19) |
(see Eq. (5.8) in BH83). At the longer wavelengths, and . Therefore, the equation can be approximated to
| (20) |
As shown in Appendix A.1, at the longer wavelengths. Therefore, . By using and , we obtain . This is not characterized by . When we consider two aggregates whose is the same, the aggregate that has the larger radius has the larger scattering mass opacity at the longer wavelengths although is same. In other words, the scattering efficiency at the longer wavelengths is a way to determine the filling factor of fluffy aggregates.
4.3.2 and optically thin
If , the scattering mass opacity of an aggregate is regarded as the sum of the scattering mass opacity of each monomer because the scattered waves from all the constituent monomers have approximately the same phase. If , by contrast, scattered waves with scattering angle cancel out because of the phase difference. Thus, the radiation within the solid angle of is scattered. With the condition that and that is smoothly connected to at , we obtain
| (21) |
Using the same discussion in the previous section, we obtain . This is again characterized by . We note that the optical depth of the aggregate is unity when is unity. Thus, the optical depth becomes unity where because .
4.3.3 and optically thick
When and the medium is optically thick, . Therefore, in the same manner of the absorption mass opacity, we obtain
| (22) |
(see Eq. (7.5) and Eq. (7.6) in BH83).
As discussed in Section 4.2.3, the integrated reflectance is . Thus, . This is regarded as . Thus, the scattering mass opacity also goes to the geometric cross section at shorter wavelengths and is characterized by .
4.3.4 Analytic formula of scattering mass opacity
Combining the three limiting regimes, we obtain the analytic formula of scattering mass opacity as
| (23) |
Figure 8 shows the comparison of scattering mass opacity obtained with the Mie calculation and the analytic formula.
Figures 8 (a) and (b) show the case of , but the filling factor is and , respectively. The analytic formula in both cases reproduces the Mie calculation. Figures 8 (c) and (d) show the case of , but the filling factor is and , respectively. In this case, the analytic formula reproduces the Mie calculation except for the interference structure because we assume that all the amplification by interference is damped when and optically thin, which corresponds to . However, the difference of the mass opacity between the analytic and Mie calculations is less than one order. Except for the interference structure, the analytic formula reproduces the Mie calculation even in the case of scattering mass opacity.
As already shown in Fig. 4, the scattering mass opacity is proportional to at the intermediate wavelengths and at the longer wavelengths in fluffy cases. This can be explained by . If is less than unity, which occurs at the longer wavelengths, and thus scales as becasue . However, in the case of fluffy aggregates, we find the region where and optically thin, and therefore . This is the reason why the scattering mass opacity at the intermediate wavelengths in fluffy cases scales as .
5 Implications for opacity evolution in protoplanetary disks
The index of the dust opacity has been widely used as an indicator of the dust growth. In this section, we will show how changes as aggregates grow and drift both in compact and fluffy cases. Then, we propose a detection method of fluffy aggregates in protoplanetary disks by using the opacity index .
5.1 Fluffy dust growth and opacity evolution
Before starting the discussion of , we discuss the general mass opacity change as dust grains grow to fluffy aggregates in protoplanetary disks. We adopt a fluffy dust growth model proposed by Kataoka et al. (2013b). In this model, they reveal the overall porosity evolution from micron-sized grains to kilometer-sized planetesimals through direct sticking. In the coagulation, icy particles are sticky and thus they are not disrupted or bounced, but grow to a larger size (Wada et al. 2009, 2011, 2013). Moreover, the large radius of fluffy aggregates enables them to grow rapidly to avoid the radial drift barrier (Okuzumi et al. 2012; Kataoka et al. 2013b). Thus, the model is a complete scenario of growing path from dust grains to planetesimals by direct sticking.
Figure 9 shows the internal density evolution at 30 AU in orbital radius in a minimum mass solar nebula model, proposed by Kataoka et al. (2013b).
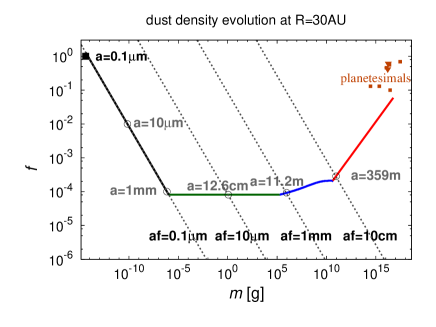
We note that the figure shows the local porosity evolution, but dust aggregates start to drift inward once they grow to be decoupled from the gas. We discuss the radial drift later in this section. The turbulent parameter is set to be and the mean internal density is set to be 1.68 . The picture of the overall porosity evolution is as follows. As the dust grains first coagulate to form fluffy aggregates, the filling factor decreases to . Once the collisional compression becomes effective, the density keeps constant. Then, the gas compression and the self-gravity compression make the dust aggregates compact.
The open circles represent the characteristic dust radius , while the dotted lines show the lines of constant . From this figure, the dust aggregates in the initial growth stage is optically the same. The initial growth is expected to be fractal. The dust aggregates coagulate with aggregates of similar sizes, and thus the fractal dimension is expected to be 2 (Okuzumi et al. 2012). Thus, the mass-to-area ratio of the aggregates keeps constant. In other words, keeps the same value. Therefore, the initial growth is indistinguishable with no growth in the absorption mass opacity. After the initial growth, when the compression mechanisms become effective, the opacity is expected to change because the mass-to-area ratio changes.
The first three cases are degenerated in mass opacity because is the same. Once the compression becomes effective, the mass opacity changes as expected in the dust growth. For example, when dust aggregates grow to have their radius of cm, they have almost the same opacity as compact grains. We note that the interference structure does not appear as aggregates grow because the filling factor is typically in this growth scenario.
5.2 Dust opacity index beta
We define as an opacity slope between 1 mm and 3 mm. Here, we use again because optical properties are characterized by . We note that in the case of compact grains (). We consider several cases for calculating dust where the filling factor is fixed in each case. Calculating , we consider a grain size distribution with a power law as between a minimum and a maximum size, and , respectively; is chosen to be 0.1 . Figure 11 shows how the absorption mass opacity at 1 mm and changes as the aggregate size increases.
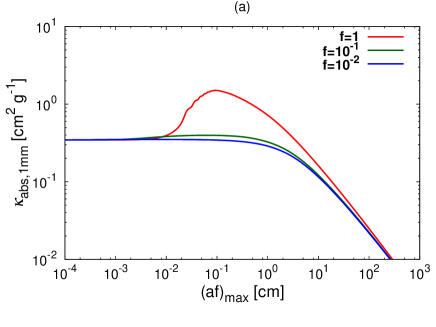
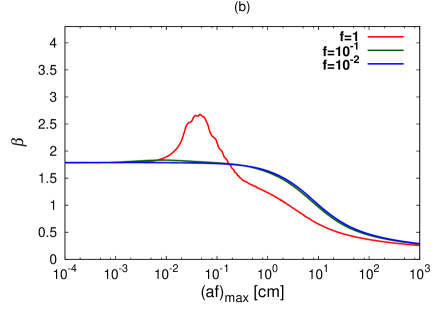
The compact case in this figure corresponds to Fig. 3 in Ricci et al. (2010b). The red line shows the compact case, while green and blue lines are fluffy cases. The lines in the cases of are indistinguishable from the line of , and thus we do not plot them. The absorption mass opacity has a strong bump around . This bump corresponds to the interference structure where the size parameter . On the other hand, the fluffy cases does not show such a bump because there is no interference. The bump of the mass opacity results in a bump of in the compact case. The dust increases up to in the compact case, but there is no bump in fluffy cases. In other words, is always equal to or less than in fluffy cases.
From this result, the difference in the absorption mass opacity between compact and fluffy dust appears in the intermediate size, which is between 0.1 mm and 1 mm.
5.3 Radial profile of
The radial size distribution of dust aggregates is determined by both dust growth and drift. In protoplanetary disks, the dust growth timescale strongly depends on orbital radius. In the inner part of disks, dust grains coagulate faster than in the outer part because of the shorter Keplerian period. Thus, dust aggregates have a larger size at the inner part and smaller at the outer part when considering only dust growth. When dust aggregates grow to larger sizes, they start to drift inward. Thus, the size where the aggregates start to drift is the maximum size of the aggregates at each orbital radius. The maximum size also depends on an orbital radius: the maximum size is larger in the inner part and smaller in the outer part. Combining both effects of dust growth and drift, the radial profile of the size of dust aggregates is expected to be smaller in the outer part and larger in the inner part. Observationally, the radial profile of have the information of the radial size distribution.
To obtain the radial profile of , we adopt the following simple dust growth and drift model. We assume that there are initially sized dust grains in the entire disk. We trace the growth and drift motion of each set of dust grains initially located at each orbital radius.
To calculate the time evolution of dust mass and the orbital radius at each orbital radius, we assume that dust grains have a monodisperse distribution at each orbital radius. Under this assumption, the dust growth and drift is described by (e.g., Okuzumi et al. 2012)
| (24) |
and
| (25) |
where is the spatial dust density, the dust radius, the relative velocity of dust grains or aggregates, and the drift velocity. We use the disk model of Kataoka et al. (2013b) (see also Okuzumi et al. 2012 for the definitions of the dust velocity and the disk model). Here, we briefly summarize the model. At a radial distance from the central star, the gas-surface density profile is where we use in this paper. We note that the gas-surface density does not change with time to clarify the effects of dust growth and drift (e.g., Okuzumi et al. 2012). The initial dust-to-gas mass ratio is 0.01. The adopted temperature profile is , which corresponds to midplane temperature (Chiang et al. 2001). This is cooler than optically thin disk models to focus on the dust coagulation in the midplane. The value of is assumed be the root mean square of Brownian motion and turbulent motion (see Eq. (32) in Okuzumi et al. 2012). The diffusion coefficient is taken to be . For the velocity induced by turbulence, we denote the velocity difference of dust and gas as dust-dust velocity for simplicity. We determine the dust scaleheight from the balance between sedimentation and turbulent diffusion (Brauer et al. 2008). The filling factor is fixed to be unity in the compact case and changes as a function of the orbital radius in the fluffy case following Kataoka et al. (2013b).
Figure 12 shows the dust growth and drift paths. The dashed lines show the paths of growing dust aggregates and the colored dotted and solid lines represent isochrones at and years.
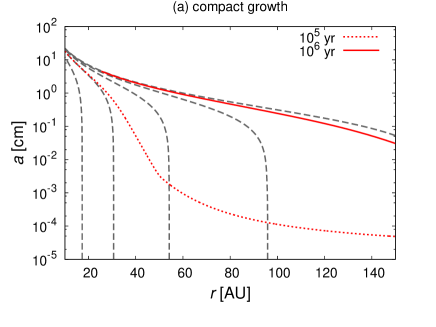
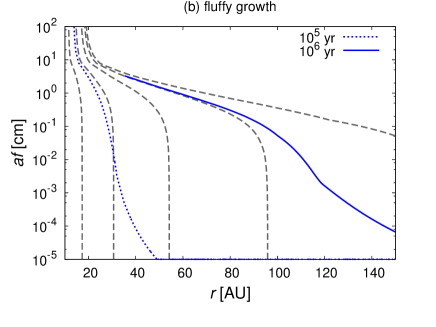
The isochrones represent the radial grain/aggregate-size distribution at the specific time. The size of dust aggregates increases with a decreasing orbital radius. This is caused by two effects: dust growth and drift. For example, on the line of the isochrone at years in the compact case, shown in Fig. 12 (a), the dust growth determines the aggregate size beyond . At 30 AU or larger in orbital radius, dust growth is faster at the inner part of the disk than the outer part because the growth timescale is proportional to the Keplerian period (e.g., Okuzumi et al. 2012). At the orbital radius less than 30 AU, the maximum size is determined by the drift motion. The aggregates grow so large that they are decoupled from the gas, and drift inward. Therefore, the aggregate size at orbital radius less than 30 AU corresponds to the maximum size determined by the radial drift.
Figure 13 shows the radial distribution for both compact and fluffy cases at the isochrones shown in Fig. 12.
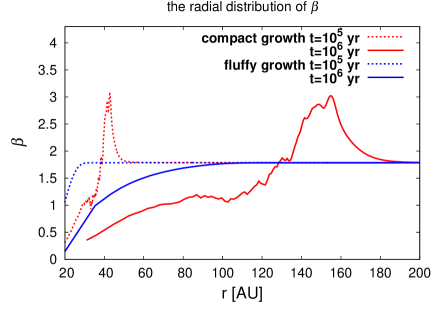
In the compact case, increases to around at 40 AU in the range of 10 AU at years and at 150 AU in the range of 20 AU at years. This means that protoplanetary disks have a specific radius where is greater than in the compact case. In the fluffy case, on the other hand, is always equal to or less than . Therefore, if the radial distribution always has a value of or less, it means that the millimeter emission comes from fluffy aggregates.
5.4 Silicate feature
In the inner part of the disk, ice particles are expected to be sublimated and there are dust aggregates whose constituent particles are made of silicate. Micron-sized silicate grains show the broad feature at 10 . The feature is used as a signature of grain growth (e.g., van Boekel et al. 2005). To show how the porosity affects the silicate feature, we also calculate the silicate feature of fluffy aggregates. In this section, we change the material constant: we assume pure silicate monomers. The material density is taken to be and the refractive index is taken from Weingartner & Draine (2001).
Figure 14 shows the absorption mass opacity in cases of silicate aggregates.
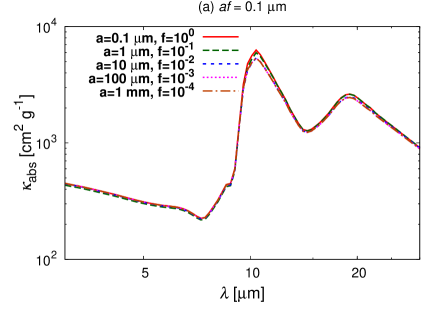
Each panel shows the mass absorption opacities where is constant. When , the broad silicate feature is seen at around and does not significantly change as the aggregate size increases from to . In the cases of -, the silicate feature becomes weaker as increases. The absorption mass opacity of porous aggregates () is independent of the aggregate size as long as is constant, as is also shown in the case of icy aggregates. The small differences between the cases of and derive from the interference as well as the icy aggregates. Thus, except for the interference, the silicate feature disappears as increases.
6 Summary and discussion
We calculated the mass opacity of fluffy dust aggregates expected to be in protoplanetary disks. The wavelengths are in the range of and the filling factor in the range of . The assumed composition is the mixture of silicate, organics, and water ice (Pollack et al. 1994). We used the Mie calculation with the effective medium theory to calculate the mass opacity of fluffy aggregates. Our main findings are as follows.
-
•
The absorption mass opacity of dust aggregates is characterized by , where is the dust radius and is the filling factor. The absorption mass opacity is almost independent of the aggregate size when is constant. This makes it difficult to distinguish between fluffy aggregates and compact grains in observations. The only difference of the absorption mass opacity between compact grains and fluffy aggregates where is the same appears as the interference structure in the compact case at the size parameter .
-
•
The scattering mass opacity at short wavelengths is also characterized by , but not at long wavelengths. The scattering mass opacity at the long wavelengths is higher in more fluffy aggregates even if is the same. The scattering mass opacity scales as at intermediate wavelengths and scales as at the longer wavelengths.
-
•
We also derived the analytic formulae of the absorption and scattering mass opacities, connecting the three limiting cases, which are the Rayleigh regime, the optically-thin geometric regime, and the optically-thick geometric regime. The analytic formulae reproduce the results of the Mie calculations. The formulae are expected to greatly reduce the computational time to calculate the opacity of large fluffy aggregates. By using the analytic formulae, we analytically showed that the absorption mass opacity is characterized by one parameter except for the interference structure. We also showed that the scattering mass opacity at the shorter wavelengths is also characterized by , but not at the longer wavelengths. Thus, the fact that the mass opacity is characterized by is valid even out of the range investigated in the Mie calculation in this paper and is also applicable to other materials.
-
•
The opacity index is a good way to distinguish between fluffy aggregates and compact grains at observations of protoplanetary disks. If we assume the compact grain growth, with increasing grain size, the opacity index increases to and then decreases. If we assume fluffy aggregate growth, the index monotonously decreases from its initial value (see Fig. 11). If dust grains are compact in protoplanetary disks, the radial distribution of the index should have a peak of (see Fig. 13).
-
•
We also calculated the absorption mass opacity of silicate aggregates at around . The opacity of fluffy aggregates has the feature as well as compact silicate grains. The silicate feature is also appropriately characterized by .
In this paper, as a first step, we use the effective medium theory. Voshchinnikov et al. (2005) have shown that EMT is a good approximation when considering small inclusions. We considered sized monomers and the wavelength ranges from to 10 cm. Because the monomer size is less than the wavelengths, EMT would be a good approximation. However, the validity of EMT at infrared, especially at short wavelengths, is somewhat marginal because the wavelengths are close to the monomer size. Thus, the validity of the effective medium theory should be further tested by future work.
We proposed that the radial profile of is a way to distinguish between compact grains and fluffy aggregates. Pérez et al. (2012) have put a constraint on the radial distribution by observing a protoplanetary disk AS 209 with VLA, SMA, and CARMA. They found that has a lower value inside the disk rather than the constant in the whole disk. It is consistent with the model of Fig. 12, where the grain size is distributed because of the difference of growth time and the maximum grain size is limited by radial drift. The results of Pérez et al. (2012) also prefer the fluffy growth scenario to the compact because there is no signature that is large as . However, the observation has little information about in the outer part of the disk because of the sensitivity limitation at the longer wavelengths. Thus, to clearly determine whether the emission comes from compact grains or fluffy aggregates, we need higher sensitivity at the longer wavelengths. Moreover, to reject the possibility of , we need a high spatial resolution to resolve 20 AU bump in the compact case at years. This observation is challenging, but would be a good target of ALMA.
The fact that the scattering mass opacity at the longer wavelengths cannot characterized by is another way to distinguish between compact grains and fluffy aggregates. Here, we propose the polarization observation of the millimeter continuum emission. The scattered light is expected to be linearly polarized, and thus by comparing the intensity and the polarized intensity, the ratio of the scattering and absorption mass opacity can be directly observed. Although the polarized emission depends on the disk geometry and has many uncertainties, it would be a good target in the next phase of ALMA.
In addition, Mulders et al. (2013) proposed that to interpret the low effective albedo of protoplanetary disks, there are large particles at the outer disk surface and they should be porous structures to be stirred up to the surface. However, we showed that the infrared scattering opacity is determined by In addition, the coupling efficiency of aggregates to the disk gas is also determined by . Thus, the optical and kinematical properties are degenerated. Therefore, the porous aggregates would not help to interpret the observations of the low effective albedo.
Appendix A Refractive index of fluffy aggregates
In this section, we confirm the validity of the assumptions used to derive the analytic formula in Section 4.
A.1 at the longer wavelengths
Figure 15 shows the comparison of and when , and .
We confirm that the refractive index always satisfies at the longer wavelengths in any value of . Moreover, we also confirm that and when .
A.2 Reflectance
We define the integrated reflectance as
| (26) |
When the medium satisfies and is optically thick, and are written as and . We assume that , and therefore and are unity in Section 4. Figure 16 shows the integrated reflectance .
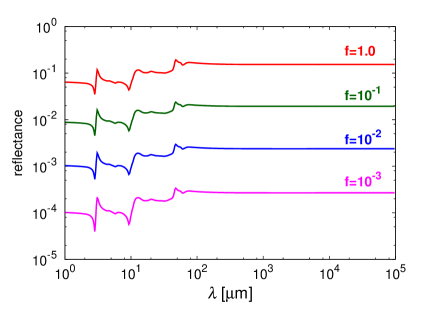
Roughly speaking, and thus we can assume that and are unity in the regime.
A.3 Optical thickness inside the material
We discuss the optical thickness inside the medium by considering whether is greater than . Figure 17 shows in the case of , and .
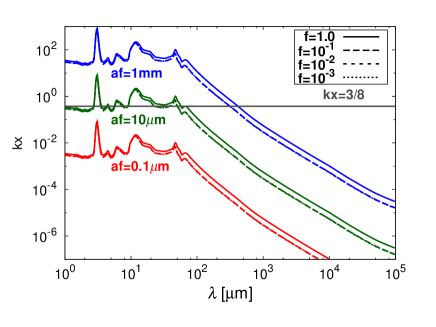
We confirm that if is the same, is almost the same at all wavelengths. In the case of , the medium is totally optically thin. In the case of , the medium is optically thin at the longer wavelengths and marginally optically thick when . In the case of , the medium is optically thin at the longer wavelengths and optically thick when .
Acknowledgements.
We acknowledge Masaomi Tanaka for the fruitful discussion, Takaya Nozawa, Andrea Isella for their kind cooperation about opacity tables, Munetake Momose, Takashi Tsukagoshi for great discussion from observational point of view. A.K. acknowledges Kohji Tomisaka for his support for PhD life. A.K. is supported by the Research Fellowship from JSPS for Young Scientists (242120).References
- Andrews & Williams (2005) Andrews, S. M. & Williams, J. P. 2005, ApJ, 631, 1134
- Beckwith & Sargent (1991) Beckwith, S. V. W. & Sargent, A. I. 1991, ApJ, 381, 250
- Beckwith et al. (1990) Beckwith, S. V. W., Sargent, A. I., Chini, R. S., & Guesten, R. 1990, AJ, 99, 924
- Birnstiel et al. (2010) Birnstiel, T., Ricci, L., Trotta, F., et al. 2010, A&A, 516, L14
- Blum & Wurm (2008) Blum, J. & Wurm, G. 2008, ARA&A, 46, 21
- Bohren & Huffman (1983) Bohren, C. F. & Huffman, D. R. 1983, Absorption and scattering of light by small particles
- Brauer et al. (2008) Brauer, F., Dullemond, C. P., & Henning, T. 2008, A&A, 480, 859
- Chiang et al. (2001) Chiang, E. I., Joung, M. K., Creech-Eakman, M. J., et al. 2001, ApJ, 547, 1077
- D’Alessio et al. (2001) D’Alessio, P., Calvet, N., & Hartmann, L. 2001, ApJ, 553, 321
- Draine & Flatau (1994) Draine, B. T. & Flatau, P. J. 1994, Journal of the Optical Society of America A, 11, 1491
- Dra̧żkowska et al. (2013) Dra̧żkowska, J., Windmark, F., & Dullemond, C. P. 2013, A&A, 556, A37
- Guilloteau et al. (2011) Guilloteau, S., Dutrey, A., Piétu, V., & Boehler, Y. 2011, A&A, 529, A105
- Isella et al. (2009) Isella, A., Carpenter, J. M., & Sargent, A. I. 2009, ApJ, 701, 260
- Kataoka et al. (2013a) Kataoka, A., Tanaka, H., Okuzumi, S., & Wada, K. 2013a, A&A, 554, A4
- Kataoka et al. (2013b) Kataoka, A., Tanaka, H., Okuzumi, S., & Wada, K. 2013b, A&A, 557, L4
- Kimura et al. (2003) Kimura, H., Kolokolova, L., & Mann, I. 2003, A&A, 407, L5
- Kimura et al. (2006) Kimura, H., Kolokolova, L., & Mann, I. 2006, A&A, 449, 1243
- Kolokolova et al. (2007) Kolokolova, L., Kimura, H., Kiselev, N., & Rosenbush, V. 2007, A&A, 463, 1189
- Kothe et al. (2013) Kothe, S., Blum, J., Weidling, R., & Güttler, C. 2013, Icarus, 225, 75
- Kozasa et al. (1992) Kozasa, T., Blum, J., & Mukai, T. 1992, A&A, 263, 423
- Kudo et al. (2002) Kudo, T., Kouchi, A., Arakawa, M., & Nakano, H. 2002, Meteoritics and Planetary Science, 37, 1975
- Li & Greenberg (1997) Li, A. & Greenberg, J. M. 1997, A&A, 323, 566
- Lommen et al. (2010) Lommen, D. J. P., van Dishoeck, E. F., Wright, C. M., et al. 2010, A&A, 515, A77
- Min et al. (2006) Min, M., Dominik, C., Hovenier, J. W., de Koter, A., & Waters, L. B. F. M. 2006, A&A, 445, 1005
- Min et al. (2003) Min, M., Hovenier, J. W., & de Koter, A. 2003, A&A, 404, 35
- Min et al. (2005) Min, M., Hovenier, J. W., & de Koter, A. 2005, A&A, 432, 909
- Min et al. (2007) Min, M., Waters, L. B. F. M., de Koter, A., et al. 2007, A&A, 462, 667
- Miyake & Nakagawa (1993) Miyake, K. & Nakagawa, Y. 1993, Icarus, 106, 20
- Mukai et al. (1992) Mukai, T., Ishimoto, H., Kozasa, T., Blum, J., & Greenberg, J. M. 1992, A&A, 262, 315
- Mulders et al. (2013) Mulders, G. D., Min, M., Dominik, C., Debes, J. H., & Schneider, G. 2013, A&A, 549, A112
- Okuzumi et al. (2012) Okuzumi, S., Tanaka, H., Kobayashi, H., & Wada, K. 2012, ApJ, 752, 106
- Okuzumi et al. (2009) Okuzumi, S., Tanaka, H., & Sakagami, M.-a. 2009, ApJ, 707, 1247
- Ormel et al. (2007) Ormel, C. W., Spaans, M., & Tielens, A. G. G. M. 2007, A&A, 461, 215
- Pagani et al. (2010) Pagani, L., Steinacker, J., Bacmann, A., Stutz, A., & Henning, T. 2010, Science, 329, 1622
- Pérez et al. (2012) Pérez, L. M., Carpenter, J. M., Chandler, C. J., et al. 2012, ApJ, 760, L17
- Pollack et al. (1994) Pollack, J. B., Hollenbach, D., Beckwith, S., et al. 1994, ApJ, 421, 615
- Ricci et al. (2010a) Ricci, L., Testi, L., Natta, A., & Brooks, K. J. 2010a, A&A, 521, A66
- Ricci et al. (2010b) Ricci, L., Testi, L., Natta, A., et al. 2010b, A&A, 512, A15
- Shen et al. (2008) Shen, Y., Draine, B. T., & Johnson, E. T. 2008, ApJ, 689, 260
- Shen et al. (2009) Shen, Y., Draine, B. T., & Johnson, E. T. 2009, ApJ, 696, 2126
- Suyama et al. (2008) Suyama, T., Wada, K., & Tanaka, H. 2008, ApJ, 684, 1310
- Suyama et al. (2012) Suyama, T., Wada, K., Tanaka, H., & Okuzumi, S. 2012, ApJ, 753, 115
- Tanaka et al. (2005) Tanaka, H., Himeno, Y., & Ida, S. 2005, ApJ, 625, 414
- van Boekel et al. (2005) van Boekel, R., Min, M., Waters, L. B. F. M., et al. 2005, A&A, 437, 189
- van der Marel et al. (2013) van der Marel, N., van Dishoeck, E. F., Bruderer, S., et al. 2013, Science, 340, 1199
- Voshchinnikov et al. (2005) Voshchinnikov, N. V., Il’in, V. B., & Henning, T. 2005, A&A, 429, 371
- Wada et al. (2013) Wada, K., Tanaka, H., Okuzumi, S., et al. 2013, A&A
- Wada et al. (2008) Wada, K., Tanaka, H., Suyama, T., Kimura, H., & Yamamoto, T. 2008, ApJ, 677, 1296
- Wada et al. (2009) Wada, K., Tanaka, H., Suyama, T., Kimura, H., & Yamamoto, T. 2009, ApJ, 702, 1490
- Wada et al. (2011) Wada, K., Tanaka, H., Suyama, T., Kimura, H., & Yamamoto, T. 2011, ApJ, 737, 36
- Warren (1984) Warren, S. G. 1984, Appl. Opt., 23, 1206
- Weingartner & Draine (2001) Weingartner, J. C. & Draine, B. T. 2001, ApJ, 548, 296
- Windmark et al. (2012) Windmark, F., Birnstiel, T., Güttler, C., et al. 2012, A&A, 540, A73
- Zsom et al. (2011) Zsom, A., Ormel, C. W., Dullemond, C. P., & Henning, T. 2011, A&A, 534, A73
- Zsom et al. (2010) Zsom, A., Ormel, C. W., Güttler, C., Blum, J., & Dullemond, C. P. 2010, A&A, 513, A57
- Zubko et al. (1996) Zubko, V. G., Mennella, V., Colangeli, L., & Bussoletti, E. 1996, MNRAS, 282, 1321