Infrared-Faint Radio Sources: A New Population of High-redshift Radio Galaxies
Abstract
We present a sample of 1317 Infrared-Faint Radio Sources (IFRSs) that, for the first time, are reliably detected in the infrared, generated by cross-correlating the Wide-Field Infrared Survey Explorer (WISE) all-sky survey with major radio surveys. Our IFRSs are brighter in both radio and infrared than the first generation IFRSs that were undetected in the infrared by the Spitzer Space Telescope. We present the first spectroscopic redshifts of IFRSs, and find that all but one of the IFRSs with spectroscopy has . We also report the first X-ray counterparts of IFRSs, and present an analysis of radio spectra and polarization, and show that they include Gigahertz-Peaked Spectrum, Compact Steep Spectrum, and Ultra-Steep Spectrum sources. These results, together with their WISE infrared colours and radio morphologies, imply that our sample of IFRSs represents a population of radio-loud Active Galactic Nuclei at . We conclude that our sample consists of lower-redshift counterparts of the extreme first generation IFRSs, suggesting that the fainter IFRSs are at even higher redshift.
keywords:
galaxies: active – galaxies: evolution – radio continuum: galaxies – infrared: galaxies – galaxies: distances and redshifts – galaxies: high-redshift.1 Introduction
Infrared-Faint Radio Sources (IFRSs) are rare objects that were first identified by Norris et al. (2006) as radio sources which were detected at cm ( GHz) in the deep radio observations of the Australia Telescope Large Area Survey (ATLAS) Chandra Deep Field South (CDFS; Rosati et al., 2002), but which were not detected in the Spitzer Wide-area InfraRed Extragalactic Survey (SWIRE; Lonsdale et al., 2003) at 3.6, 4.5, 5.8, 8 and m. A total of 22 IFRSs were identified by Norris et al. (2006), which were undetected at 3.6m down to a 3 level of 3Jy. At the time, this was an unexpected discovery since it was believed that SWIRE would detect all Active Galactic Nuclei (AGN) or Star-Forming Galaxies (SFGs) that were observable at radio frequencies. Similarly, Middelberg et al. (2008a) identified a sample of 31 IFRSs when cross-matching the ATLAS radio observations of the European Large Area ISO Survey South 1 (ELAIS-S1; Oliver et al., 2000) field with the co-spatial SWIRE observations, which had similar infrared (IR) sensitivities to the SWIRE CDFS observations.
Most of these sources were found to have flux densities at cm of a few hundred Jy, but some were as bright as mJy. All 53 IFRSs discovered in ATLAS also lacked optical counterparts. Therefore, IFRSs may be extreme counterparts of the Optically Invisible Radio Sources (OIRS) identified by Higdon et al. (2005), which are compact radio sources undetected in the optical up to an R-band magnitude of 25.7. Higdon et al. (2008) show that 34 per cent of their OIRS are not detected at 3.6 m, and conclude that these undetected sources appear to embody a sample of powerful radio galaxies at . We refer to the IFRSs discovered in ATLAS which lacked optical and IR counterparts as first generation IFRSs. Since IFRSs were originally discovered, eight IR and nine optical counterparts have been potentially detected (Garn & Alexander, 2008; Huynh et al., 2010), all of which are extremely faint.
The nature of IFRSs remains unconfirmed, given their non-detections at optical and infrared wavelengths. Putative explanations of their nature have included: (1) high-redshift radio-loud galaxies; (2) extremely obscured radio galaxies at moderate redshifts (); (3) lobes or hotspots of nearby unidentified radio galaxies; (4) very obscured, luminous starburst galaxies; (5) AGN or starburst galaxies in a transitory phase; (6) high-latitude pulsars; (7) misidentifications; (8) an unknown type of object; (9) a combination of these (Norris et al., 2011, and references therein). The study of IFRSs has been almost entirely limited to their properties at radio frequencies.
1.1 Infrared-Faint Radio Sources
The first steps taken toward probing the nature of IFRSs were the Very Long Baseline Interferometry (VLBI) observations undertaken by Norris et al. (2007) and Middelberg et al. (2008b), who respectively observed two and four IFRSs originally identified in ATLAS. Norris et al. (2007) identified an AGN within one of the IFRSs at a flux density of 5.0 mJy, implying a core size of 0.03 arcsec, corresponding to a linear size of 260 pc at any redshift. Norris et al. (2007) suggested that if such an AGN were at a redshift of , it would be detected by SWIRE. However, they proposed that at a redshift of , an AGN like this would most likely elude deep infrared detection, but could still be detected in deep radio observations.
Middelberg et al. (2008b) also detected only one IFRS with VLBI. The detected source had a flux density on the longest baselines of mJy, which they inferred corresponded to a brightness temperature of K, indicating non-thermal emission from an AGN. They showed that the detected IFRS had properties consistent with that of a high redshift () Compact Steep Spectrum (CSS) source.
A further study of IFRSs was conducted by Garn & Alexander (2008), who analysed 14 IFRSs in the Spitzer First Look Survey (FLS) field, using Spitzer Infrared Array Camera (IRAC; Fazio et al., 2004) and Multiband Imaging Photometer (MIPS; Rieke et al., 2004) data, as well as 20 cm Very Large Array (VLA) data from Condon et al. (2003). Their sample is complementary to that of the previous samples of ATLAS IFRSs, since their m 3 sensitivity is Jy. Eight optical detections with a median AB magnitude of suggest that the sample is a much brighter population of IFRSs, and may be at lower redshift. Garn & Alexander (2008) suggested that since they did not see an increase in the population of IFRSs at low flux densities ( 1 mJy), at which point the contribution of SFGs becomes significant, their sources were unlikely to be obscured SFGs. Additionally, upper limits of the flux density ratio (Appleton et al., 2004) were calculated to be and , well below the typical values derived for SFGs. Through source stacking in the four IRAC bands, Garn & Alexander (2008) showed that six sources had possible infrared counterparts below the detection threshold. Using a stacked image of the remaining eight sources that were not identified as having a potential counterpart, they found an upper limit of the median 3.6 m flux density of Jy. Garn & Alexander (2008) showed that IFRSs are made up of a population of flat, steep and Ultra-Steep Spectrum (USS) sources, from which they suggested that IFRSs ought not to be treated as a single source population. By modelling the Spectral Energy Distributions (SEDs) of the IFRSs from each of these three classes of radio spectra separately, and by placing upper limits on their linear size, they showed that all their IFRSs could be modelled as well-known Fanaroff and Riley Type II (FR II; Fanaroff & Riley, 1974) radio galaxies which are less luminous and placed at high redshift.
Possible infrared detections of two ATLAS IFRSs were made by Huynh et al. (2010), who found 3.6 m flux densities of 5.5 0.3 and 6.6 0.3 Jy for the two sources, using ultra-deep Spitzer imaging of the extended Chandra Deep Field South (eCDFS). The fainter of these sources also contained an optical Advanced Camera for Surveys (ACS; Giavalisco et al., 2004) counterpart at and magnitudes. Huynh et al. (2010) conducted detailed modelling of the SEDs of these two IFRSs, and two others that were undetected. Huynh et al. (2010) found that the data could be reproduced by a 3C 273-like object which, when detected in the infrared, was redshifted to , and when not detected in the infrared, was redshifted to . Furthermore, no non-detected IFRSs could be explained by any SED template at redshifts smaller than . Huynh et al. (2010) concluded that their four IFRSs lie well beyond the radio-infrared correlation, since none of them was detected at 24 m, down to a 5 level of 50 Jy. Hence, their radio emission cannot be accounted for by star formation and must be due to the presence of an AGN.
The deepest Spitzer imaging to date of the larger regions of the CDFS and ELAIS-S1 fields comes from the Spitzer Extragalactic Representative Volume Survey (SERVS; Mauduit et al., 2012), which has a 3 noise level of 1.5 Jy, and which mostly overlaps with the ATLAS regions where the first IFRSs were identified. Using the 3.6 m SERVS data, Norris et al. (2011) found three candidate detections of IFRSs at levels of 2 Jy. However, they concluded that 23 of these detections could be spurious detections due to confusion. After producing a stacked infrared image, they found a median flux density of 0.2 Jy or less, attributing very extreme radio to infrared flux density ratios to these objects. Norris et al. (2011) found no evidence of a cross-identification for the two candidate detections from Huynh et al. (2010), which would have appeared at 11 and 13 in SERVS. However, new radio data with greater positional accuracy from Miller et al. (2013) has revealed that while one of the Huynh et al. (2010) IR counterparts is probably due to confusion, the other coincides well with the updated radio position and consequently, we consider it to be a reliable match.
Maini et al. (2013) identified a further 21 IFRSs using more recent SERVS data, which went down to an even deeper 3 level of 1Jy at 3.6m, and which extended to the Lockman Hole. They also found a number of new candidate IR detections, and showed that these IFRSs are well modelled as Quasi Stellar Objects (QSOs) at , based on their 3.6 and 4.5m tracks as compared to the SED tracks of other classes of object. Using median stacking, Maini et al. (2013) found that the undetected IFRSs had flux density upper limits of 0.3 and Jy, respectively at 3.6m and 4.5m.
Herzog et al. (2013) presented a separate sample of IFRSs from the CDFS, and found them to have very similar properties to HzRGs.
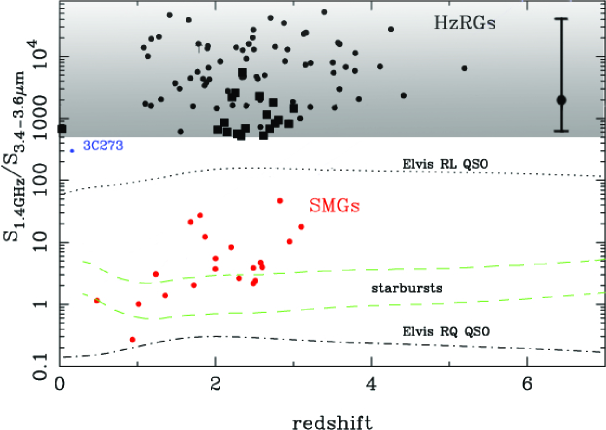
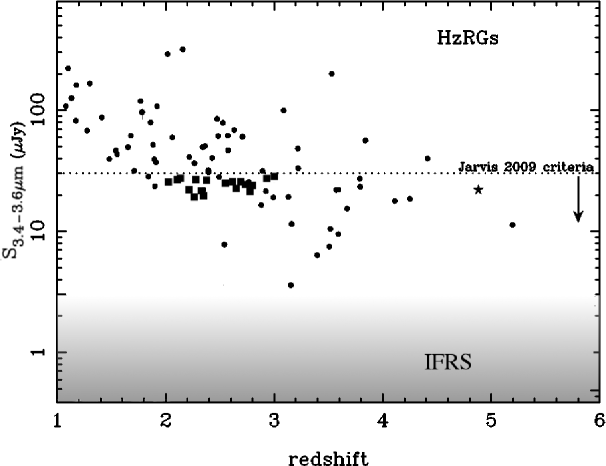
Norris et al. (2011) showed that IFRSs span a range in flux density ratio that is unoccupied except for High- Radio Galaxies (HzRGs), as illustrated in Fig. 1. They showed that if IFRSs follow the observed relation for HzRGs between and redshift, similar to the well-known relation that holds for other radio galaxies (Willott et al., 2003), then all first generation IFRSs occupy a place in the relation at , as illustrated in Fig. 2. Norris et al. (2011) concluded that while there is a possibility that more than one class of object may represent IFRSs, the evidence suggests that a significant fraction, if not all of them, are radio-loud AGN at , but could also be made up of a new class of radio-loud AGN at lower redshift (), in which the IR luminosity of the entire host galaxy must be reduced by several magnitudes ( mag) of dust extinction.
Middelberg et al. (2011) studied the high-resolution characteristics, spectral indices and polarization properties of a sample of 17 IFRSs identified in the ATLAS ELAIS-S1 field. They concluded from the high resolution 4.8 and 8.6 GHz radio-continuum data that the observed sources are smaller than 4.5 kpc 2.1 kpc, much smaller than the projected linear sizes of classic high redshift radio galaxies, which range from a few to many hundreds of kiloparsecs. Middelberg et al. (2011) suggested that these IFRSs could therefore be intrinsically much smaller, or have their extended emission resolved out, even at lower resolution. None the less, the hypothesis that IFRSs are simply radio lobes of nearby galaxies was ruled out for these particular sources, since they were too compact to be lobes. Middelberg et al. (2011) found a median radio spectral index of 111The spectral index is defined as . for their sample of IFRSs, with no indices larger than , as compared to the respective medians of and for the general source population and the AGN source population in the ATLAS ELAIS-S1 field. Additionally, they found a curvature in the radio spectra as seen in Gigahertz Peaked Spectrum (GPS) and CSS sources, rather than the power-law spectra of classical AGN. GPS and CSS sources are galaxies that contain small yet powerful AGN at their centres. GPS sources, which show a turnover at a few GHz, are generally 1 kpc in size, and are believed to represent the earliest evolutionary stage of large-scale radio sources (Polatidis & Conway, 2003; Tinti & de Zotti, 2006; Fanti, 2009; Randall et al., 2011). CSS sources tend to peak around 200 MHz and reveal steep () spectral indices across the GHz range, are one to several tens of kpc in size, and are believed to bridge the evolutionary phase between the early GPS sources and the older and larger FR I and FR II galaxies (O’Dea, 1998). This implies that some IFRSs are very young and evolving AGN with very small jets, which is in good agreement with their observed sizes.
Middelberg et al. (2011) also showed that the properties of their IFRSs are strikingly similar to those of a sample of HzRGs from Seymour et al. (2007), which had a median radio spectral index of . Furthermore, the flux density ratio of the IFRSs from Middelberg et al. (2011) significantly overlapped with this sample of HzRGs, both of which had values of several hundred up to several tens of thousands, at the very tail end of the general source population, which peaked at . Middelberg et al. (2011) also found three of the sources to be significantly polarized at 20 cm, with fractional polarizations between 7 – 12 per cent. Given the evidence, Middelberg et al. (2011) classified 10 of their sources as AGN and the other 7 as most likely AGN based on their 24 m non-detections alone.
Banfield et al. (2011) found similar spectral indices and fractional polarizations for a sample of 18 IFRSs in the ELAIS-N1 field. They found a median spectral index of for five sources which had detectable polarizations, ranging from about 6 – 16 per cent fractional polarization. Banfield et al. (2011) found a steeper median spectral index of for the 13 unpolarized sources. Additionally, four of the polarized sources showed structure on arcsecond scales, while only two unpolarized sources showed resolved structure.
Cameron et al. (2011) observed 16 IFRSs to test the hypothesis that IFRSs are pulsars. After searching for short-term radio pulsations coming from the IFRSs, it was found that pulsed emission could not account for their observed flux densities. Cameron et al. (2011) concluded that it is unlikely that any IFRSs are simply pulsars.
Zinn et al. (2011) showed that the X-ray radiation from IFRSs may contribute significantly to the Cosmic X-ray Background. They estimated the X-ray emission of IFRSs and showed that it is consistent with the missing unresolved components of the Cosmic X-ray Background.
Despite the significant work undertaken in uncovering the nature of IFRSs, it still remains unconfirmed exactly what they are. However, good progress has been made toward ruling out some explanations of what makes up their majority, including pulsars, radio-lobes, and obscured SFGs. Additionally, it has been shown that it is not necessary for some new type of object to explain the existence of IFRSs. The evidence is mounting up that suggests the majority, if not almost all IFRSs are high-redshift () radio-loud AGN. While it is possible that they could be suffering from significant dust extinction, such extinction is not necessary to explain the observed data. However, a minority of what we are calling IFRSs could be made up of several types of objects, given their non-uniform characteristics such as their radio spectral index. The most likely such objects include: (1) very obscured radio galaxies at moderate redshifts (); (2) hotspots of nearby unidentified radio galaxies; (3) misidentifications. In this paper we address these possibilities and whether they can explain IFRSs.
1.2 WISE IFRSs
Norris et al. (2006) defined an IFRS as ‘a radio source with no detectable IR counterpart’. Zinn et al. (2011) proposed a new set of selection criteria to enhance searching for IFRSs, since the previous selection criterion was survey-specific. They defined IFRSs as sources that have:
-
1.
a flux density ratio
-
2.
a m flux density Jy
Although these limits are somewhat arbitrary, they encompass all known IFRSs. The first criterion ensures that the selected sources are outliers in the radio-IR correlation, minimising contamination from SFGs and foreground stars. The second criterion reduces the chance of selecting low-redshift AGN, although it does not rule out the possibility of selecting low-redshift AGN obscured by heavy dust extinction. Using these criteria, Zinn et al. (2011) compiled a catalogue of 55 known IFRSs from four deep radio surveys (CDFS, ELAIS-S1, FLS, and COSMOS), which remains until now the largest catalogue of IFRSs.
The Zinn et al. (2011) criteria enable the selection of a larger, brighter population of IFRSs with detectable infrared and optical emission. Therefore, while previous studies focused on very sensitive observations of a few small regions on the sky, we followed the strategy of combining radio data with IR data from the Wide-field Infrared Survey Explorer (WISE; Wright & WISE Team, 2009) for a large region of the sky, albeit at poorer sensitivity, and selecting detectable IFRSs from these data using the Zinn et al. (2011) criteria. With this data set we can not only study a statistically significant number of sources, we can learn how the brighter WISE IFRSs connect to the first generation of IFRSs.
We present the first spectroscopic redshifts of IFRSs, as well as the first X-ray counterparts of IFRSs. Additionally, we examine the properties of all IFRSs with detectable polarization, significantly increasing the number of known polarized IFRSs. We outline the data and sample selection in § 2, present our results and analysis in § 3, discuss the implications in § 4, and present our conclusions in § 5. The cosmological parameters used throughout this paper are , , and .
2 Data
2.1 20 cm radio data
The 20 cm radio data come from the Unified Radio Catalog (URC) compiled by Kimball & Ivezić (2008). This radio catalogue combines data from the NRAO VLA Sky Survey (NVSS; Condon et al., 1998), Faint Images of the Radio Sky at Twenty Centimeters (FIRST; Becker et al., 1995), Green Bank cm survey (GB6; Gregory et al., 1996), the Westerbork Northern Sky Survey (WENSS; Rengelink et al., 1997; de Bruyn et al., 2000), and the Sloan Digital Sky Survey Data Release 6 (SDSS DR6; Adelman-McCarthy et al., 2008). We use updated NVSS and FIRST data from the URC version 2.0 (Kimball & Ivezić, in preparation), which includes a number of new sources as well as updated positions and flux densities.
2.2 Infrared data
The IR data come from WISE (Wright & WISE Team, 2009), which is an all-sky survey centred at 3.4, 4.6, 12, and m (referred to as bands W1, W2, W3 and W4), with respective angular resolutions of 6.1, 6.4, 6.5, and 12.0 (FWHM), and typical sensitivity levels of 0.08, 0.11, 1, and mJy, with sensitivity increasing towards the ecliptic poles. The majority of our sources fall in these strips of greater sensitivity, because we require their 3.4m flux density to be Jy. To convert WISE magnitudes to flux density in Janskys (Jy), , we used
| (1) |
where is the flux correction factor at the given WISE band from Jarrett et al. (2011) and is the observed magnitude at the corresponding WISE band.
Additionally, we need to apply a colour correction, which depends on the assumed SED, which we don’t know in detail. Hence, we initially assume the correction factor of 0.991 in band W1 given by Jarrett et al. (2011) for a source that scales as , which is generally suitable for galaxies, and which results in the conversion
| (2) |
We initially selected the IFRSs using this conversion factor. We then measured the WISE colours of this pre-selection in order to determine if our colour correction was suitable. Band W4 was not considered in this calculation, and hence neither the colour , since only seven sources were detected at in band W4. The respective median found for each colour was and . According to Wright et al. (2010), these colours are closest to that of a source that scales as , which gives an SED with WISE colours and , and for which there is no colour correction. Hence, when converting 3.4 m from mags to Jy, we use no colour correction factor, which results in the conversion
| (3) |
The 30 Jy cutoff therefore corresponds to a lower limit in band W1 of 17.5 magnitudes. Using this more appropriate conversion, we then reselected the IFRSs, adding less than 5 per cent to the original.
2.3 Positional uncertainties and confusion
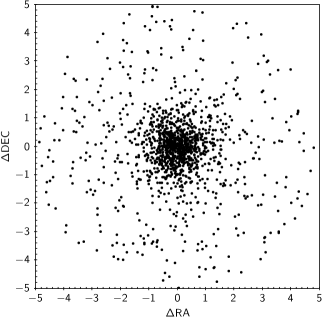
The FIRST survey has an astrometric precision of (Becker et al., 1995). WISE has an astrometric precision of with a further error of FWHM/(2 SNR) added in quadrature, where SNR is the signal-to-noise ratio (Wright et al., 2010). Since we require a 5 detection, all WISE positions in our sample are accurate to . The mean sky separation between the WISE positions and the FIRST positions is 1.5 arcsec, with the mean RA and DEC both arcsec, and a standard deviation of arcsec for both the RA and DEC. We find 65 per cent of our sources have a FIRST/WISE separation 1.5 arcsec. The sky separation for all of our IFRSs is shown in Fig. 3.
Since the WISE 3.4 m data approach the confusion limit, it is necessary to estimate the misidentifications that are due to confusion. We do so by taking an unbiased subsample of 312 (0.1 per cent) of the NVSS sources with FIRST positions from the URC, which are located all across the sky. We then shift their radio positions by an amount (typically ) that is greater than the beam size of both the radio and IR data, but smaller than the scale of the variations in the image sampling. We then apply our matching and selection procedure (see § 2.4), to estimate the confusion. This process was repeated eight times, each time shifting the radio positions by a different amount. It was found that a mean of 25.5 4.8 (8 per cent) of the shifted radio sources contained WISE counterparts. Of these, a mean of 0.75 0.83 matched the criteria of being an IFRS, giving a misidentification rate of our final sample of 0.24 0.27 per cent. Hence, the vast majority of our sample are genuine cross-matches, with an expectation of about 3 false-positives in our total of 1317 IFRSs.
2.4 Sample selection
Our sample of 1317 IFRSs has been selected with the following criteria:
-
•
Single NVSS source with mJy
-
•
At least one FIRST counterpart within 30 of NVSS source
-
•
WISE counterpart within 5 from FIRST position
-
•
WISE
-
•
The NVSS to WISE flux ratio, 500
-
•
Signal-to-noise ratio (SNR) at m is
-
•
Visually do not appear as radio lobe matched to IR source
We now discuss the selection criteria in detail.
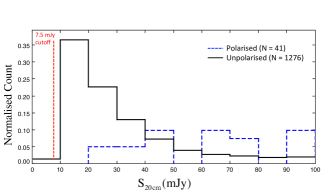
2.4.1 mJy
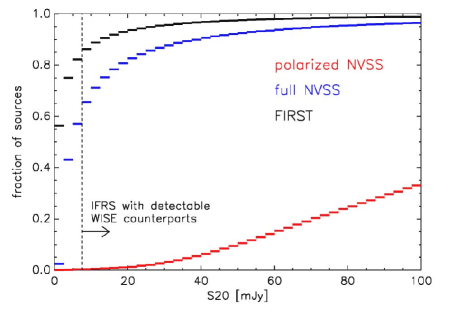
To maximise completeness and minimize polarization bias, we applied a 7.5 mJy cutoff to our NVSS sources from the URC. This flux density corresponds to a 5-sigma detection in the WISE m band and a flux ratio , assuming the best WISE noise level is 3 Jy (see Fig. 4). At this level, WISE is far from complete (see Fig. 5), due to its non-uniform depth across the sky.
2.4.2 FIRST counterparts
We extracted from the URC all NVSS radio sources with at least one FIRST counterpart. The angular resolution of NVSS is , while the angular resolution of FIRST is at 20 cm, making the FIRST position more accurate than the NVSS position when matching with counterparts in other surveys. We use the higher angular resolution data of FIRST for the accurate positional information, whilst using the NVSS flux density as a measure of the total integrated flux density of all of the FIRST components, which generally number between 1 and 3. Using NVSS data also allows us to match sources from the NVSS rotation measure (RM) catalogue (Taylor et al., 2009), which consists of RMs for polarized sources from the NVSS catalogue, from which we extracted 41 matches.
After applying an NVSS radio flux density cutoff at mJy and selecting only sources with at least one FIRST counterpart in the URC, we had radio sources.
2.4.3 WISE counterpart within 5 of FIRST position
When matching the radio sources to WISE, we want to ensure that at z 0.5, the corresponding linear separation is 30 kpc, smaller than the size of large spiral galaxies. This limit reduces confusion and is consistent with the observed limits on the projected sizes of previous IFRSs. Therefore, WISE counterparts were searched for in a radius from the FIRST positions. Of the 312 514 preselected radio sources, 137 154 WISE matches detected at in band W1 were found.
2.4.4 IFRS selection
We then applied our IFRS selection, using the Zinn et al. (2011) criteria (i.e. and 500), as well as the criterion that the SNR at m is . This resulted in a total of 1471 candidate IFRSs.
2.4.5 Visual inspection
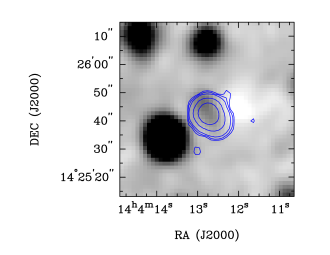
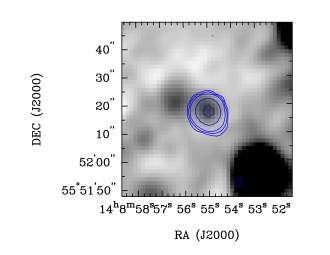
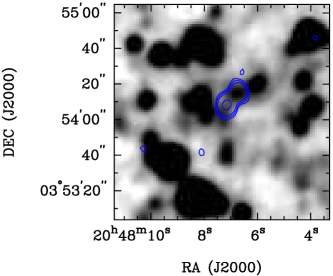
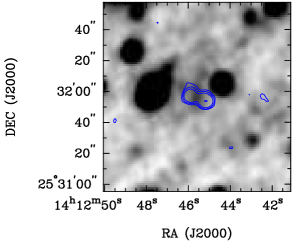
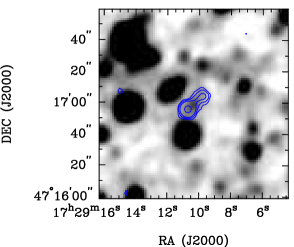
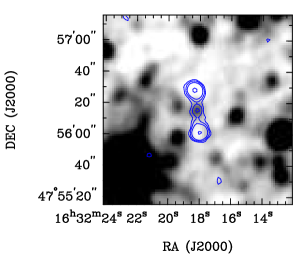
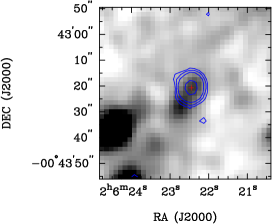
As the radio emission can originate from the the lobes or the central area of the host galaxy, the candidate IFRSs were visually inspected, to ensure that no radio lobes from a nearby source were spuriously matched to a WISE source. In many cases, the IFRSs were resolved into several FIRST components, which could be identified as nuclei or lobes when overlaid as contours on a WISE greyscale image. If the radio emission came from the lobe of the radio source and overlapped with a WISE galaxy, this was not considered an IFRS, and so was discarded from the sample, to reduce the number of misidentifications. 154 sources were discarded during the visual inspection. Fig. 6 shows two detected IFRSs and Fig. 7 shows a discarded IFRS.
2.4.6 Final IFRS catalogue
The final IFRS catalogue consists of 1317 sources, 41 of which have matches in the Taylor et al. (2009) RM catalogue. Table 1 lists the FIRST RA and DEC, the radio and infrared flux densities and their ratio (), the bias corrected fractional polarization and RM, and the radio spectral index for the 41 polarized IFRSs. The full table of 1317 IFRSs is available in the electronic version, which includes a number of additional columns.
| FIRST RA | FIRST DEC | Fractional | Rotation Measure | ||||
|---|---|---|---|---|---|---|---|
| (J2000) | (mJy) | (Jy) | Polarization | (rad m-2) | |||
| 02:16:36.78 | 00:24:51.36 | 44.47 1.40 | 28.10 5.90 | 1583 393 | 11.57% | 19.3 11.9 | |
| 02:17:06.19 | 05:31:09.58 | 131.66 4.65 | 29.05 5.30 | 4533 1016 | 5.35% | 20.6 9.7 | |
| 02:25:45.07 | 06:37:53.99 | 23.81 0.83 | 25.60 5.38 | 930 235 | 12.19% | 11.5 16.7 | |
| 02:29:29.97 | 04:53:19.90 | 72.70 2.22 | 28.67 5.23 | 2536 554 | 8.63% | 17.9 10.1 | |
| 02:31:52.06 | 02:26:47.48 | 60.19 2.24 | 28.70 5.61 | 2097 504 | 6.92% | 13.7 15.8 | |
| 11:13:54.32 | 35:12:33.97 | 45.00 1.73 | 26.78 5.57 | 1680 427 | 9.78% | 50.7 15.1 | |
| 11:44:06.17 | 56:54:39.63 | 171.63 5.16 | 30.00 5.44 | 5721 1241 | 3.92% | 9.4 9.3 | 0.69 |
| 13:25:13.02 | 05:48:10.59 | 94.28 2.86 | 28.44 5.63 | 3315 776 | 4.25% | 4.3 15.8 | |
| 13:54:03.81 | 05:05:44.21 | 91.31 3.30 | 27.97 5.35 | 3264 765 | 5.28% | 17.5 13.2 | |
| 13:55:02.25 | 16:10:23.64 | 197.37 5.93 | 25.94 5.13 | 7610 1780 | 3.02% | 7.3 13.3 | |
| 14:04:12.73 | 14:25:42.47 | 137.28 4.14 | 26.86 4.96 | 5111 1126 | 6.37% | 8.6 5.5 | |
| 14:08:54.99 | 55:52:17.62 | 62.86 1.93 | 26.42 4.99 | 2380 537 | 5.51% | 9.5 15.4 | 0.69 |
| 14:12:22.77 | 28:54:02.20 | 127.16 4.36 | 27.11 5.48 | 4691 1142 | 5.64% | 13.3 9.2 | 0.98 |
| 14:24:21.25 | 20:14:55.25 | 186.60 5.61 | 22.90 4.94 | 8148 2055 | 3.21% | 8.8 10.9 | |
| 14:29:33.30 | 12:26:01.06 | 66.54 2.04 | 22.90 4.61 | 2905 691 | 6.94% | 12.8 12.3 | |
| 14:30:18.96 | 08:26:12.22 | 96.19 2.91 | 26.91 5.29 | 3575 833 | 3.85% | 16.0 15.0 | |
| 14:36:53.44 | 42:44:16.99 | 276.94 9.81 | 25.94 4.93 | 10678 2480 | 3.59% | 0.1 6.9 | |
| 14:38:32.97 | 29:33:54.70 | 290.19 8.71 | 28.00 4.59 | 10365 2064 | 1.77% | 35.4 12.0 | 0.77 |
| 14:41:57.04 | 41:51:01.80 | 72.62 2.22 | 25.04 5.29 | 2900 719 | 6.08% | 10.9 12.9 | 1.01 |
| 14:48:55.62 | 53:52:10.43 | 109.01 3.29 | 22.86 4.80 | 4768 1176 | 3.49% | 53.1 14.9 | 0.87 |
| 14:54:13.84 | 53:38:04.11 | 135.50 4.08 | 28.54 4.68 | 4747 946 | 2.81% | 29.5 13.8 | 0.90 |
| 15:01:36.29 | 05:27:25.64 | 248.49 7.47 | 27.61 5.16 | 9000 2003 | 2.73% | 17.2 9.4 | |
| 15:02:51.14 | 60:09:41.68 | 128.96 3.89 | 28.46 3.98 | 4531 789 | 5.59% | 4.8 8.1 | 0.91 |
| 15:04:22.70 | 05:58:16.47 | 127.94 3.86 | 29.80 5.93 | 4292 1009 | 5.10% | 8.4 10.8 | |
| 15:08:46.27 | 41:27:50.23 | 407.60 14.38 | 27.36 3.82 | 14898 2681 | 6.25% | 6.9 2.8 | 0.82 |
| 15:09:04.89 | 03:09:17.66 | 49.32 2.13 | 25.44 5.46 | 1939 517 | 13.69% | 16.1 11.2 | |
| 15:10:04.47 | 60:29:24.64 | 77.46 2.36 | 23.89 4.00 | 3242 658 | 4.99% | 6.5 17.0 | 1.02 |
| 15:10:20.14 | 35:40:43.09 | 28.28 0.93 | 28.15 3.49 | 1005 162 | 13.98% | 3.5 16.5 | 0.61 |
| 15:28:21.90 | 21:14:59.25 | 39.52 1.25 | 23.44 4.53 | 1686 390 | 8.01% | 27.6 20.0 | |
| 15:30:22.57 | 06:44:07.97 | 293.14 8.80 | 28.49 5.04 | 10289 2186 | 3.35% | 5.2 5.8 | |
| 15:40:43.74 | 46:44:48.06 | 116.36 3.51 | 18.81 3.35 | 6188 1322 | 2.76% | 9.9 16.8 | 1.23 |
| 15:51:28.21 | 64:05:37.28 | 683.19 20.50 | 16.82 3.37 | 40612 9587 | 2.95% | 45.3 7.6 | 0.35 |
| 15:56:48.48 | 55:39:05.80 | 61.22 1.88 | 20.72 3.09 | 2955 545 | 5.85% | 30.1 16.4 | 0.89 |
| 16:11:39.63 | 46:18:51.12 | 47.67 1.48 | 26.81 3.30 | 1778 281 | 7.01% | 4.0 17.0 | 0.83 |
| 16:13:34.76 | 45:46:54.40 | 97.08 2.94 | 24.20 3.38 | 4011 699 | 3.16% | 53.8 15.4 | 0.89 |
| 16:14:19.24 | 59:59:33.77 | 273.78 8.22 | 29.91 3.65 | 9152 1425 | 1.36% | 21.8 17.3 | 0.82 |
| 16:22:31.98 | 41:23:22.62 | 113.66 3.43 | 29.80 4.80 | 3813 747 | 4.09% | 32.8 14.2 | 1.10 |
| 16:52:01.27 | 47:05:01.96 | 110.82 3.35 | 29.56 5.17 | 3749 789 | 3.96% | 2.0 11.9 | 0.90 |
| 17:04:21.92 | 41:54:35.88 | 116.46 3.52 | 28.62 6.04 | 4069 1008 | 6.32% | 29.6 7.9 | 0.97 |
| 17:04:32.08 | 54:56:42.91 | 34.96 1.12 | 21.32 3.87 | 1640 359 | 10.23% | 14.1 15.6 | 0.61 |
| 17:16:25.50 | 33:05:50.64 | 176.16 6.24 | 27.94 5.19 | 6304 1436 | 6.46% | 24.2 6.0 | 0.94 |
2.5 Ancillary data
Ancillary data were searched for in the Parkes-MIT-NRAO (PMN; Griffith et al., 1995), VLA Low-Frequency Sky Survey (VLSS; Lane et al., 2008), Spitzer and Sloan Digital Sky Survey (SDSS; Ahn et al., 2012) catalogues. Misidentification rates were estimated for these using the same procedure as outlined in § 2.3. Table LABEL:ancillary summarises the ancillary data gathered for our sample of IFRSs from these various surveys. The ancillary data can be found within the full table, available in the electronic version.
There are 31 IFRSs that have a counterpart in one of the following surveys from the Spitzer Space Telescope: SWIRE (9); FLS (5); Spitzer Deep Wide-Field Survey (SDWFS) (1); the ‘Spitzer Enhanced Imaging Products Explanatory’ from the NASA/IPAC Infrared Science Archive (IRSA)222http://irsa.ipac.caltech.edu/cgi-bin/Gator/nph-scan?submit=Select&projshort=SPITZER (16) (Lonsdale et al., 2003; Lacy et al., 2005; Fadda et al., 2006; Ashby et al., 2009; Teplitz et al., 2012). The aperture and colour corrected 3.6m flux densities from Spitzer are consistent with our 3.4m flux densities from WISE, since only nine sources lay outside the 1 uncertainty, as expected by chance.
There are 230 SDSS matches to our IFRSs, which yield a cross-match rate of 17 per cent. SDSS DR9 has a 95 per cent completeness for point sources, to AB magnitude limits of 22.0, 22.2, 22.2, 21.3 and 20.5, respectively in bands ugriz. The optical magnitudes quoted refer to the SDSS model magnitudes, which are measured using a weighting function as determined from the object’s brightness in band r.
SDSS DR9 was also queried for spectroscopic redshifts, which were searched for within a 2 arcsec radius of the FIRST positions of our sample. 19 spectra were returned. No flags were given in the field zWarning, and all had reduced spectral fit values of 2, apart from three which had values of 2.06, 3.19 and 7.06. All spectra were ‘science primary’, which ensured they were the best spectra available at each location.
| Survey | Telescope | Reference | Mean Resolution | Astrometric Precision | Search Radius | Misidentification | Matches |
|---|---|---|---|---|---|---|---|
| (arcsec) | (arcsec) | (arcsec) | Rate | ||||
| Various | Spitzer | – | 1.66 | 0.2 | 5 | 1% | 31 |
| SDSS DR9 | Sloan | Ahn et al. (2012) | 1.3 | 0.1 | 2 | 3% | 230 |
| PMN | Parkes | Griffith et al. (1995) | 300 | 10 | 120 | 10% | 19 |
| VLSS | VLA | Lane et al. (2008) | 80 | 8 | 15 | 3% | 214 |
2.5.1 Searching NED
To search for additional spectroscopic redshifts, the NASA/IPAC Extragalactic Database (NED; Schmitz et al., 2011) was queried for each IFRS to within 2 arcsec. Of the 1317 IFRSs, 1137 unique matches were found for 1007 IFRSs, including duplicates. For the sake of simplicity, we discarded duplicate sources and simply kept the closest match from NED.
Six of the 19 spectroscopic redshifts from SDSS were returned from NED, which contained SDSS data only as recent as DR4. Additionally, 16 photometric redshifts were found (Verkhodanov et al., 2002; Richards et al., 2004; Abazajian et al., 2004, 2005; Hsieh et al., 2005; Adelman-McCarthy et al., 2006; Tinti & de Zotti, 2006; Schmidt et al., 2006; Rowan-Robinson et al., 2008; El Bouchefry, 2009), but we do not use these photometric redshifts in our analysis as it is unlikely that the SED templates used match those of our IFRSs.
2.5.2 Survey fields
A number of our IFRSs were found within deep survey fields that have a large amount of multi-wavelength coverage. Table LABEL:deepFields lists the number of sources from our sample that were identified to be within the approximate boundaries of several deep fields. The sources located within these deep fields can be found in the full table, available in the electronic version.
| Deep Field | Reference | Matches |
|---|---|---|
| All-Wavelength Extended Groth Strip International Survey (AEGIS) | Davis et al. (2007) | 1 |
| Bootes1 | Murray et al. (2005) | 2 |
| European Large Area ISO Survey-North 1 (ELAIS-N1) | Oliver et al. (2000) | 5 |
| European Large Area ISO Survey-North 2 (ELAIS-N2) | Oliver et al. (2000) | 1 |
| SDSS Stripe 82 | Abazajian et al. (2009) | 12 |
| VLA First Look Survey (FLS) | Condon et al. (2003) | 1 |
| XMM Large Scale Structure (XMM-LSS) SWIRE Boundaries | Lonsdale et al. (2003) | 22 |
3 Results and Analysis
Our final sample consists of 1317 IFRSs in 11 000 deg2, although the area where WISE is sensitive enough to find IFRSs is much smaller. This implies a lower limit to the sky density of 0.1 per deg2 for mJy. Using more sensitive observations, Norris et al. (2011) estimated a sky density of 7 per deg2 for mJy. Additionally, the four sources in their sample with SmJy have a higher density of 0.5 per deg2.
3.1 WISE and NVSS detections
3.1.1 NVSS 20cm flux density
Because of our 7.5 mJy cutoff, the 20 cm flux densities found for our sample are much greater than those found for the first generation IFRSs. The distribution in the NVSS 20 cm flux density from 0 – 100 mJy for our IFRSs can be seen in Fig. 8.
3.1.2 NVSS 20cm polarization
We matched our IFRS source list to the Taylor
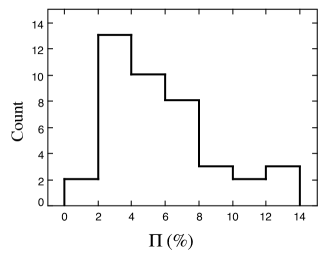
et al. (2009) RM catalogue, which lists polarized NVSS sources down to . We accepted those sources with a match to our IFRS source list and a percentage polarization greater than 1 per cent per cent), since below this level, the instrumental on-axis polarization becomes significant. This resulted in extracting 41 polarized IFRSs, which increases the number of known IFRSs by five-fold. Fig. 9 shows the distribution of fractional polarization and RMs for our polarized IFRSs, which have fractional polarizations between 1 per cent and 14 per cent, and a median of 5.4 per cent. This is consistent with the findings of Middelberg
et al. (2011) and Banfield et al. (2011), who respectively found fractional polarizations ranging from per cent, and per cent for their samples of IFRSs.
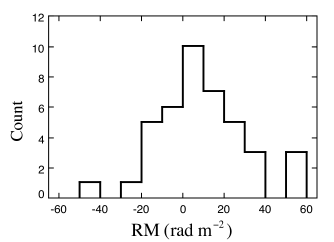
The RMs values of our polarized IFRSs range from rad m-2 and have a mean at 9.3 rad m-2. If we neglect how the Galactic RM varies with Galactic latitude, since our IFRSs happen to be located more than 20 degrees away from the Galactic plane, then based on Schnitzeler (2010), the polarized NVSS sources will show a RM of 14 rad m-2, where RM 6 rad m-2 is the scatter in intrinsic RMs of polarized NVSS sources. This is close to the RM = 16 rad m-2 estimated using robust statistics from the binned RMs in Fig 9. Therefore, the RMs for our polarized IFRSs are similar to those of typical polarized NVSS sources.
However, the distribution of the properties of our polarized IFRSs cannot be effectively compared to the general population of polarized sources, since we have not corrected our sample for incompleteness. Banfield et al. (2014, in prep.) will investigate the radio polarization properties of a sample of IFRSs not suffering from incompleteness.
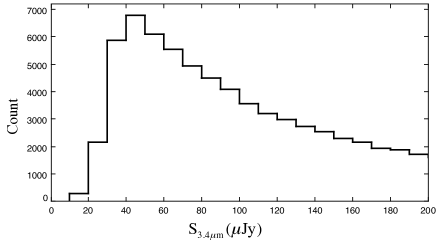
3.1.3 WISE flux densities
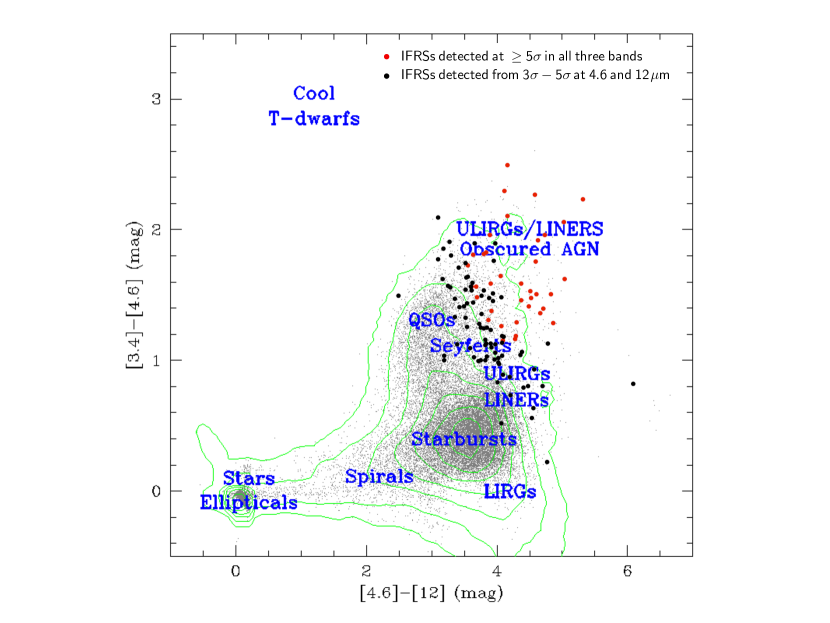
Fig. 10 shows a colour-colour diagram of the IFRSs detected at 3.4, 4.6, and m, as compared to those from Cutri et al. (2011). This figure reveals that the majority of our IFRSs have WISE colours similar to those found for obscured AGN, quasars and Seyferts (Jarrett et al., 2011; Assef et al., 2013).
The distribution in the WISE flux densities for our IFRS sample is listed in Table 4. We show the number of IFRSs detected at in the WISE bands that are polarized at 20 cm compared to the IFRSs with no detectable polarization. The numbers are consistent in both groups indicating that the polarized IFRSs are similar to the unpolarized IFRSs in the infrared. However, from the cm flux densities, we conclude that our sample of polarized IFRSs are AGN, as Grant et al. (2010) determined that polarized sources with mJy are lobe-dominated AGN. As can be seen in Table 4, the number of sources detected in the infrared decreases with increasing wavelength, partly because of the lower sensitivity of WISE at longer wavelengths, and partly because the sources typically follow a power-law SED.
| Unpolarized | 1276 | 458 () | 47 () | 8 () |
|---|---|---|---|---|
| Polarized | 41 | 17 () | 1 () | 0 () |
| All Sources | 1317 | 475 () | 48 () | 8 () |
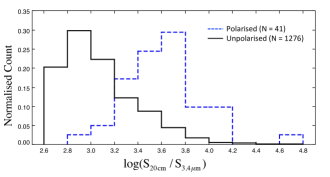
3.1.4 Radio-IR flux density ratios
Fig. 11 shows the radio to infrared flux density ratio for all of our sources. This is similar to the distribution in for the sample from Middelberg et al. (2011), although peaks slightly lower, since our sources are brighter in the infrared.
We also calculate the radio to far-infrared (FIR) ratio , using 22 m flux densities for 31 sources detected at 3 and above, and 22 m 3 upper limits for the remaining 372 sources that had reliable r.m.s. noise () estimates. Those detected all have values , while those with upper limits all have values . From the 31 sources with Spitzer counterparts, four had detected counterparts at 24 m, for which we found . These values of and are all well below those seen for SFGs, which are typically (Appleton et al., 2004), suggesting that the vast majority of our sources are AGN.
3.2 Radio morphology
The number of resolved and compact IFRSs from our sample was determined using two different methods: flux density ratios and visual inspection. We adopt the Kimball & Ivezić (2008) criterion for the definition of a source that is unresolved in FIRST, which has a ratio between its peak flux and integrated flux density of
| (4) |
The number of resolved and unresolved IFRSs that were found using these two methods is given in Table 5. The compactness of our sources can be used as a proxy for their projected linear size, since in CDM, at , the angular size corresponding to a fixed linear size varies only weakly with . Sources that are unresolved in FIRST have linear sizes kpc at any redshift .
| Flux Density Ratio | Visual Inspection | Both | |
|---|---|---|---|
| Unresolved | 845 (13) | 946 (12) | 760 (5) |
| Resolved | 472 (28) | 371 (29) | 286 (21) |
From the 946 IFRSs that appeared resolved from visual inspection, 157 had uncertain morphologies, and 214 had double-lobed morphologies (most likely FR II galaxies), which included sources with a single catalogued FIRST component that could still be identified as a double-lobed galaxy (e.g. Fig. 12 (top)). Of the 41 polarized sources, 23 had morphologies of a double-lobed galaxy, 6 appeared resolved with unknown morphologies, while the remaining 12 sources appeared unresolved. Fig. 12 shows some examples of IFRSs with double-lobed morphologies with one, two and three catalogued components in FIRST. The double-lobed morphologies are consistent with previous hypotheses about IFRSs, which have found that IFRSs are well represented by more distant FR II galaxies. However, the majority of our sources are unresolved, like the IFRSs from Middelberg et al. (2011), suggesting they may be younger radio galaxies with smaller jets.
A much larger fraction of polarized IFRSs have resolved morphologies ( 70 per cent), compared to the unpolarized IFRSs that have resolved morphologies ( 35 per cent). This is consistent with that found by Banfield et al. (2011), who found that 80 per cent of their polarized sources and 15 per cent of their sources with no detected polarization were resolved. It is also consistent with the number of lobe-dominated AGN we expect for polarized sources with mJy (Grant et al., 2010).
3.3 Radio spectra
3.3.1 Spectral shape
From the URC, we extracted flux densities at 326, 1400 and 4850 MHz ( 92, 20 and 6 cm), respectively from WENSS, NVSS, and GB6. In order to derive the radio spectra, we used the flux densities from two or three of these frequencies. Because it was not possible to match the beamsizes and epoch of observation of the various surveys, the flux density at a particular frequency was used only if the source:
-
1.
was unconfused;
-
2.
was unresolved (according to equation 4, except at 6 cm);
-
3.
was the only match within 30 of NVSS source;
-
4.
had no error flags;
Although upper limits of the flux densities cannot be effectively used to determine the spectral index, they are effective in constraining the shape of the radio spectra. Therefore, we measure the shape of the radio spectrum for our IFRSs using all the flux densities available ( always available) and where this is unavailable, upper limits. Where the detection is not significant, a 5 upper limit is attributed to the source. Where no detection is made within the WENSS or GB6 footprint (i.e. when the source does not appear in the WENSS or GB6 catalogue, but is still in its footprint), an upper limit of 18 mJy is attributed to the source, since this is the sensitivity limit of both the WENSS and GB6 surveys. To identify GPS sources, we use the flux densities and limits from all three frequencies, since at least three points are needed to identify a peak. We define a GPS source as a source that:
-
1.
is unresolved in FIRST;
-
2.
contains a positive spectral index between 92 and 20 cm and a negative spectral index between 20 and 6 cm;
-
3.
has a minimum 20 cm flux density of greater than the expected value at 20 cm as extrapolated from the spectral index fit between the two points and , where S is the 1 error in the flux density.
The last of these criteria ensures that the peak lies outside the uncertainty in the spectral index, separating the GPS sources from the flat-spectrum sources. We also use this criterion to identify curvature in other radio spectra. We define a CSS source as a source that:
-
1.
is unresolved in FIRST;
-
2.
has a spectral index of .
To identify CSS sources, we use flux densities from two or three frequencies, and upper limits on the flux density only at and , since we expect all CSS sources with mJy to be detected in WENSS.
We find that 208 of our IFRSs have a steep spectrum of , while 32 have a gigahertz-peaked spectrum. All of these GPS candidates and 124 of the CSS candidates are considered compact in FIRST according to equation 4, and we therefore respectively define them as GPS and CSS sources. Fig. 13 shows the radio spectra of a GPS and a CSS source from our sample. These findings are consistent with Middelberg et al. (2008b) and Middelberg et al. (2011), who found that their IFRS sample consisted of GPS and CSS sources, based on finding compact AGN cores and curvature in the radio spectra. This implies that a substantial fraction of our IFRSs are young and evolving AGN, with jets that have not broken out far beyond the galaxy.
Of the 13 polarized sources that are compact according to equation 4, six are CSS sources, three are USS sources, and one is a GPS source.


3.3.2 Spectral indices
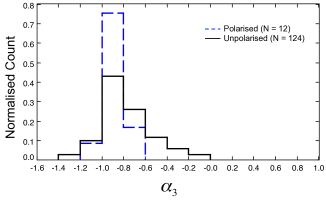
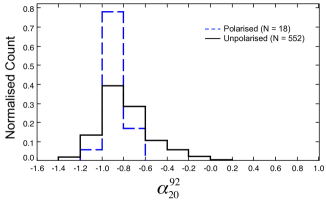
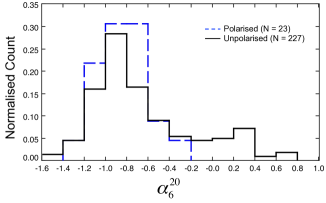
We derived spectral indices using a least squares fit in the log-log domain for all sources that: (1) had a signal-to-noise ratio ; (2) did not show a GPS spectrum. Given the 18 mJy sensitivity limits at 92 and 6 cm, sources close to the median 20 cm flux density of 25.5 mJy will not be detected at 92 cm if they are shallower than , nor at 6 cm if they are steeper than . Hence there is a large bias on our spectral indices, with the 6 cm data tending to give shallower spectral indices, and the 92 cm tending to give steeper spectral indices.
The median values of the spectral index for three different groupings of frequencies are listed in Table 6, and their distributions are shown in Fig. 14. We find that our sample is made up of USS, steep, flat and inverted sources, as shown in Fig. 15. Banfield et al. (2011) and Middelberg et al. (2011) found much steeper median spectral indices of and (with the majority of sources having ) when they studied the ELAIS-N1 and ATLAS fields respectively. Those from Banfield et al. (2011) were measured from the flux densities at 92 and 20 cm. However, the spectral indices from Middelberg et al. (2011) were calculated primarily from the flux densities at 20, 13, 6 and 3 cm, and in some cases, also from the 36 cm flux densities. Therefore a GPS source will appear to be steeper when measured at the frequencies used by Middelberg et al. (2011) than at the frequencies measured in this paper.
Inverted sources with are possibly very young GPS sources that peak above 4850 MHz, like those seen by Hancock (2009). These could also be variable sources with varying flux densities across the different epochs, or Blazars.
Objects with steep radio spectra are more likely to be found at high redshifts than objects with flatter radio spectra, and the USS criterion () has been employed to discover most of the known radio galaxies at (Norris et al., 2013, and references therein). Most of our IFRSs have steep spectral indices (see Table 6), and many are USS, suggesting that a significant fraction of them are likely to be located at high redshifts.
| Wavelengths used to fit | |||||||
|---|---|---|---|---|---|---|---|
| 92, 20 & 6 cm () | 136 | 12 | 124 | 16 | |||
| 92 & 20 cm () | 570 | 18 | 552 | 84 | |||
| 20 & 6 cm () | 249 | 23 | 227 | 55 |


3.4 Optical matches
Most of our IFRSs are undetected in SDSS to the limiting magnitude of r , which is consistent with previous studies of IFRSs, in which few optical counterparts were found. The distribution of the SDSS r magnitudes for the 230 detected sources is shown in Fig. 16 (bottom), which shows an increase up to a magnitude of 22.2, beyond which SDSS becomes highly incomplete. This shows that at least a fraction of our IFRSs are also optically brighter than first generation IFRSs. The WISE sources studied by Yan et al. (2013) peak at an SDSS r magnitude of 20, and these sources lie almost entirely at . This suggests that most of our IFRSs are likely to lie at redshifts of , but could also be at and suffer from more obscuration than typical WISE galaxies.
3.5 Redshifts
| RA | DEC | Spectroscopic | S20 | L20 | S3.4 | L3.4 | S20/S3.4 | Sky Separation | Class |
|---|---|---|---|---|---|---|---|---|---|
| J2000.0 | redshift | [mJy] | [W Hz-1] | [Jy] | [W Hz-1] | [arcsec] | |||
| 02:06:22.45 | 00:43:20.68 | 2.3767 0.0005 | 19.9 0.7 | 8.8 | 28.3 5.8 | 1.2 | 703 175 | 0.124 | BL QSO |
| 11:35:41.11 | 45:40:42.85 | 2.1420 0.0007 | 17.3 0.7 | 5.9 | 29.1 5.5 | 9.9 | 594 140 | 0.797 | BL QSO |
| 11:36:34.93 | 61:06:20.53 | 2.0296 0.0005 | 18.3 0.7 | 5.5 | 27.3 5.5 | 8.2 | 670 164 | 1.360 | BL QSO |
| 12:27:43.49 | 36:42:55.74 | 2.1151 0.0015 | 24.1 0.8 | 8.0 | 28.8 6.2 | 9.5 | 836 216 | 0.205 | QSO |
| 13:29:22.21 | 05:20:14.38 | 2.9943 0.0004 | 44.5 1.4 | 3.4 | 29.9 6.4 | 2.3 | 1487 374 | 0.251 | QSO |
| 13:55:04.58 | 36:38:02.00 | 2.2817 0.0006 | 15.9 0.6 | 6.4 | 28.8 5.6 | 1.1 | 555 133 | 0.184 | BL QSO |
| 14:08:55.02 | 55:52:17.96 | 2.5526 0.0002 | 62.9 1.9 | 3.3 | 26.4 5.0 | 1.4 | 2380 537 | 0.393 | BL QSO |
| 14:19:18.81 | 39:40:35.87 | 0.0196 0.0000 | 18.5 1.0 | 1.6 | 26.7 4.4 | 2.3 | 695 159 | 0.500 | SFG |
| 14:29:48.64 | 02:59:21.28 | 2.6837 0.0005 | 18.7 0.7 | 1.1 | 27.4 5.8 | 1.6 | 682 175 | 0.115 | BL QSO |
| 14:38:21.80 | 34:40:00.94 | 2.3452 0.0010 | 10.7 0.5 | 4.6 | 20.4 4.3 | 8.7 | 526 141 | 0.324 | QSO |
| 14:52:51.72 | 52:39:56.05 | 2.3372 0.0005 | 126.1 3.8 | 5.3 | 22.7 4.7 | 9.6 | 5551 1349 | 0.131 | BL QSO |
| 14:55:06.54 | 06:40:18.92 | 2.2183 0.0003 | 51.5 1.6 | 1.9 | 23.0 5.0 | 8.6 | 2237 574 | 0.081 | BL QSO |
| 15:16:09.85 | 22:25:07.80 | 2.7756 0.0008 | 20.1 0.7 | 1.3 | 23.1 4.5 | 1.5 | 871 207 | 0.036 | QSO |
| 15:17:03.80 | 24:01:27.51 | 2.9306 0.0005 | 18.1 0.7 | 1.3 | 29.2 4.4 | 2.1 | 620 120 | 0.260 | BL QSO |
| 15:20:44.37 | 27:06:36.38 | 2.7324 0.0003 | 46.8 1.5 | 2.9 | 25.9 4.7 | 1.6 | 1803 393 | 0.218 | BL QSO |
| 15:33:17.30 | 12:18:00.89 | 2.7974 0.0016 | 23.3 0.8 | 1.5 | 25.0 4.3 | 1.6 | 932 197 | 0.261 | BL QSO |
| 15:38:26.90 | 14:55:05.29 | 2.6189 0.0002 | 15.1 0.6 | 8.4 | 27.1 5.2 | 1.5 | 558 134 | 1.428 | BL QSO |
| 15:43:14.72 | 32:51:38.19 | 2.2652 0.0003 | 50.3 1.6 | 2.0 | 20.2 4.2 | 7.9 | 2495 617 | 0.759 | BL QSO |
| 17:26:16.51 | 32:16:20.01 | 2.6405 0.0008 | 28.4 0.9 | 1.6 | 24.2 4.5 | 1.4 | 1175 267 | 0.203 | BL QSO |
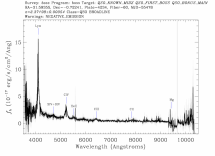
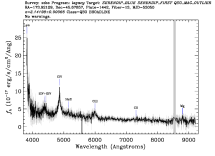
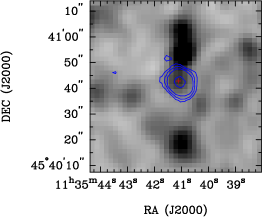
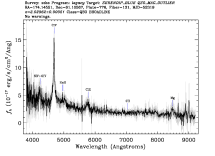
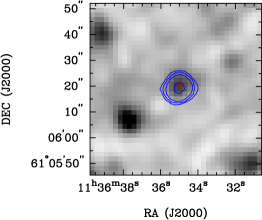
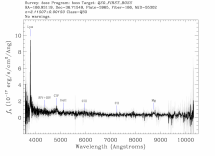
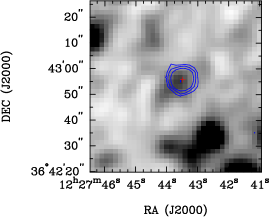
Table LABEL:allZs lists the 19 sources which have spectroscopic redshifts in SDSS DR9. Their spectra and postage stamps are shown in Fig. 17 in Appendix A. 18 of these sources are identified as quasars in the range , 14 of which contain broad emission lines. Their strong radio emission means that they are necessarily radio-loud quasars.
One source is identified as a SFG at a redshift of , which clearly hosts an AGN, because of its high flux density ratio SS3.4μm and its GPS spectrum. This source is probably either a misidentification, or a composite galaxy with a radio-loud AGN embedded within a SFG, similar to F00183-7112 (Norris et al., 2012).
Because these sources with spectroscopy are much brighter than first generation IFRSs, they probably represent the closer and brighter tail end of the IFRS population. This is also suggested by the distribution in 3.4m flux density for these sources (Fig. 16), which ranges from Jy and has a higher median of 26.7Jy, as compared to the rest of the sample, which ranges from Jy and has a median of 25.9Jy. Fig. 16 demonstrates that the sources with spectroscopic redshifts are taken from the upper half of the infrared and optical brightness distribution, implying that the fainter half is located at higher redshift. Despite being brighter in the optical and infrared, these 18 sources are still classified as IFRSs and share the same region in space as HzRGs (Fig. 1).
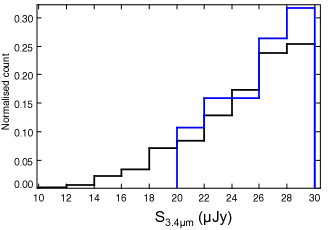
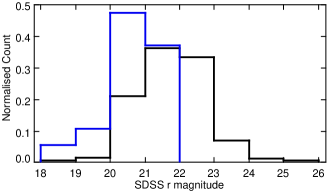
Fig. 2 shows where our WISE IFRSs with spectroscopy appear in the diagram adapted from Norris et al. (2011). Our sources are very densely concentrated around Jy in this figure and do not have sufficient range in IR flux density to show the observed relation, although they are consistent with it. From this we conclude that distance, rather than dust obscuration, is likely to be the main mechanism for the infrared-faintness of our sample of IFRSs. Furthermore, Fig. 1 and 2 confirm our hypothesis that at least a fraction of IFRSs are indeed high-redshift radio-loud AGN.
3.6 X-ray data
El Bouchefry (2009) identified an X-ray counterpart in the Chandra XBoötes survey for one of the IFRSs from our sample (IFRS ID 545 in full catalogue). The source respectively has a soft (0.52 keV), hard (27 keV) and full-band (0.57 keV) X-ray flux of 0.44, 0.46 and 0.99 erg s-1 m -2. This gives a hardness ratio (HR)333The HR is defined as HR , where and are respectively the number of counts detected in the keV and keV bands. of , from which El Bouchefry (2009) concludes that the source is a type 1 (unobscured) AGN. The IFRS has an X-ray to optical flux ratio of , which El Bouchefry (2009) states is well within the expected locus for a typical AGN (0 1), rather than that for a SFG or a low luminosity AGN, which typically have . The source is fitted with a photometric redshift of . However, this is an incorrect photometric redshift, since we find an SDSS source 0.16 arcsec away with a spectroscopic redshift of (row 10 in Table LABEL:allZs). At this distance, the source has a full-band X-ray luminosity of W.
Further cross-matches from the Chandra and XMM-Newton X-ray Telescopes were searched for within a 5″ radius of the FIRST radio positions for our entire sample using the Chandra Data Archive (Rots, 2000)444http://cda.harvard.edu/chaser/ and the XMM-Newton Science Archive (XSA; Arviset et al., 2002)555http://xmm.esac.esa.int/xsa/index.shtml. No additional matches were found.
4 Discussion
4.1 How our sample relates to the original IFRSs
Our sample consists of much brighter IFRSs than the original first generation IFRSs discovered in ATLAS, since the radio and infrared flux densities are much larger. We suggest that this is due to them being lower-redshift counterparts of the first generation IFRSs. Both generations of IFRSs have ratios of and flux densities Jy, so they are likely to be from the same parent population. Our IFRSs are brighter, and have lower ratios. Our sample has a lower sky density than the first generation IFRSs, which is consistent with them being brighter (and probably closer) versions of the same object.
We find a higher fraction of resolved IFRSs compared to Middelberg et al. (2011), who found no resolved IFRSs. AGN may appear compact in the radio either because (1) their jets are small, suggesting they are quite young (O’Dea, 1998), or (2) they are oriented with their lobes pointed along the line-of-sight of the observer. We find a number of GPS and CSS sources, which is consistent with the first scenario. This suggests that the more compact first generation IFRSs may be more representative of younger radio galaxies than our IFRSs, possibly located at higher redshift in the younger Universe.
The optical magnitudes of our sample are also consistent with this interpretation. Norris et al. (2011) found a median 3.6 m flux density of 0.2 Jy, while Garn & Alexander (2008) found an upper limit on the median 3.6 m flux density of 3.1Jy, which is approximately 10 times brighter. Our median 3.4 m flux density is 26 Jy, approximately 10 times brighter still. If this difference is simply due to cosmic distance, rather than obscuration, we expect the optical brightness to scale in the same way. If the Huynh et al. (2010) optical magnitudes are representative of the population as a whole, first generation (non-detected) IFRSs have typical optical magnitudes of about , while the brighter Garn & Alexander (2008) IFRSs have typical magnitudes of . Our median SDSS magnitude of is 100 times brighter than those from Huynh et al. (2010), the same factor brighter as for the infrared emission. This suggests that obscuration is not the dominant effect in reducing the infrared flux density for these IFRSs.
Furthermore, the spectroscopic redshifts from our sample suggest that the brighter IFRSs are found at and form a continuous population with the faintest IFRSs which are believed to be at . The distribution of redshifts we find is consistent with the results from Huynh et al. (2010), who found that IR-detected IFRSs cannot be explained easily at , but can be modelled at . Huynh et al. (2010) find that the radio-loud quasar 3C 273 at accurately models the SEDs of the IFRSs from their sample. Similarly, all our IFRSs in Table LABEL:allZs are radio-loud quasars.
Herzog et al. (2013) present Very Large Telescope spectra of infrared-detected IFRSs which satisfy the Zinn et al. (2011) criteria, and are similarly brighter IFRSs. The spectra reveal that their IFRSs are located at 2 , have IR and radio luminosities in the range from which HzRGs are selected, and follow their relation, in agreement with our findings for brighter IFRSs.
The place occupied by our IFRSs in space (Fig. 1) suggests that HzRGs, first generation IFRSs and WISE IFRSs are all from the same parent population of radio galaxies.
4.2 Are IFRSs misidentifications?
WISE sources are dominated by low-redshift, low-luminosity objects at (Yan et al., 2013). So objects mistakenly identified with WISE sources should have low redshifts, whereas all of our objects with spectroscopy except one have . This result cannot therefore be attributed to misidentifications. Furthermore, our misidentification rate is estimated to be 0.24 0.27 per cent, so 3 of our sources are false-positives.
4.3 Are IFRSs hotspots or lobes?
The VLBI detections from Norris et al. (2007) and Middelberg et al. (2008b) suggest that at least a third of IFRSs are not radio lobes. Additionally, the majority of IFRSs are unresolved at high resolution. Middelberg et al. (2011) find the vast majority of sources are unresolved on scales of 2 arcsec. From our sample, 845 (64 per cent) of our sources are unresolved at the 5 arcsec FIRST resolution, which puts an upper limit of kpc on their projected linear size at .
Werner et al. (2012) found Spitzer observations of hotspots in the radio lobes of FR II galaxies, ranging in IR flux density from Jy up to 70Jy. It is therefore possible that our sample consists of a number of hotspots. However, 213 of our sources are identified as double-lobed galaxies which have hotspots that are not coincident with the corresponding faint IR source. Additionally, careful inspection was carried out to ensure that the faint WISE sources did not coincide with an identifiable lobe or hotspot. Furthermore, if they were hotspots, the redshifts shown in Table LABEL:allZs would reflect the overall distribution of the radio galaxy population, very few of which are at . We therefore conclude that they are not hotspots.
4.4 Are IFRSs nearby AGN?
We find 18 reliable spectroscopic redshifts from our sample at . This shows that the brightest members of our sample are not nearby AGN. Additionally, we find steep radio spectral indices for most of our sample, as well as many USS sources. This shows that our IFRSs are more likely to be taken from a higher redshift population, particularly in the case of the USS sources. However, we cannot rule out the possibility that some small fraction of our sample is located at low redshift and is suffering from significant dust extinction.
4.5 The nature of IFRSs
In § 3.1.4, we showed that most of our IFRSs are not SFGs. We have also ruled out the hypotheses that their majority is made up of misidentifications, hotspots, lobes or nearby AGN. The radio spectra, WISE colours and many other properties of our sample are consistent with the IFRSs being high-redshift radio-loud AGN. Above all, we have shown that the brightest IFRSs have spectroscopic redshifts , and so we conclude that the IFRSs are most likely high- radio-loud AGN.
Previous studies of IFRSs have been almost entirely unsuccessful in detecting their emission in the infrared and optical bands, resulting in speculations about their nature based only on their radio detections and upper limits in the infrared and the optical. We have shown that there exists a significant population of IFRSs that can be detected in the infrared and optical, which show similar properties to these first generation IFRSs. IFRSs seem to span a continuous population of high-redshift AGN which are from the same parent population of AGN from which HzRGs and their lower redshift versions come.
If IFRSs are high-redshift AGN and follow the relation between redshift and 3.4 m flux density, where those with lower infrared flux densities are found at even higher redshifts, then we have found a very effective way to find HzRGs using their 3.4m emission, a technique parallel to using the K-z diagram (Willott et al., 2003). Therefore WISE provides a great new all-sky method to find many HzRGs, which will be valuable in studying cosmic AGN evolution.
5 Conclusions
We have compiled the first detectable sample of IFRSs, consisting of 1317 sources generated by cross-correlating the NVSS, FIRST and WISE surveys. Below we summarise and discuss our results.
-
•
Our sample is brighter and has a higher sky density than first generation IFRSs, while retaining the same values of distance-independent measures such . This suggests that our sample consists of a lower-redshift, brighter population of IFRSs.
-
•
The 403 sources that have reliable measurements or upper limits of the 22 m flux density all have q, which is strong evidence that they are AGN, rather than SFGs.
-
•
The WISE colours of our sources significantly detected at 3.4, 4.6 and 12m are similar to those of obscured AGN, QSOs and Seyferts.
-
•
41 IFRSs are polarized at levels , with fractional polarizations ranging between 1 14 per cent, and RMs ranging from to 54 rad m-2.
-
•
There are 213 sources that contain double-lobed radio morphologies. The majority of our sources are unresolved, suggesting that most of them are either beamed radio sources or young radio sources with small jets.
-
•
We derive radio spectra for a significant fraction of our sample and find that the majority have steep spectral indices, and many have USS, suggesting that they are more likely to be located at high redshift than low redshift. We also find 32 GPS sources and 124 CSS sources, which is consistent with some of our IFRSs being young radio sources with small jets.
-
•
Amongst our brightest IFRSs, we find 18 spectroscopic redshifts from SDSS DR9, which reveal that these are quasars located at 2 3, giving strong evidence that our IFRSs are high-redshift radio-loud AGN.
-
•
One of these sources at has an X-ray detection, at which redshift it has a luminosity of W. The X-ray hardness ratio suggests that the source is an unobscured AGN.
-
•
The properties of our large sample of IFRSs imply that they are radio-loud AGN at . We suggest that the fainter IFRSs that are undetectable in the infrared represent a population of radio sources at even higher redshift.
-
•
Searching for IFRSs is an effective all-sky method for finding HzRGs and investigating cosmic AGN evolution.
Acknowledgments
This research has made use of the NASA/IPAC Infrared Science Archive and the NASA/IPAC Extragalactic Database (NED) which are operated by the Jet Propulsion Laboratory, California Institute of Technology, under contract with the National Aeronautics and Space Administration. We gratefully acknowledge the people and institutes that contributed to the NVSS and FIRST surveys. This publication makes use of data products from the Wide-field Infrared Survey Explorer, which is a joint project of the University of California, Los Angeles, and the Jet Propulsion Laboratory/California Institute of Technology, funded by the National Aeronautics and Space Administration. Funding for SDSS-III has been provided by the Alfred P. Sloan Foundation, the Participating Institutions, the National Science Foundation, and the U.S. Department of Energy Office of Science. The SDSS-III web site is http://www.sdss3.org/. The National Radio Astronomy Observatory is a facility of the National Science Foundation operated under cooperative agreement by Associated Universities, Inc.
References
- Abazajian et al. (2004) Abazajian K., Adelman-McCarthy J. K., et al. 2004, AJ, 128, 502
- Abazajian et al. (2005) Abazajian K., Adelman-McCarthy J. K., et al. 2005, AJ, 129, 1755
- Abazajian et al. (2009) Abazajian K. N., Adelman-McCarthy J. K., Agüeros M. A., Allam S. S., Allende Prieto C., An D., Anderson K. S. J., Anderson S. F., Annis J., Bahcall N. A., et al. 2009, ApJS, 182, 543
- Adelman-McCarthy et al. (2006) Adelman-McCarthy J. K., Agüeros M. A., et al. 2006, ApJS, 162, 38
- Adelman-McCarthy et al. (2008) Adelman-McCarthy J. K., Agüeros M. A., et al. 2008, ApJS, 175, 297
- Ahn et al. (2012) Ahn C. P., Alexandroff R., Allende Prieto C., Anderson S. F., Anderton T., Andrews B. H., Aubourg É., Bailey S., Balbinot E., Barnes R., et al. 2012, ApJS, 203, 21
- Appleton et al. (2004) Appleton P. N., Fadda D. T., et al. 2004, ApJS, 154, 147
- Arviset et al. (2002) Arviset C., Guainazzi M., Hernandez J., Dowson J., Osuna P., Venet A., 2002, ArXiv Astrophysics e-prints
- Ashby et al. (2009) Ashby M. L. N., Stern D., et al. 2009, ApJ, 701, 428
- Assef et al. (2013) Assef R. J., Stern D., Kochanek C. S., Blain A. W., Brodwin M., Brown M. J. I., Donoso E., Eisenhardt P. R. M., Jannuzi B. T., Jarrett T. H., Stanford S. A., Tsai C.-W., Wu J., Yan L., 2013, ApJ, 772, 26
- Banfield et al. (2011) Banfield J. K., George S. J., Taylor A. R., Stil J. M., Kothes R., Scott D., 2011, ApJ, 733, 69
- Becker et al. (1995) Becker R. H., White R. L., Helfand D. J., 1995, ApJ, 450, 559
- Cameron et al. (2011) Cameron A. D., Keith M., Hobbs G., Norris R. P., Mao M. Y., Middelberg E., 2011, MNRAS, 415, 845
- Condon et al. (1998) Condon J. J., Cotton W. D., Greisen E. W., Yin Q. F., Perley R. A., Taylor G. B., Broderick J. J., 1998, AJ, 115, 1693
- Condon et al. (2003) Condon J. J., Cotton W. D., Yin Q. F., Shupe D. L., Storrie-Lombardi L. J., Helou G., Soifer B. T., Werner M. W., 2003, AJ, 125, 2411
- Cutri et al. (2011) Cutri R. M., Wright E. L., et al. 2011, Technical report, Explanatory Supplement to the WISE Preliminary Data Release Products
- Davis et al. (2007) Davis M., Guhathakurta P., et al. 2007, ApJ, 660, L1
- de Bruyn et al. (2000) de Bruyn G., Miley G., Rengelink R., Tang Y., Bremer M., Rottgering H., Raimond R., Bremer M., Fullagar D., 2000, VizieR Online Data Catalog, 8062, 0
- El Bouchefry (2009) El Bouchefry K., 2009, MNRAS, 396, 2011
- Elvis (1994) Elvis M., 1994, in Courvoisier T., Blecha A., eds, Multi-Wavelength Continuum Emission of AGN Vol. 159 of IAU Symposium, Extreme quasars: observations and constraints. pp 25–28
- Fadda et al. (2006) Fadda D., Marleau F. R., et al. 2006, AJ, 131, 2859
- Fanaroff & Riley (1974) Fanaroff B. L., Riley J. M., 1974, MNRAS, 167, 31P
- Fanti (2009) Fanti C., 2009, Astronomische Nachrichten, 330, 120
- Fazio et al. (2004) Fazio G. G., Hora J. L., et al. 2004, ApJS, 154, 10
- Garn & Alexander (2008) Garn T., Alexander P., 2008, MNRAS, 391, 1000
- Giavalisco et al. (2004) Giavalisco M., Ferguson H. C., et al. 2004, ApJ, 600, L93
- Grant et al. (2010) Grant J. K., Taylor A. R., Stil J. M., Landecker T. L., Kothes R., Ransom R. R., Scott D., 2010, ApJ, 714, 1689
- Gregory et al. (1996) Gregory P. C., Scott W. K., Douglas K., Condon J. J., 1996, ApJS, 103, 427
- Griffith et al. (1995) Griffith M. R., Wright A. E., Burke B. F., Ekers R. D., 1995, ApJS, 97, 347
- Hancock (2009) Hancock P. J., 2009, Astronomische Nachrichten, 330, 180
- Herzog et al. (2013) Herzog A., Middelberg E., Norris R. P., Sharp R., Spitler L. R., 2013, preprint (arXiv:1312.0046)
- Higdon et al. (2005) Higdon J. L., Higdon S. J. U., Weedman D. W., Houck J. R., Le Floc’h E., Brown M. J. I., Dey A., Jannuzi B. T., Soifer B. T., Rieke M. J., 2005, ApJ, 626, 58
- Higdon et al. (2008) Higdon J. L., Higdon S. J. U., Willner S. P., Brown M. J. I., Stern D., Le Floc’h E., Eisenhardt P., 2008, ApJ, 688, 885
- Hsieh et al. (2005) Hsieh B. C., Yee H. K. C., Lin H., Gladders M. D., 2005, ApJS, 158, 161
- Huynh et al. (2010) Huynh M. T., Norris R. P., Siana B., Middelberg E., 2010, ApJ, 710, 698
- Jarrett et al. (2011) Jarrett T. H., Cohen M., et al. 2011, ApJ, 735, 112
- Jarvis et al. (2009) Jarvis M. J., Teimourian H., Simpson C., Smith D. J. B., Rawlings S., Bonfield D., 2009, MNRAS, 398, L83
- Kimball & Ivezić (2008) Kimball A. E., Ivezić Ž., 2008, AJ, 136, 684
- Lacy et al. (2005) Lacy M., Wilson G., et al. 2005, ApJS, 161, 41
- Lane et al. (2008) Lane W. M., Cohen A. S., Cotton W. D., Perley R. A., Condon J. J., Lazio T. J. W., Kassim N. E., Erickson W. C., 2008, in Bridle A. H., Condon J. J., Hunt G. C., eds, Frontiers of Astrophysics: A Celebration of NRAO’s 50th Anniversary Vol. 395 of Astronomical Society of the Pacific Conference Series, The VLA Low-Frequency Sky Survey (VLSS). p. 370
- Lonsdale et al. (2003) Lonsdale C. J., Smith H. E., et al. 2003, PASP, 115, 897
- Maini et al. (2013) Maini A., Prandoni I., Norris R. P., Lacy M., Zinn P.-C., Mignano A., Guglielmino G., Morganti R., 2013, A&A, submitted
- Mauduit et al. (2012) Mauduit J.-C., Lacy M., et al. 2012, PASP, 124, 714
- Middelberg et al. (2008a) Middelberg E., Norris R. P., Cornwell T. J., Voronkov M. A., Siana B. D., Boyle B. J., Ciliegi P., Jackson C. A., Huynh M. T., Berta S., Rubele S., Lonsdale C. J., Ivison R. J., Smail I., 2008a, AJ, 135, 1276
- Middelberg et al. (2008b) Middelberg E., Norris R. P., Tingay S., Mao M. Y., Phillips C. J., Hotan A. W., 2008b, A&A, 491, 435
- Middelberg et al. (2011) Middelberg E., Norris R. P., Hales C. A., Seymour N., Johnston-Hollitt M., Huynh M. T., Lenc E., Mao M. Y., 2011, A&A, 526, A8
- Miller et al. (2013) Miller N. A., Bonzini M., Fomalont E. B., Kellermann K. I., Mainieri V., Padovani P., Rosati P., Tozzi P., Vattakunnel S., 2013, ApJS, 205, 13
- Murray et al. (2005) Murray S. S., Kenter A., Forman W. R., Jones C., Green P. J., Kochanek C. S., Vikhlinin A., Fabricant D., Fazio G., Brand K., Brown M. J. I., Dey A., Jannuzi B. T., Najita J., McNamara B., Shields J., Rieke M., 2005, ApJS, 161, 1
- Norris et al. (2006) Norris R. P., Afonso J., Appleton P. N., Boyle B. J., Ciliegi P., Croom S. M., Huynh M. T., Jackson C. A., Koekemoer A. M., Lonsdale C. J., Middelberg E., Mobasher B., Oliver S. J., Polletta M., Siana B. D., Smail I., Voronkov M. A., 2006, AJ, 132, 2409
- Norris et al. (2011) Norris R. P., Afonso J., Cava A., Farrah D., Huynh M. T., Ivison R. J., Jarvis M., Lacy M., Mao M., Maraston C., Mauduit J.-C., Middelberg E., Oliver S., Seymour N., Surace J., 2011, ApJ, 736, 55
- Norris et al. (2013) Norris R. P., Afonso J., et al. 2013, PASA, 30, 20
- Norris et al. (2012) Norris R. P., Lenc E., Roy A. L., Spoon H., 2012, MNRAS, 422, 1453
- Norris et al. (2007) Norris R. P., Tingay S., Phillips C., Middelberg E., Deller A., Appleton P. N., 2007, MNRAS, 378, 1434
- O’Dea (1998) O’Dea C. P., 1998, PASP, 110, 493
- Oliver et al. (2000) Oliver S., Rowan-Robinson M., et al. 2000, MNRAS, 316, 749
- Polatidis & Conway (2003) Polatidis A. G., Conway J. E., 2003, PASA, 20, 69
- Randall et al. (2011) Randall K. E., Hopkins A. M., Norris R. P., Edwards P. G., 2011, MNRAS, 416, 1135
- Rengelink et al. (1997) Rengelink R. B., Tang Y., de Bruyn A. G., Miley G. K., Bremer M. N., Roettgering H. J. A., Bremer M. A. R., 1997, A&AS, 124, 259
- Richards et al. (2004) Richards G. T., Nichol R. C., et al. 2004, ApJS, 155, 257
- Rieke et al. (2009) Rieke G. H., Alonso-Herrero A., Weiner B. J., Pérez-González P. G., Blaylock M., Donley J. L., Marcillac D., 2009, ApJ, 692, 556
- Rieke et al. (2004) Rieke G. H., Young E. T., et al. 2004, ApJS, 154, 25
- Rosati et al. (2002) Rosati P., Tozzi P., Giacconi R., Gilli R., Hasinger G., Kewley L., Mainieri V., Nonino M., Norman C., Szokoly G., Wang J. X., Zirm A., Bergeron J., Borgani S., Gilmozzi R., Grogin N., Koekemoer A., Schreier E., Zheng W., 2002, ApJ, 566, 667
- Rots (2000) Rots A. H., 2000, in Manset N., Veillet C., Crabtree D., eds, Astronomical Data Analysis Software and Systems IX Vol. 216 of Astronomical Society of the Pacific Conference Series, The Chandra Data Archive. p. 184
- Rowan-Robinson et al. (2008) Rowan-Robinson M., Babbedge T., et al. 2008, MNRAS, 386, 697
- Schmidt et al. (2006) Schmidt S. J., Connolly A. J., Hopkins A. M., 2006, ApJ, 649, 63
- Schmitz et al. (2011) Schmitz M., Baker K., Chan B., Corwin Jr. H., Ebert R., Frayer C., Helou G., LaGue C., Lo T., Madore B., Mazzarella J., Pevunova O., Steer I., Terek S., 2011, in American Astronomical Society Meeting Abstracts #217 Vol. 43 of Bulletin of the American Astronomical Society, The NASA/IPAC Extragalactic Database (NED): Enhanced Content and New Functionality. p. 344.08
- Schnitzeler (2010) Schnitzeler D. H. F. M., 2010, MNRAS, 409, L99
- Seymour et al. (2007) Seymour N., Stern D., De Breuck C., 2007, in Afonso J., Ferguson H. C., Mobasher B., Norris R., eds, Deepest Astronomical Surveys Vol. 380 of Astronomical Society of the Pacific Conference Series, Spitzer Observations of High Redshift Radio Galaxies. p. 393
- Taylor et al. (2009) Taylor A. R., Stil J. M., Sunstrum C., 2009, ApJ, 702, 1230
- Teplitz et al. (2012) Teplitz H. I., Capak P., et al. 2012, in American Astronomical Society Meeting Abstracts #219 Vol. 219 of American Astronomical Society Meeting Abstracts, Spitzer Heritage Archive Enhanced Imaging Products. p. 428.06
- Tinti & de Zotti (2006) Tinti S., de Zotti G., 2006, A&A, 445, 889
- Verkhodanov et al. (2002) Verkhodanov O. V., Kopylov A. I., Pariiskii Y. N., Soboleva N. S., Temirova A. V., Zhelenkova O. P., 2002, Astronomy Reports, 46, 531
- Voges et al. (1999) Voges W., Aschenbach B., et al. 1999, VizieR Online Data Catalog, 9010, 0
- Voges et al. (2000) Voges W., Aschenbach B., et al. 2000, VizieR Online Data Catalog, 9029, 0
- Werner et al. (2012) Werner M. W., Murphy D. W., Livingston J. H., Gorjian V., Jones D. L., Meier D. L., Lawrence C. R., 2012, ApJ, 759, 86
- Willott et al. (2003) Willott C. J., Rawlings S., Jarvis M. J., Blundell K. M., 2003, MNRAS, 339, 173
- Wright et al. (2010) Wright E. L., Eisenhardt P. R. M., et al. 2010, AJ, 140, 1868
- Wright & WISE Team (2009) Wright E. L., WISE Team 2009, in American Astronomical Society Meeting Abstracts #214 Vol. 214 of American Astronomical Society Meeting Abstracts, WISE - the Wide-field Infrared Survey Explorer. p. 217.01
- Yan et al. (2013) Yan L., Donoso E., Tsai C.-W., Stern D., Assef R. J., Eisenhardt P., Blain A. W., Cutri R., Jarrett T., Stanford S. A., Wright E., Bridge C., Riechers D. A., 2013, AJ, 145, 55
- Zinn et al. (2011) Zinn P.-C., Middelberg E., Ibar E., 2011, A&A, 531, A14
Appendix A
![[Uncaptioned image]](/html/1312.1002/assets/x36.png)
![[Uncaptioned image]](/html/1312.1002/assets/x37.png)
![[Uncaptioned image]](/html/1312.1002/assets/x38.png)
![[Uncaptioned image]](/html/1312.1002/assets/x39.png)
![[Uncaptioned image]](/html/1312.1002/assets/x40.png)
![[Uncaptioned image]](/html/1312.1002/assets/x41.png)
![[Uncaptioned image]](/html/1312.1002/assets/x42.png)
![[Uncaptioned image]](/html/1312.1002/assets/x43.png)
![[Uncaptioned image]](/html/1312.1002/assets/x44.png)
![[Uncaptioned image]](/html/1312.1002/assets/x45.png)
![[Uncaptioned image]](/html/1312.1002/assets/x46.png)
![[Uncaptioned image]](/html/1312.1002/assets/x47.png)
![[Uncaptioned image]](/html/1312.1002/assets/x48.png)
![[Uncaptioned image]](/html/1312.1002/assets/x49.png)
![[Uncaptioned image]](/html/1312.1002/assets/x50.png)
![[Uncaptioned image]](/html/1312.1002/assets/x51.png)
![[Uncaptioned image]](/html/1312.1002/assets/x52.png)
![[Uncaptioned image]](/html/1312.1002/assets/x53.png)
![[Uncaptioned image]](/html/1312.1002/assets/x54.png)
![[Uncaptioned image]](/html/1312.1002/assets/x55.png)
![[Uncaptioned image]](/html/1312.1002/assets/x56.png)
![[Uncaptioned image]](/html/1312.1002/assets/x57.png)
![[Uncaptioned image]](/html/1312.1002/assets/x58.png)
![[Uncaptioned image]](/html/1312.1002/assets/x59.png)
![[Uncaptioned image]](/html/1312.1002/assets/x60.png)
![[Uncaptioned image]](/html/1312.1002/assets/x61.png)
![[Uncaptioned image]](/html/1312.1002/assets/x62.png)
![[Uncaptioned image]](/html/1312.1002/assets/x63.png)
![[Uncaptioned image]](/html/1312.1002/assets/x64.png)
![[Uncaptioned image]](/html/1312.1002/assets/x65.png)