Three-dimensional phase-field study of crack-seal microstructures - Insights from innovative post-processing techniques
Abstract
Numerical simulations of vein evolution contribute to a better understanding of processes involved in their formation and possess the potential to provide invaluable insights into the rock deformation history and fluid flow pathways. The primary aim of the present article is to investigate the influence of a ‘realistic’ boundary condition, i.e. an algorithmically generated ‘fractal’ surface, on the vein evolution in 3-D using a thermodynamically consistent approach, while explaining the benefits of accounting for an extra dimensionality. The 3-D simulation results are supplemented by innovative numerical post-processing and advanced visualization techniques. The new methodologies to measure the tracking efficiency demonstrate the importance of accounting the temporal evolution; no such information is usually accessible in field studies and notoriously difficult to obtain from laboratory experiments as well. The grain growth statistics obtained by numerically post-processing the 3-D computational microstructures explain the pinning mechanism which leads to arrest of grain boundaries/multi-junctions by crack peaks, thereby, enhancing the tracking behavior.
1 Introduction
Correct interpretation of vein microstructure demands careful study of thin sections and appropriate bridging of results obtained from different length scales. The field based studies as well as laboratory experiments are the two different means by which geologists try to establish structure-property co-relationship. Unless one performs arduous in-situ laboratory experiments, the time-based evolution information stays inaccessible. Moreover, it is difficult to decompose the effect of different processes that might have acted in sequence or simultaneously. Piazolo et al., (2010) summarize the limitations of field based studies and laboratory experiments while highlighting the general capability of numerical simulations to serve as a viable alternative.
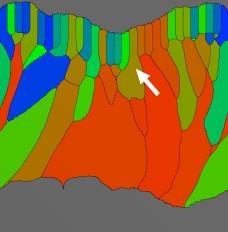
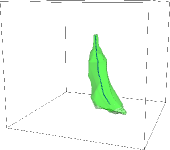
The need for numerical simulations to study microstructural evolution in veins has lead to development of computer programs, based on front-tracking approaches, like Vein Growth (Bons,, 2001) and FACET (Zhang and Adams,, 2002) in the past and more recently, Elle (Jessell et al.,, 2001; Bons et al.,, 2008). A major limitation of such front-tracking methods is that numerical studies require huge effort to be extended to 3-D. The idea of comparing the 2-D numerical results with thin sections of 3-D natural samples is far-fetched, primarily because of an added degree of freedom for the evolving crystals (in 3-D) which leads to erroneous interpretation. While Bons, (2001) provide hints concerning deviations when thin sections are directly compared with 2-D simulation results, the actual differences remain unclear due to lack of any 3-D numerical results. It is noteworthy, that a complete understanding of the vein growth mechanism cannot be achieved by merely studying thin sections as it reveals only a part of the whole story. The partial story could often be misleading, since what looks to be a crystal not tracking the crack-opening trajectory in 2-D microstructure may turn out to be exactly opposite when studied in 3-D. In the context of vein growth, we emphasize that the grain formation process is generically of 3-D nature and can be interpreted in a physically sufficient manner by methods capable of capturing the growth characteristics and dynamics in full 3-D space. The phase-field simulation example shown in figure 1 bear testimony to our assertion.

The last two decades have seen the emergence of phase-field method as a versatile and popular tool for numerical simulations of crystal growth and in general, for a variety of other moving boundary problems; prominent application areas being solidification, solid-state phase transformations like spinodal decomposition and crack propagation. The most significant computational advantage of a phase-field model is that explicit tracking of the interface is unnecessary. In simpler words, in a phase-field simulation, freely moving interfaces between different phases or crystals (grain orientations) do not appear as geometric boundaries, i.e. places at which boundary conditions have to be applied explicitly. Instead, all the information about the location of the phase boundaries is implicitly contained in the phase-field variable, which obeys a partial differential equation and solved within the entire computational domain. Different thermodynamic driving forces for topological changes, such as chemical bulk free energy, interfacial energy, elastic strain energy and different transport processes, such as mass diffusion and advection, can be coupled, thereby facilitating the comprehensive studies of the transformation phenomena.
Hubert et al., (2009) discuss the limitations of Vein Growth and FACET (geometric restrictions and extension to 3-D) and introduce a phase-field model to study crystal growth in veins, which uses a non-faceted anisotropy for the interfacial energy. However, it is well known from literature (Taylor and Cahn,, 1998) that smooth continuous functions cannot be used to simulate crystals with flat facets and sharp corners. Ankit et al., 2013b show the importance of adopting a general thermodynamically consistent approach in modeling the evolution of vein microstructures by considering faceted-type anisotropy formulations of the interfacial energy function to simulate crystals with flat facets and sharp corners. Various boundary conditions and parameters which influence the crystal growth mechanism in veins, especially the grain boundary tracking behavior, can be successfully investigated using the phase-field method. Further, the reproducibility of previous simulation results (from front-tracking models) as well as chief advantages of adopting the novel multiphase-field model, such as 3-D numerical studies for crystal of any shape, large-scale simulations with many thousand grains and provision to implement transport, is highlighted.
In the current article, we advance the 3-D numerical study of Ankit et al., 2013b to study the influence of a realistic representation of the crack wall by a boundary condition of fractal shape, on crystal growth in crack-sealing veins. By employing advanced visualization and innovative post-processing techniques, new methodologies to calculate ’general tracking efficiency’ for a more complex motion of grain boundaries is proposed. The present work highlights the importance of accounting the time evolution rather than calculating tracking efficiency solely based on final grain boundary morphology. Further, grain statistics such as temporal evolution of the number of tracking veins and the corresponding orientation and size distribution is obtained from the present large scale 3-D phase-field simulations with an aim to relate the shift in growth mechanism as a function of crack-opening rate, which is missing in previous numerical studies.
2 Methods
2.1 Phase-field model
The foundation of multiphase-field method utilized to address crystal growth problem is realized by a Helmholtz free energy functional formulated as
| (1) |
where is the bulk free energy density, is the small length scale parameter related to the interface width, is the gradient type and , a potential type energy density. The phase-field parameter describes the location of ‘N’ crystals with different orientation in space and time. The evolution equations for the phase-field vector components are described by variational derivative of the free energy functional which ensures energy and mass conservation as well as an increase of total entropy.
| (2) |
The symbol is the kinetic coefficient and comma separated sub-indices represent derivatives with respect to and gradient components . The lagrange multiplier guarantees the summation constraint . The multiphase-field model equations and numerical implementation have been previously discussed in detail (Nestler et al.,, 2005; Stinner et al.,, 2004). The phase-field evolution equation 2 is non-dimensionalised to ensure numerical accuracy during the computation. A brief account of the non-dimensionalisation procedure is provided by Wendler et al., (2009).
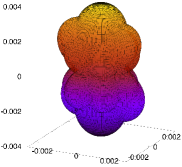
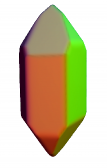
In the present work, we adopt the approach of Ankit et al., 2013b to construct the interfacial energy function for a geologically relevant mineral ‘quartz’. The polar-plot of interfacial energy and the corresponding equilibrium crystal shape is shown in figures 2 and 2 respectively. The equlibrium crystal shape represents an idealized quartz crystal consisting of , and facets. An implicit assumption of the numerical simulations of vein growth process, presented in the later sections of this article is that the smaller crystal facets ( and ) possess higher growth rate and hence, do not influence the final polycrystalline morphology. Therefore, such faster growing and smaller facets are ignored in the present numerical studies. However, it is to be noted that it is possible to simulate such facets, provided the polar-plot of interfacial energy (cusps) accounts for them. Hence, the assumption made in present work should be interpreted as shape simplification and not as a limitation of the simulation algorithm.

2.2 Numerical aspects
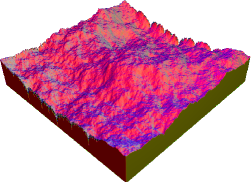
With an objective to numerically simulate the crack-sealing process and to characterize the resulting microstructure, we choose quartz crystals as a representative vein forming material. An algorithmically generated (diamond-square algorithm) fractal surface is utilized to model a three dimensional crack surface (boundary condition) for phase-field simulations as shown in figure 3.


The progressive splitting of host-rock and crystal precipitation in the open space is algorithmically replicated once by numerical pre-processing to obtain the initial condition for simulation as shown in figure 4. The preprocessing algorithm adopted is as follows:
-
•
The fractal topology of the lower crack surface is generated by a C program to implement the well-known diamond-square algorithm (Miller,, 1986). The height-map of upper crack surface is obtained by subtracting the respective heights (for lower crack-surface) from the total height of the parent rock in consideration.The two complementary fractal surfaces are stationed over each other with a minor clearance which represents the fracture in host rock.
-
•
The space between the upper and lower surface is increased (by 5 grid points in the splitting direction) which represents the first crack-opening event.
-
•
Crystals of equal size with different orientation in space are initially laid on the lower crack surface. At this point, it is important to note that the size of the crystal nuclei needs to be equal in order to negate the advent of size-effects in the following vein growth simulations. The numerical pre-processing technique in order to rule out any such possibilities involves the following sub-steps: Cuboid crystal nuclei (different colors represent an axial tilt defined in the previous section) are generated separately and merged with the parent numerical domain containing the cleft (a boundary condition) such that the former can be over-written. The resulting domain can be described as a perfectly sealed microstructure.
-
•
The lower crack surface is shifted downwards again to create a small space between the wall and crystal front. Thus, we obtain the initial numerical domain to start the phase-field simulations.

We simulate the unitaxial opening and sealing of cracks to investigate the formation of 3-D crack-sealing microstructure using the initial condition generated in figure 4, and thereby, characterize the tracking behavior of grain boundaries and multi-junctions. The following discussion will focus on the two 3-D simulation test cases with the same initial condition but different crack-opening rate, as described in table 1.
| Simulation | Time between successive | Opening increment in | Trajectory |
|---|---|---|---|
| opening | vertical direction | ||
| A | 2 | 3 | Quarter arc |
| B | 2 | 8 | Quarter arc |
The phase-field evolution equation 2 is solved numerically using an explicit forward Euler scheme. The spatial derivatives of the right hand side equation are discretized using a second order accurate scheme with a combination of forward and backward finite differences. The implementation of a locally reduced order parameter optimization employs a dynamic listing of a limited number of locally existing grains and enable to reduce computation time so that large scale simulations in 3-D become feasible. The phase-field simulations are performed on Linux high-performance computation clusters using a C program with parallel algorithms for domain decomposition to distribute the computing task on different nodes.
As a result of wall rock opening along the predetermined opening trajectory, the crack-aperture increases during simulation run-time. This adversely affects the computational efficiency as the size of simulation domain increases in the splitting direction. In order to avoid such complications, the simulation is carried out in a moving frame (also known as shifting-box simulation). In the present simulations, the domain is shifted in the growth direction (downwards) by adding a row of grid-point at the top of domain and discarding off a row of grid-points at the bottom, every time the advancing crystal growth front fills up 10% of the simulation box. The final domain is obtained by aggregating back the discarded rows of pixels as described by Ankit et al., 2013a for a different material system. Further, we ensure that the advancing crystal-rock interface always stay within the boundaries of shifting-box for every simulation time-step.
3 Simulation results
3.1 Calculation of tracking efficiency
The term ’tracking efficiency’ which was first introduced by Urai et al., (1991) is frequently used to quantify the tracking behavior of crack sealing microstructures. Ankit et al., 2013b amend this definition to a ’general tracking efficiency’ (GTE) based on a fitting procedure for linear crack opening trajectory. It is to be noted that both the above definitions of grain boundary tracking efficiency are based on the final microstructure morphology and do not account for the temporal evolution of grain boundary tracking behavior. The dynamics of tracking efficiency is particularly important when the wall roughness of the advancing crack surface is not sufficiently high and the opening trajectory is non-linear. For such cases, general tracking efficiency is numerically obtained by fitting a straight lines in infinitesimally small time interval in which both the crack opening as well as grain boundary morphology can be assumed to be linear. In the following section, we highlight the advantage of calculating tracking efficiency by accounting for time evolution of grain barycenter. We calculate the tracking efficiency of the 3-D computational microstructure by two different methods:
-
1.
The iso-surface of surviving crystals which are in contact with the advancing wall rock is visualized and the local peaks (10 nearest neighbors approximation) of the facing fractal surface are plotted. The peaks of the fractal surface lying along the grain boundaries/multi-junctions are extracted from the computational microstructure of the simulations A and B and are then superimposed, as shown in figures 5 and 5, respectively. The total number of the grain boundary/multi-junction tracking peaks are designated as . Similarly, those fractal peaks which neither lie along grain boundaries nor at multi-junctions are plotted in figures 5 and 5. The total number of such non-tracking peaks is denoted by . The general tracking efficiency (GTE) for the 3-D crack-seal microstructure is defined for the simulation time-step as:
(3) The definition of GTE is extended to account for the overall temporal evolution of tracking efficiency as:
(4) where , and represent time-step width, number of time-steps and total simulation time respectively.


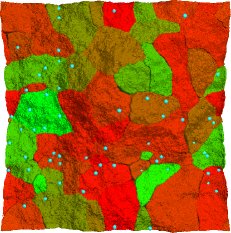
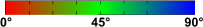
Figure 5: Local peaks of crack surface (represented as colored spheres) plotted over the rock-crystal growth interface for simulation A in (a) and (b) and for simulation B as shown in (c) and (d). The fractal peaks tracking the grain boundaries/triple/quadruple junctions are plotted as off-white spheres in (a) and (c). The fractal peaks not tracked by grain boundaries/multi-junctions are plotted as light-blue spheres in (b) and (d). On the basis of the final microstructures, the values of GTE (‘’ being total time) for simulation A and B are 0.685 and 0.325 respectively. On accounting for temporal evolution, the corresponding values depreciate to 0.491 and 0.206. The grain colors refer to the axial tilt indexed in the color-bar. -
2.
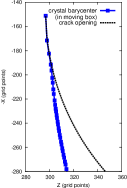
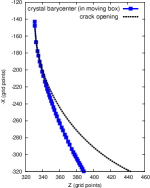
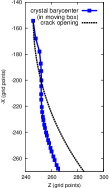
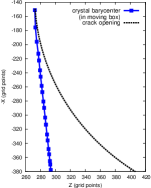
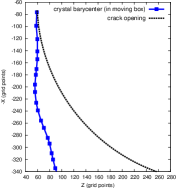
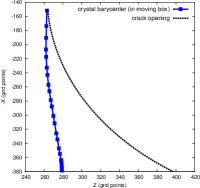
The second definition of grain boundary tracking efficiency takes into account the temporal evolution of barycenter of the surviving crystals in the shifting box, as described in the previous section. The actual positions of the surviving crystal barycenters are obtained by adding the co-ordinates of the barycenters in the shifting box with the total shift of the simulation box as shown in figure 6 for three tracking veins. For calculating the general tracking efficiency, the expression proposed by Ankit et al., 2013b is redefined for a small time interval and averaged over the total simulation time, according to
(5) If is small, we rewrite the equation to
(6)
| Simulation A | Simulation B | ||||||||
|---|---|---|---|---|---|---|---|---|---|
| Axial tilt | GTE2 | GTE1 | GTE | GTE | Axial tilt | GTE2 | GTE1 | GTE | GTE |
|
|
|
|
|
||||||
The values of GTE1 and GTE2 are calculated for the two simulations A and B. The resulting values for GTE1 and GTE2 are listed in table 2 and it can be seen that the associated temporal evolutions compare well. On the contrary, GTE and GTE derived from final microstructures, i.e. last simulation time-step differ significantly from GTE1 and GTE2 and show larger deviations with respect to each other. Additionally, the estimated GTE2 vary with axial tilt and therefore, may lead to erroneous interpretation.
3.2 Statistics
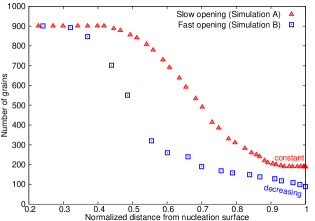
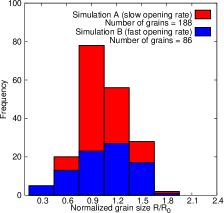
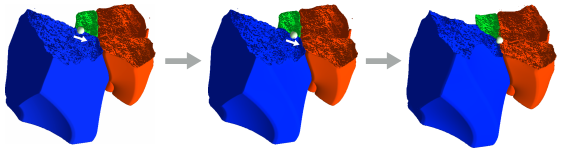
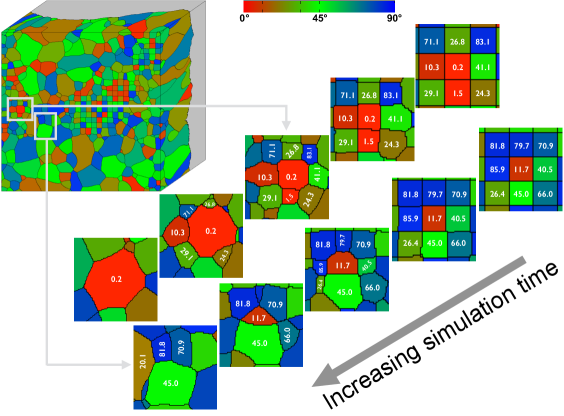
It is well known from the 2-D numerical studies of crack-sealing process that a smaller crack-opening rate favors the formation of fibrous morphology, while, a larger crack opening rate leads to formation of blocky veins (Ankit et al., 2013b, ; Hilgers et al.,, 2001). However, none of the previous studies focuses on the statistical aspects which have the potential to provide valuable insights into the vein growth process. We plot the number of grains surviving the crack opening process (in contact with the advancing crack surface) versus the time dependent crack opening distance and observe a shift between the two regimes, in the present 3-D simulations. As shown in figure 7, the decline in the number of grains is significantly steeper for faster crack opening (simulation B), as compared to the case of slow opening (simulation A). The plummeting of grain count is indicative of the anisotropy in surface energy being dominant, leading to orientation selection and growth competition, similar to free-growth conditions. In such a case, the mis-oriented grains are continuously eliminated by favorably oriented neighbors. On the contrary, when the crack-opening rate is smaller, the decrease in the number of grains is less steep and becomes constant, which indicates that grain boundaries are pinned by fractal peaks, even though the general tracking efficiency is near about 0.5 (much lesser than 1.0). The grain size distribution in the shifting box (final simulation time-step) is plotted in figure 7 and represents those grains in contact with the advancing crack surface for the test cases A and B. On comparison, it becomes clear that the tip of the distribution shifts towards smaller mean grain sizes due to an increased pinning behavior of fractal peaks when the crack-opening rate is smaller. It is noteworthy that a major repercussion of grain-boundary/multi-junction pinning as shown in figure 8 is that the growth competition based on mis-orientation is suppressed. In such cases, the consumption or survival of a grain does not depend on mis-orientation as shown in figure 9. Therefore, a higher number of grains survive the crack-sealing process as opposed to other case when crack-opening rate is faster in evidence with the result in figure 7.

4 Discussion of results
The present work highlights the advantage of 3-D numerical studies over 2-D, by visualizing the complex and the inherently three-dimensional motion of grain boundaries/multi-junctions in crack-sealing process. In order to account for the temporal evolution of veins, two different approaches to determine the general tracking efficiencies are proposed and compared. We clarify the main reason for the effect of the crack opening rate on the grain growth statistics, i.e. on the number of grains tracking the opening trajectory, size and orientation distribution.
For implementing a ‘realistic’ 3-D fractal surface as the boundary condition and obtaining a uniform overlay of nuclei over the crack surface which prevents the onset of size-effects, preprocessing algorithms are proposed. An innovative approach to visualize the numerically simulated veins aided by post-processing techniques reveals that the grain boundary/multi-junction morphologies in 3-D are more complicated as compared to 2-D cases, in general. In order to deal with the third dimensionality which makes the determination of tracking efficiency difficult, we amend the definition of general tracking efficiency to GTE1 and GTE2 given by equations 4 and 6 respectively. While GTE1 may be interpreted as an extension of the tracking efficiency proposed by Urai et al., (1991) for the case of 3-D evolution, GTE2 accounts for the temporal change in tracking behavior of veins with respect to the crack-opening trajectory. In contrast, GTE describes the tracking efficiency of the final microstructure (‘t’ being the total simulation time) and does not account for temporal evolution. The study of peak trajectories demonstrates that GTE is significantly higher than the GTE1 for the simulation test cases, A and B. It is noteworthy that GTE1 and GTE2, both accounting for the temporal evolution of grain boundaries/multi-junctions, compare quite well as summarized in table 2. The incongruousness arising out of the neglect of temporal evolution of grain boundaries/multi-junctions implies that conclusions about the tracking efficiency, as previously drawn upon the GTE data, which solely rely on final microstructure have a clearly limited validity. While the original approach of using grain boundary morphology to determine tracking efficiency proves to be inept in 3-D, we conclude that the proposed GTEs, both accounting the temporal evolution, serve as reliable methods to quantify the tracking behavior in veins.
The grain evolution statistics obtained by post-processing the 3-D computational microstructure reveals that the number of grains in contact with advancing crack surface (figure 7) decreases steeply when the crack-opening rate is higher. It can be argued that a steep decline in the number of grains and survival of crystals oriented along the most preferred orientation, is indicative of growth competition which does not relate to the boundary conditions namely the crack surface roughness or the opening rate. The near incapability of fractal peaks to pin the grain boundaries/multi-junctions when crack-opening rate is higher can be seen in figure 5 and 5, where reddish grains are found in majority. On the contrary, the decline in the number of grains is less steep for smaller crack opening rate, which finally becomes constant. Such a conclusion on statistics can be attributed to stronger pinning of fractal peaks at grain boundaries and multi-junctions, which suppresses the growth competition based on mis-orientation of neighboring grains (figure 9). An interesting outcome of visualizing the temporal evolution in figure 8, is that the fractal peaks pin more strongly at quadruple junctions (grain multi-junctions in general) as compared to grain boundaries. The increase in pinning behavior of fractal peaks at smaller crack-opening rates is further accentuated by shift in the apex of grain size distribution towards small grain size (figure 7). Thus, the plots of number of surviving grains as well as grain size distribution in figure 7 provide a statistical realization of the shift in regime and explain the vein characteristics observed in figure 9, which is primarily governed by crack-opening velocity in the present test cases.
Finally, it is worth clarifying that the present definitions of GTEs are formulated with an intention to indicate the importance of temporal evolution in determining the tracking efficiency. We do not rule out the possibility of other definitions, which may be equally capable to quantify tracking behavior in 3-D with high precision. Within the scope of current work, the prime motive is to highlight the gain in accuracy by accounting for temporal evolution in the well known methodologies, which strongly emphasizes the importance of 3-D numerical studies. The growth statistics, obtained by accounting for large number of grains and supplemented by 3-D visualization, aims to bridge the gap between field observations (of 3-D layers) and computational studies (limited to 2-D till date) and advances the understanding of the vein growth process.
5 Conclusion and outlook
The current work which is based on a thermodynamically consistent approach, namely the phase-field method aims to fill-in the short-comings while focusing on the aspects that have not been addressed in the previous numerical studies, chiefly the large-scale statistical studies as well as complex motion of grain boundaries/multi-junctions in 3-D. Wherever adequate, the benefits of 3-D simulations have been highlighted while enumerating the limitations of 2-D studies. The 3-D visualization aided by post-processing techniques supplement the present numerical studies and allow to draw meaningful conclusions from the simulation test cases. The most outstanding achievement of the present work is the characterization of vein microstructure based on temporal evolution of grain boundaries/multi-junctions rather than relying on an approximate reconstruction from the final morphology, a popular approach in the geo-scientific community (Passchier and Trouw,, 1996). Bearing in mind that it is fundamentally (essentially) difficult to design as well as carry out in-situ studies in laboratory experiments which can replicate the process of vein evolution, the 3-D numerical studies are of paramount importance as they can alternatively provide invaluable insights into the vein growth process. We further stress that the new methodologies based on multiphase-field modeling allow an efficient use of modern high super-computing power, so that even the consideration of large grain systems (up to 500,000 grains) in 3-D computational studies becomes feasible.
References
- (1) Ankit, K., Choudhury, A., Qin, C., Schulz, S., McDaniel, M., and Nestler, B. (2013a). Theoretical and numerical study of lamellar eutectoid growth influenced by volume diffusion. Acta Materialia, 61(11):4245–4253.
- (2) Ankit, K., Nestler, B., Selzer, M., and Reichardt, M. (2013b). Phase-field study of grain boundary tracking behavior in crack-seal microstructures. Contributions to Mineralogy and Petrology, 166(6):1709 – 1723.
- Bons, (2001) Bons, P. (2001). Development of crystal morphology during unitaxial growth in a progressively widening vein: I. the numerical model. Journal of Structural Geology, 23(6–7):865 – 872.
- Bons et al., (2008) Bons, P., Koehn, D., and Jessell, M. (2008). Microdynamics Simulation, volume 106 of Lecture Notes in Earth Sciences. Springer Berlin Heidelberg.
- Hilgers et al., (2001) Hilgers, C., Koehn, D., Bons, P., and Urai, J. (2001). Development of crystal morphology during unitaxial growth in a progressively widening vein: Ii. numerical simulations of the evolution of antitaxial fibrous veins. Journal of Structural Geology, 23(6–7):873 – 885.
- Hubert et al., (2009) Hubert, J., Emmerich, H., and Urai, J. (2009). Modelling the evolution of vein microstructure with phase-field techniques – a first look. Journal of Metamorphic Geology, 27(7):523–530.
- Jessell et al., (2001) Jessell, M., Bons, P., Evans, L., Barr, T., and Stüwe, K. (2001). Elle: The numerical simulation of metamorphic and deformation microstructures. Computers and Geosciences, 27(1):17–30.
- Miller, (1986) Miller, G. S. (1986). Definition and rendering of terrain maps. Computer Graphics (ACM), 20(4):39–48.
- Nestler et al., (2005) Nestler, B., Garcke, H., and Stinner, B. (2005). Multicomponent alloy solidification: Phase-field modeling and simulations. Phys. Rev. E, 71:041609.
- Passchier and Trouw, (1996) Passchier, C. and Trouw, R. (1996). Microtectonics. Springer-Verlag Berlin Heidelberg, second edition.
- Piazolo et al., (2010) Piazolo, S., Jessell, M., Bons, P., Evans, L., and Becker, J. (2010). Numerical simulations of microstructures using the elle platform: A modern research and teaching tool. Journal of the Geological Society of India, 75(1):110–127.
- Stinner et al., (2004) Stinner, B., Nestler, B., and Garcke, H. (2004). A diffuse interface model for alloys with multiple components and phases. SIAM Journal on Applied Mathematics, 64(3):775–799.
- Taylor and Cahn, (1998) Taylor, J. E. and Cahn, J. W. (1998). Diffuse interfaces with sharp corners and facets: Phase field models with strongly anisotropic surfaces. Physica D: Nonlinear Phenomena, 112(3–4):381 – 411.
- Urai et al., (1991) Urai, J., Williams, P., and van Roermund, H. (1991). Kinematics of crystal growth in syntectonic fibrous veins. Journal of Structural Geology, 13(7):823 – 836.
- Wendler et al., (2009) Wendler, F., Becker, J., Nestler, B., Bons, P., and Walte, N. (2009). Phase-field simulations of partial melts in geological materials. Computers and Geosciences, 35(9):1907 – 1916.
- Zhang and Adams, (2002) Zhang, J. and Adams, J. B. (2002). Facet: a novel model of simulation and visualization of polycrystalline thin film growth. Modelling and Simulation in Materials Science and Engineering, 10(4):381.