An analysis of the interaction between influenza and respiratory
syncytial virus based on acute respiratory infection records
Yendry N. Arguedas-Flatts1, Marcos A. Capistrán1,∗, J. Andres Christen2, Daniel E Noyola3
1 Matemáticas Básicas, Centro de Investigación en Matemáticas A.C., Guanajuato, Gto, México
2 Probabilidad y Estadística, Centro de Investigación en Matemáticas A.C., Guanajuato, Gto, México
3 Departamento de Microbiología, Facultad de Medicina, Universidad Autónoma de San Luis Potosí, San Luis Potosí, SLP, México
E-mail: Corresponding marcos@cimat.mx
Abstract
Under the hypothesis that both influenza and respiratory syncytial virus (RSV) are the two leading causes of acute respiratory infections (ARI), in this paper we have used a standard two-pathogen epidemic model as a regressor to explain, on a yearly basis, high season ARI data in terms of the contact rates and initial conditions of the mathematical model. The rationale is that ARI high season is a transient regime of a noisy system, e.g., the system is driven away from equilibrium every year by fluctuations in variables such as humidity, temperature, viral mutations and human behavior. Using the value of the replacement number as a phenotypic trait associated to fitness, we provide evidence that influenza and RSV coexists throughout the ARI high season through superinfection.
Introduction
It is known that influenza and respiratory syncytial virus (RSV) are the two leading causes of acute respiratory infections (ARI) [grondahl1999rapid, fleming2005respiratory], their interaction however is complex and numerous research efforts have been conducted towards elucidating the underlying ecological and epidemic mechanisms of ARI [dietz1979epidemiologic, huang2005dynamical], and the causes of seasonality in ARI [denny1987acute, eccles2002explanation]. It has long been argued that there is viral interference between influenza and respiratory syncytial virus [anestad1982interference, rohani1998population, linde2009does, anestad2009interference]. More broadly, interference of viral replication among viruses has been suggested for many years by epidemiological, clinical and laboratory studies [anestad1982interference, aanestad1987surveillance, wagner1963cellular, dianzani1975viral, cowling2012increased, seppala2011viral, ge2012evaluating]. Reduced susceptibility to a second viral infection during convalescence has been described. In addition to a reduction in exposure as a result of a decrease in social contacts while a person is sick and during convalescence [rohani2003ecological], mediators with antiviral activity (such as interferon) are produced by cells of the infected host; these render the individual less susceptible to secondary viral infections. In vitro studies have shown that interferon production reduces the ability of viruses to infect cells in cultures [wagner1963cellular]. Epidemiological studies have shown that peak influenza and RSV activity tends to occur at different time periods [aanestad1987surveillance, nishimura2005clinical]. On occasions widespread circulation of a virus may prevent the emergence of another virus. For instance, during the 1975-76 and 1979-80 winter seasons RSV circulation was low in Norway; it was suggested that this was the result of interference by influenza activity in the region [aanestad1987surveillance]. Also, a change in RSV epidemiology was observed during 2009 in France concurrent with circulation of the influenza A(H1N1) 2009 virus [casalegno2010impact]. Also, the theoretical study of the ecological phenomena that viral interference may give rise to (competitive exclusion, coexistence, coevolution, etc) have received considerable attention [levin1981selection, bremermann1989competitive, castillo1998relationship, feng1997competitive, hochberg1990coexistence, may1994superinfection]. On the other hand, among the possible causes of seasonality of respiratory infectious diseases are the following: during adverse climatic conditions (colder season in temperate climates; rainy season in tropical areas) people spend more time indoors, and increased aggregation leads to closer contact between susceptible and infected individuals [weber1998respiratory]; colder temperatures correspond to drier air, which dehydrates mucose membranes making people more vulnerable to infection [lowen2007influenza, shaman2009absolute]. Another feature of seasonal epidemics of respiratory infections that has attracted interest from researchers is the development of methods for early detection of epidemic outbreaks [unkel2012statistical]. Robust outbreak detection methods are mandatory in order to identify the onset of pandemic influenza. However, non-pandemic outbreaks have striking regularity in large cities, and the onset of ARI high season corresponds to approximately the first time that ARI records hit its historical mean (sometime during the last quarter of a given year in the northern hemisphere). Beyond the identification of epidemic outbreaks it is necessary, from the point of view of public health intervention, to discriminate between illnesses caused by influenza and those caused by RSV in order to define appropriate management routines [zambon2001contribution].
Aiming at contributing towards methods to study the interaction of influenza and RSV, in this paper we have used a standard two-pathogen epidemic model as a regressor to explain, on a yearly basis, high season ARI data in terms of the contact rates and initial conditions of the mathematical model. The rationale is that ARI high season is a transient regime of a noisy system, e.g., the system is driven away from equilibrium every year by fluctuations in variables such as humidity, temperature, viral mutations and human behavior. The effect of ARI caused by other pathogens is not modeled explicitly. Using the replacement number as a phenotypic trait to define fitness, we provide evidence that influenza and RSV coexists throughout the ARI high season through superinfection.
Materials and Methods
Ethics statement
This study included retrospective analyses of information available from databases (weekly number of ARI consultations and weekly number of viral detections). Weekly data for ARI consultations is recorded as part of routine surveillance activities carried out by the State Public Health Department. Virological information was derived from research projects carried out to analyze the epidemiology of viral respiratory infections and as part of the hospital’s infection control program; the research projects were approved by the Research and Ethics Committee at Hospital Central ”Dr. Ignacio Morones Prieto” and written informed consent was obtained from children’s parents.
Data
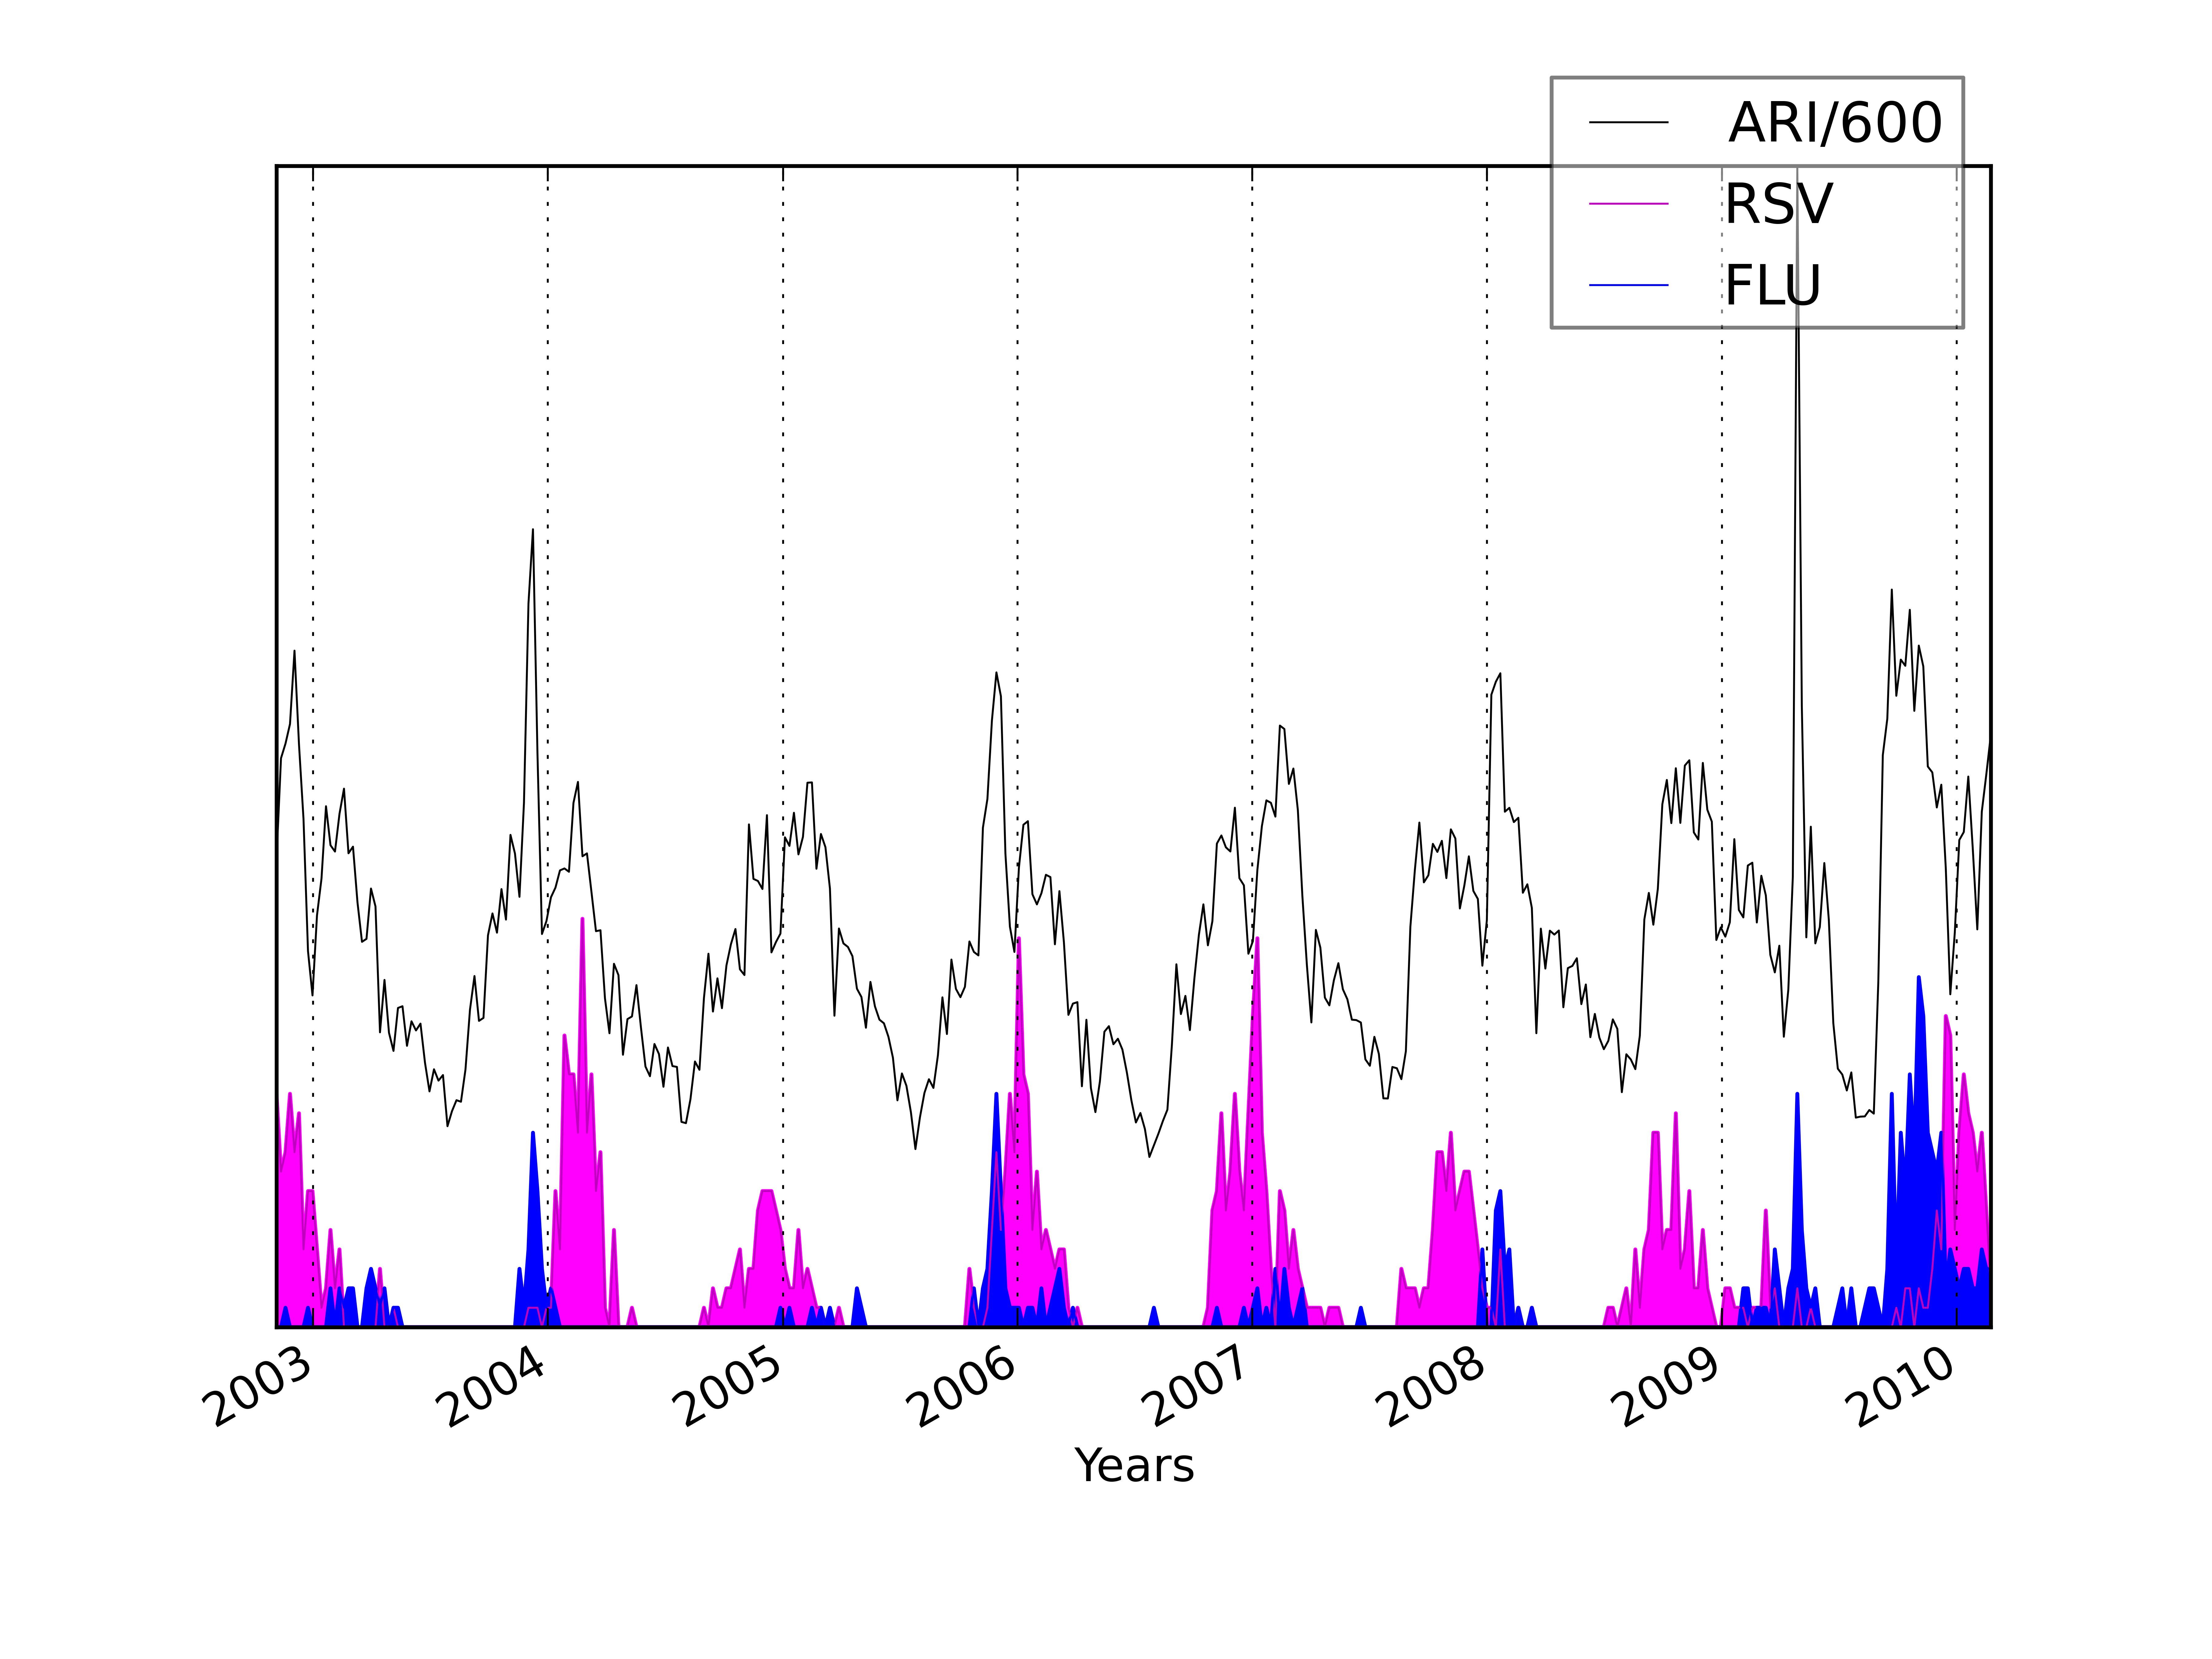
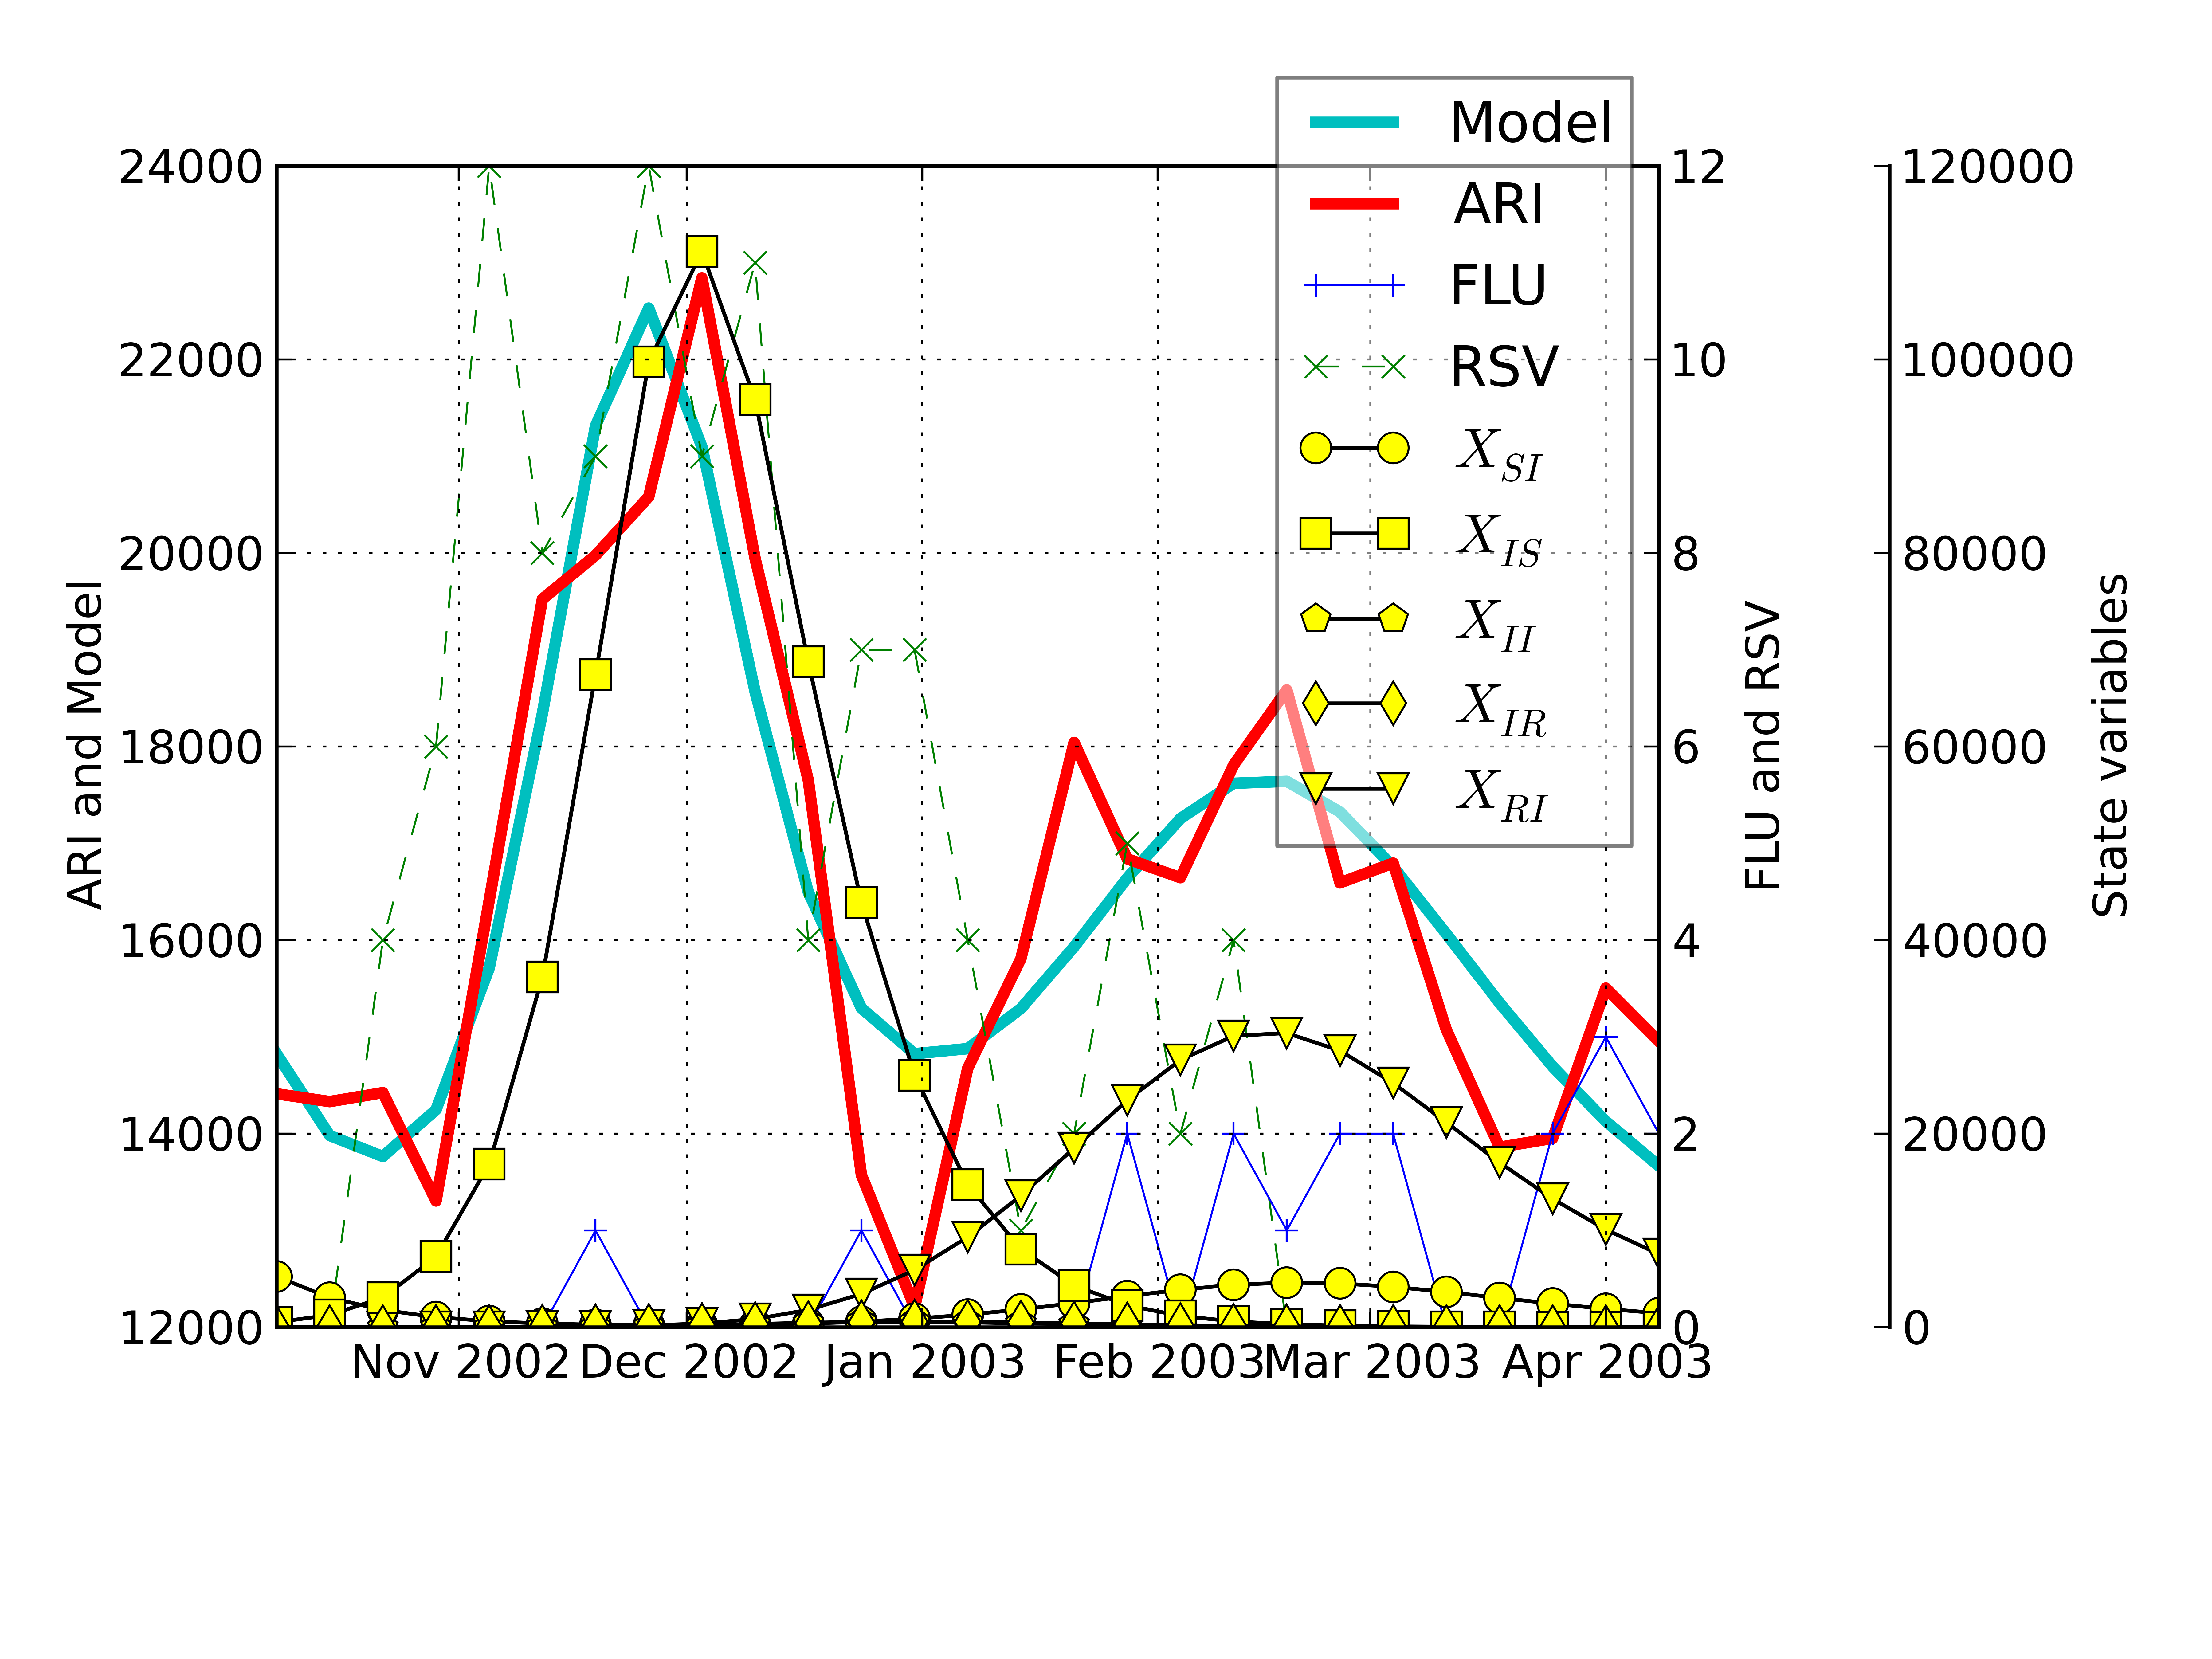
Data consists of weekly number of ARI consultations and weekly number of viral detections from the State of San Luis Potosí, Mexico ranging from 2002 to 2010. The seasonal trend of ARI and virus circulation are shown in Figure 1. Temperature and humidity data of San Luis Potosí was obtained from the National Climatic Data center http://www7.ncdc.noaa.gov/CDO/cdo.
Epidemic outbreak
There are methods to identify the onset of epidemics ranging across all subfields of statistics [unkel2012statistical]. However, non-pandemic records of ARI have a striking regularity in large cities, this is the case in the State of San Luis Potosí, which has an approximate population of 2,000,000 inhabitants. For the sake of simplicity, in this paper we examine ARI data corresponding to non-pandemic years. Consequently, we regard the historical mean of ARI as the baseline, and define ARI high season as those weeks from October-November of a given year, when data reaches its historical mean, until April-May of the following year when data drops again below its historical mean, see supplementary material.
Two-pathogen epidemic model
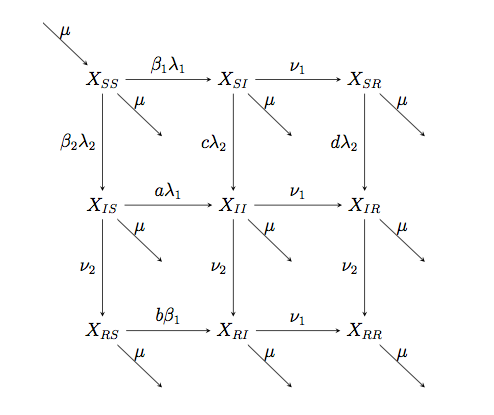
The two-pathogen SIR epidemic model considered in this paper is defined by the graph shown in Figure 2.
Model defined by Figure 2 is a history-based model of two-pathogen epidemics, and no relation is made for the time being between the indexes 1,2 and the names of the diseases. Initially, we carry out a classical qualitative analysis of the deterministic equations (1) in order to distinguish between four noteworthy ecological regimes (competitive exclusion, cocirculation, superinfection and coexistence of two pathogens in a population), which are further described below. Model (1) is the same model analyzed in [shrestha2011statistical], except that we have neglected the convalescent state. Furthermore, state variables in model (1) account for all infections, from ARI to mild or asymptomatic infections. Consequently, in subsection Inference we develop a statistical model to compare the model prediction to ARI time series data under the hypothesis that the number of ARI is proportional to the total number of infections caused by both diseases. Our aim is twofold, on the one hand we want to identify an ecological regime implicit in model (1) that best explains ARI data, on the other hand we want to estimate the contact rate of each disease in order to compute the replacement number of both diseases throughout the ARI high season.
The deterministic equations for the dynamics of the state variables are
| (1) |
where the state variable denotes the number of individuals in state for . We write and for clarity. Contact rates are given by , , , , and , while , are recovery rates. We denote both birth and death rate by . In the remainder of the paper we have taken , and fixed. The total population is .
Model Analysis
The basic reproductive number of model (1) is given by
| (2) |
where
The disease free equilibrium (DFE)
| (3) |
is locally stable if and unstable if . There are two semi-endemic equilibria, the first one (EE1) exists if and and is given by
| (4) |
Since the model is symmetric, the second semi-endemic equilibrium (EE2) exists if and and is given by
| (5) |
We remark that the region where both diseases coexist admits complex dynamics and its detailed analysis escapes the purpose of this paper. We plan to report a more complete qualitative analysis elsewhere.
-
•
If , cross immunity is perfect and equations (1) model pure competitive exclusion between two diseases.
-
•
If and , , or If and , , equations (1) model superinfection, e.g., if If and , , the model predicts that individuals with the second infection can acquire the first infection but not the other way around.
-
•
If and , equations (1) model a regime where both infections circulate in the population but no individual has both infections at once.
-
•
If , , , equations (1) model a general two-pathogen epidemic model.
The replacement number for both diseases is defined as follows
| (6) | |||
| (7) |
Since the fitness of both diseases changes considerably throughout the ARI high season, the replacement number is an appropriate phenotypical trait to analyze the relative fitness of the two diseases in the two-pathogen epidemic model (1).
Inference
It is known that symptomatic infections requiring medical attention comprise only a fraction of all infections occurring during an epidemic period. Data of infected individuals consists of counts. Consequently, we assume that the ARI weekly reports , are independent realizations of a Poisson distribution whose mean is proportional to the integral of the incidence of any new infections between two observation times and predicted by the deterministic model, i.e
| (8) |
where
are the model parameters to be inferred and are the accumulated ARI measurements. The proportionality constant accounts for the fact that the number of ARI reports is proportional to the number of individuals infected with either influenza or RSV. We substract the historical mean to ARI data prior to carrying out the inference process.
Likelihood
Assuming that the observations are independent between them, the joint distribution of the observed ARI cases is a good approximation to the conditional probability , which would simply be defined by the product of the individual probability density functions of the observations:
| (9) |
Informative priors
Since all model parameters are non-negative we propose Gamma prior distributions for them. For the parameters that account for contact rate we chose the instrumental parameters in the Gamma distribution such that its expected value corresponds to previous reports of for both influenza and respiratory syncytial virus [weber2001modeling, chowell2008seasonal], e.g.
where and are instrumental parameters such that Likewise, for the initial conditions we have set and with expected value 0.1 in both cases. For the sake of keeping a parsimonious model we have neglected the initial number of individuals in the compartments , and . This gives rise to an a posteriori distribution
| (10) |
Markov Chain Monte Carlo
We have explored the posterior distribution with the software for Markov Chain Monte Carlo t-walk by Christen and Fox [christen2010general].
Results
For the analysis and inference carried out in this paper we have used a simplified version of the two-pathogen model analyzed in [shrestha2011statistical] where it was shown, with likelihood-based inference, that the interaction of multi-patoghen systems can be inferred from noisy time series if there is enough information about the epidemiological and demographic underlying processes.
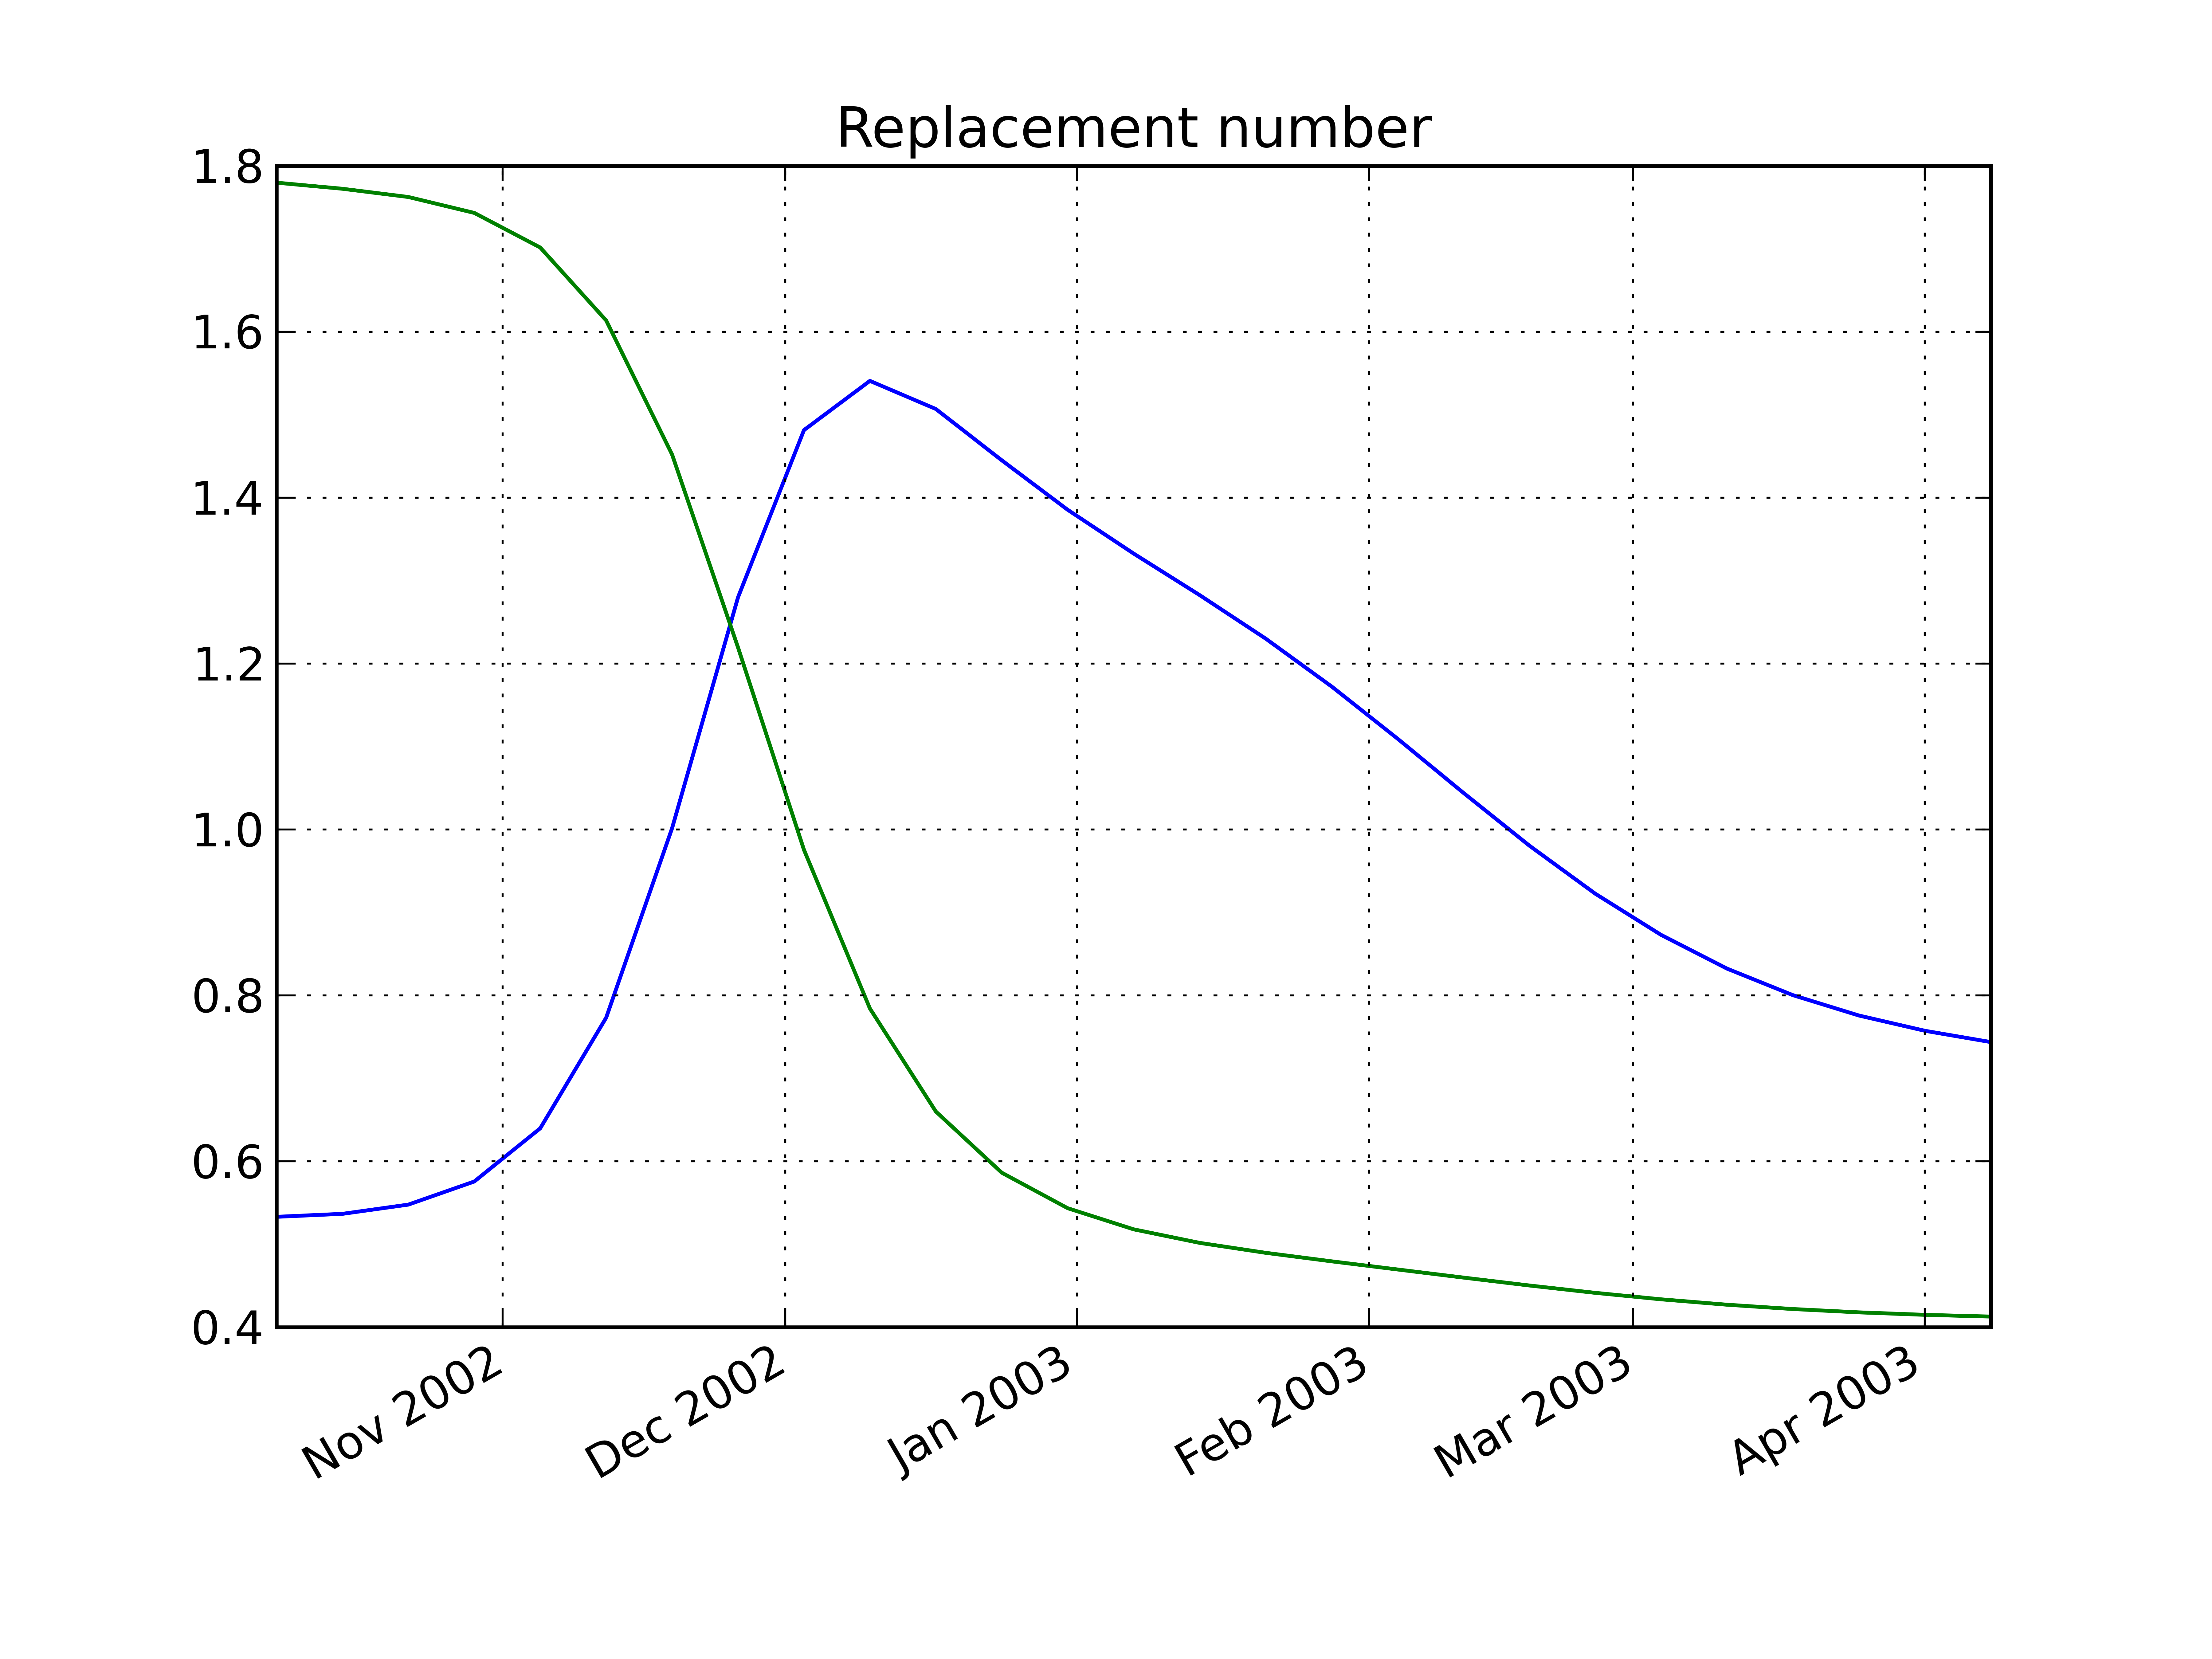
The replacement number, see Figure 3, provides a line of evidence of our findings: intially RSV has higher replacement number (fitness) and invades first. However, RSV fitness is monotonically decreasing while influenza starts with lower but monotonically increasing replacement number. Eventually influenza is the pathogen with the larger replacement number, until it also reaches a peak and starts to decline.
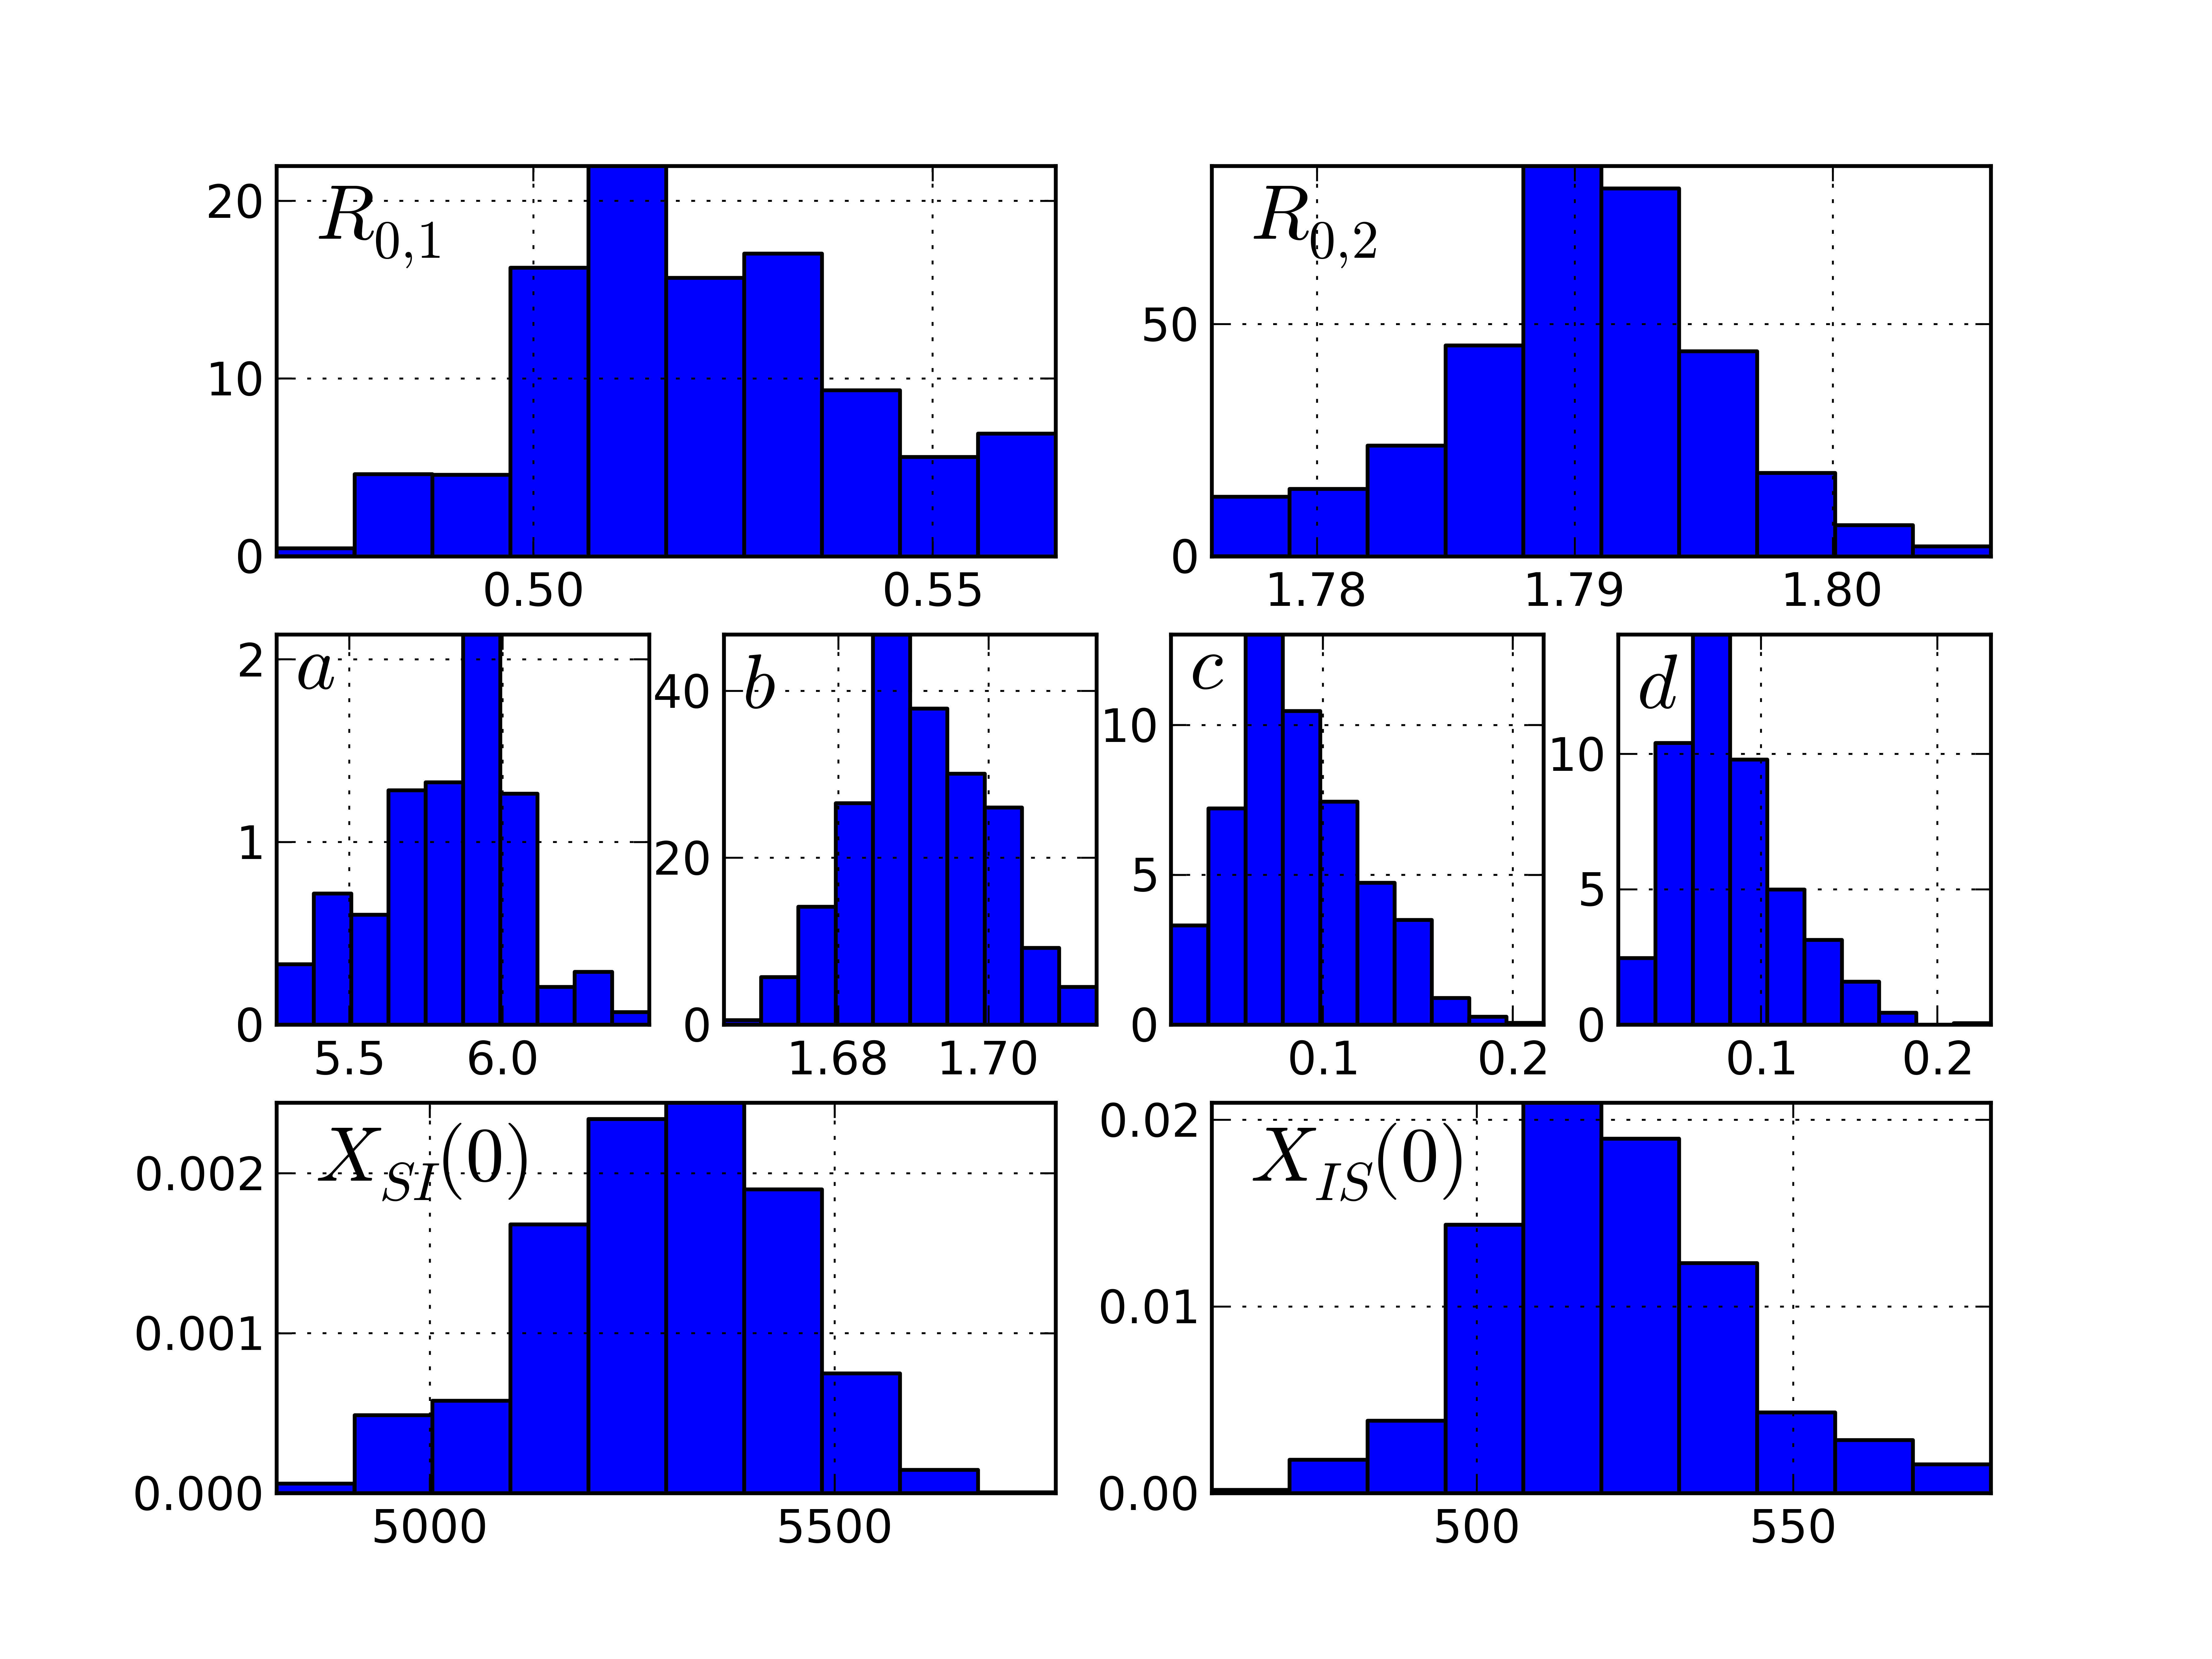
Figures 5 and 6 correspond to the 2002-2003 season, where RSV peaked first. The comparison of model (1) state variables evaluated at the maximum a posteriori estimator (MAP) of the parameters, ARI records and model incidence evaluated at the MAP of the parameters, and sentinel records of RSV and influenza are in agreement with the claims made in Figure 3. We can interpret these results in the following manner, during the first half of the ARI high season RSV has bigger fitness than influenza (), therefore peaks first. Nevertheless, both diseases are present during the ARI high season. Figure 6 shows histograms of the model parameters. The relative value of the contact rates shows that the model is in the superinfection regime.
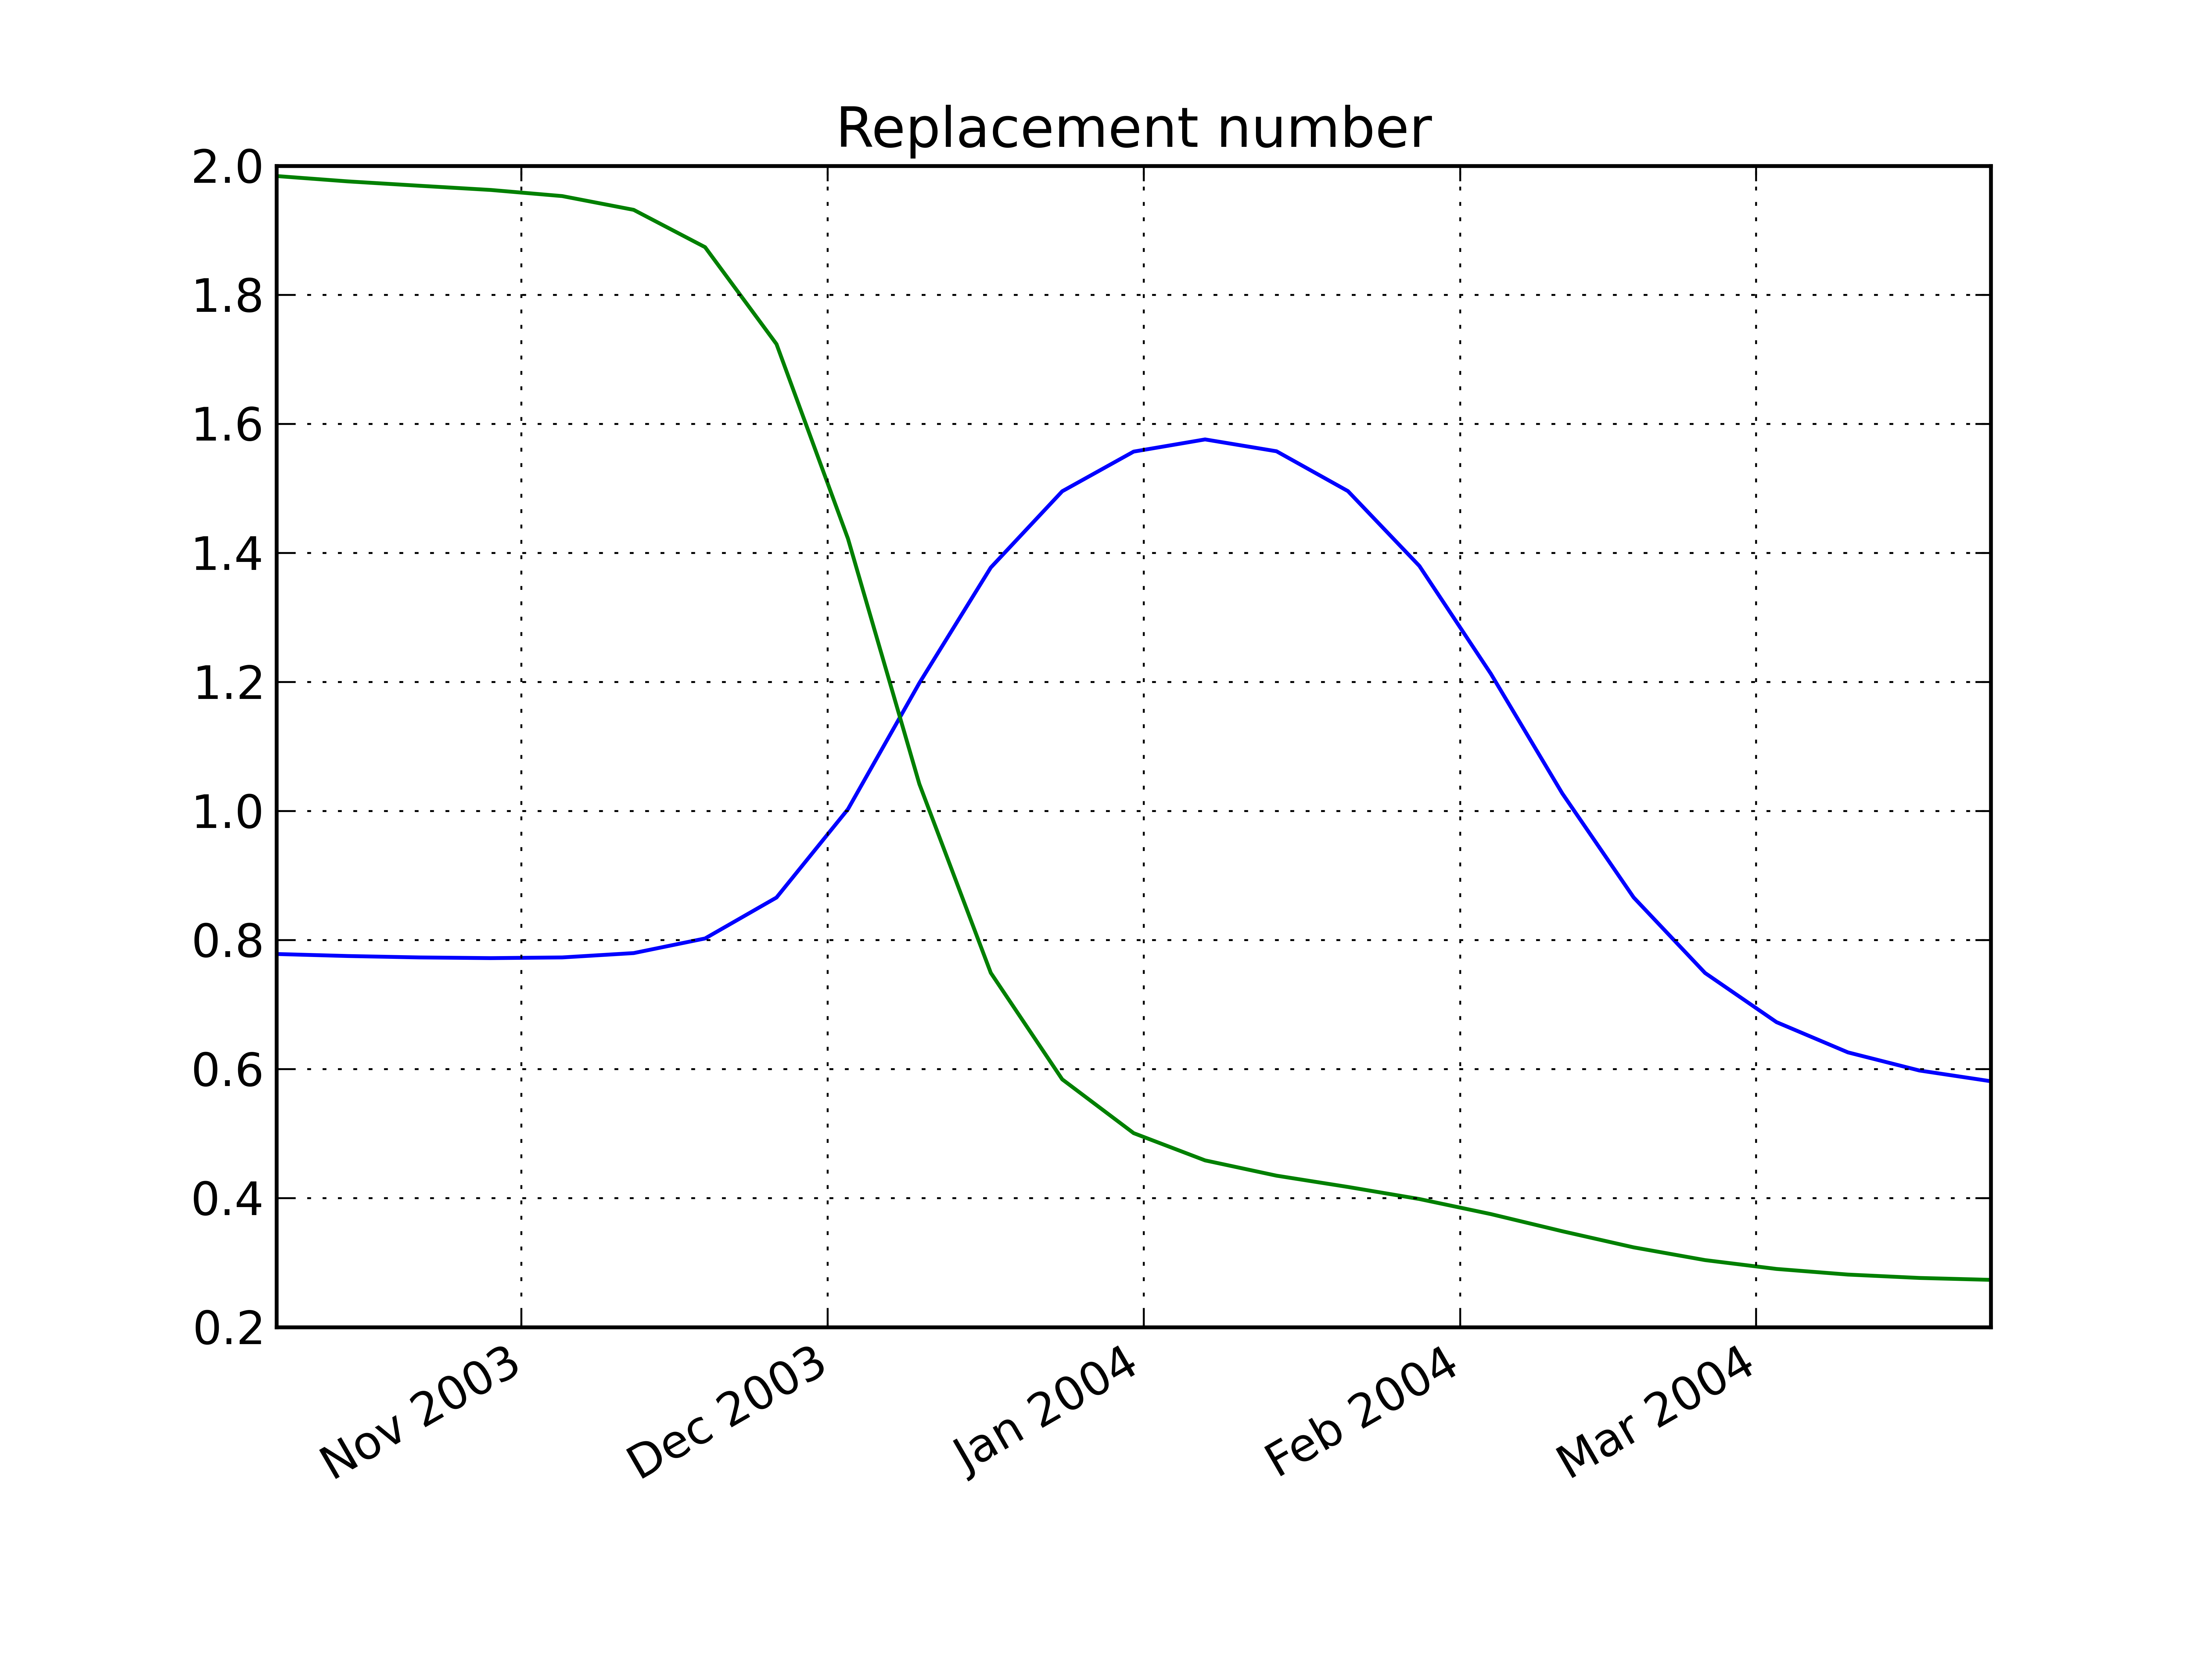
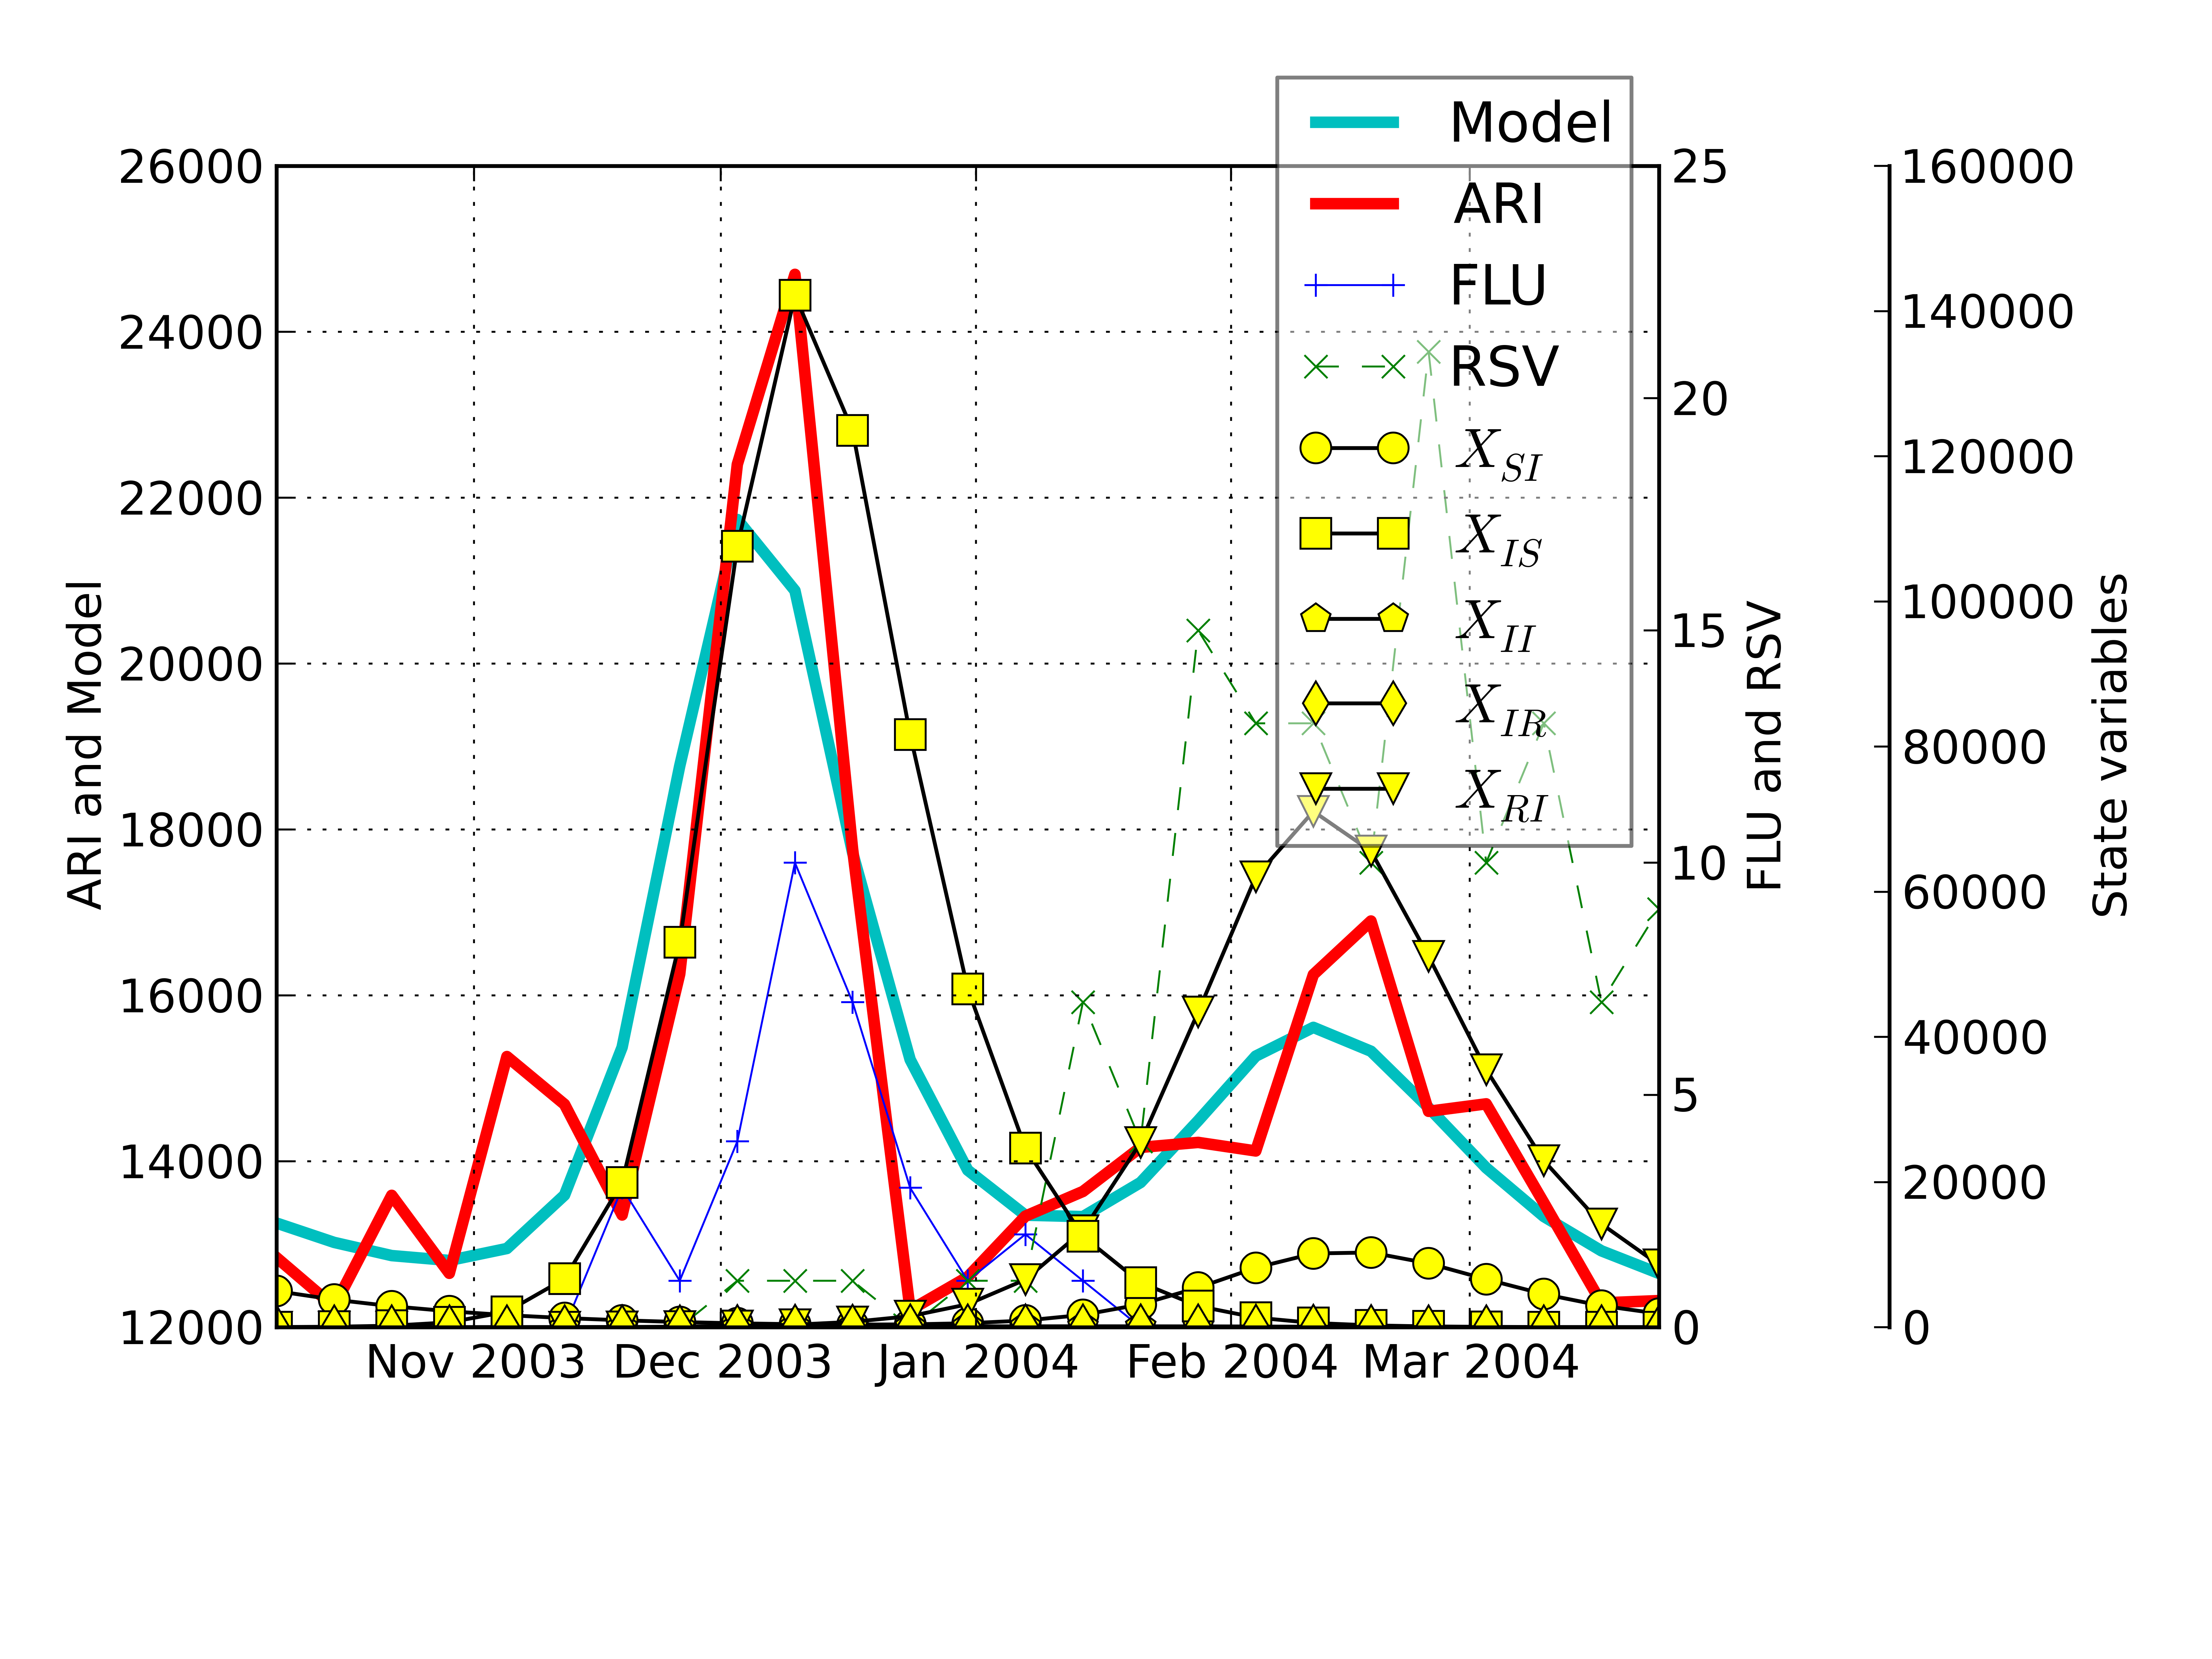
We have obtained similar results to 2002-2003 in all years where a non-pandemic influenza outbreak occurred, see supplementary material. Of note, there are years where RSV peaks first, while the other scenario is also possible (see Figure 7) where influenza peaks first through the same mechanism described above. Remarkably in the 2003-2004 season we have posterior marginal distributions with two modes. The reason is that the epidemic model is symmetric and we haven’t incorporated into our inference process the sentinel records of influenza and RSV. In all cases studied the coinfected state remains at very low level compared with the rest of the infected states. We consider low counts of , the delay in the increase in and the larger counts of compared to as three lines of evidence of viral interference. We do not have however an explanation for the fact that either, RSV or influenza have higher fitness at the beginning of the ARI season. A more throughout analysis will be reported elsewhere incorporating information related to the influenza vaccination coverage and effectiveness and weather covariates.
Discussion
Respiratory viruses are common causes of ARI; influenza and RSV epidemics are associated to increasing numbers of consultations and hospitalizations. In temperate climates there is an expected increase in ARI during the winter season. However, the onset, extent and duration of these epidemics are not always predictable. Variability in ARI epidemiology may be associated to environmental factors (such as temperature and pollution), viral factors (diverse etiological agents and strain variations), and host factors (demographic features, population susceptibility). In this work we have developed a mathematical model to analyze the interaction between two pathogens (influenza and RSV) as causes of respiratory infections and compared the results of this model to ARI time series obtained during a seven year period in the State of San Luis Potosí, as well as virological information regarding influenza and RSV circulation in this region. The model for each season showed similar results with a bimodal distribution of ARI in which the first peak is explained by infections caused by one pathogen followed by a second outbreak associated to circulation of the second pathogen. The first outbreak could be associated to either influenza or RSV; however, results for every season were similar. Thus, the observed epidemiological features do not appear to depend on the specific agent responsible for the epidemic; rather, it appears that ARI epidemiology depends of the interaction between both agents and the host population resulting in a dominant virus at the start of the peak season which declines during the second part of winter allowing for the second virus to emerge. The model shows that at the onset of the epidemic ARI season both viruses are present in the population; however, during a particular season there are certain characteristics, yet to be defined, that render one virus fitter than the other to establish a disseminated outbreak, resulting in infection of a large proportion of the population. Of note, our model aims to describe the behavior of infections within the whole population (including asymptomatic, mild, and severe infections) and, therefore, a large proportion of the population is expected to be affected by at least one of these two pathogens. In this context, symptomatic infections requiring medical attention comprise only a fraction of all infections occurring during an epidemic period. For instance, almost all children suffer at least one RSV infection during the first two years of life and reinfections are common [bocchini2009american]. Symptomatic influenza infections severe enough to require outpatient/emergency department medical attention have been estimated to occur in 5.6-12.2% of children below 5 years of age [poehling2006underrecognized]. In addition, a large proportion of infections are known to be mild (not requiring medical care) or asymptomatic. Ascertainment of asymptomatic infections is more difficult in clinical practice, since serological studies are required. Epidemiological studies have shown that during annual influenza epidemics 25-50% of the population is infected by this virus [glezen1996emerging]. The results obtained by this model correlate to the observed ARI time series which are assumed to reflect the seasonality of all infections within the community. In addition, each of the outbreaks described by the model corresponded to either influenza or RSV activity in our region. Of interest, the largest proportion of individuals affected by the second outbreak is predicted to occur in those who have previously been affected (either by symptomatic of asymptomatic infection) by the first virus that circulated in the community; on the other hand the attack rate in those that did not suffer infection by the first pathogen is predicted to be lower. These results would reflect the existence of a group of individuals that are less likely to be infected by both pathogens (either because they are resistant to infection or are less likely to be exposed) while individuals that are affected by a virus may be rendered more susceptible to sequential infection by a second pathogen. Interestingly, this mathematical model indicates the existence of significant interactions between the two pathogens (either simultaneously of sequentially). Of note, our results support the presence of interference between the two viruses leading to the occurrence of sequential outbreaks, which in ecological terms is called superinfection. Of particular interest, the similarities in seasonal trends during each winter, independent of the leading virus at the onset of peak ARI activity may allow to establish a general model that may be applied to subsequent winter seasons to aid in outbreak management and may serve to test hypothesis regarding the effectiveness of preventive strategies, such as vaccination.
Acknowledgments
We would like to thank the State Health Services of San Luis Potosí; particularly Dr. José de Jesús Mendez de Lira who provided us with records of ARI of San Luis Potosí. We would like to thank Dr. Andreu Comas García for useful discussions, feedback and insight. Also, the authors would like to acknowledge financial support from Fondo Mixto de Fomento a la Investigación Científica y Tecnológica, CONACYT-Gobierno del Estado de Guajanuato, GTO-2011-C04-168776.
Figures