Measurement of cosmic muon charge ratio with the Large Volume Detector
N.Yu. Agafonova1,∗, M. Aglietta2, P. Antonioli3, G. Bari3, R. Bertoni2, V.V. Boyarkin1, E. Bressan4,5, G. Bruno6, V.L. Dadykin1, E.A. Dobrynina1, R.I. Enikeev1, W. Fulgione2, P. Galeotti7,2, M. Garbini3, P.L. Ghia8, P. Giusti3, E. Kemp9, A.S. Malgin1, B. Miguez9,6, A. Molinario2, R. Persiani3,4, I.A. Pless10, V.G. Ryasny1, O.G. Ryazhskaya1, O. Saavedra7,2, G. Sartorelli3,4, M. Selvi3, G.C. Trinchero2, C. Vigorito7,2, V.F. Yakushev1, A. Zichichi3,4,5,11
(LVD Collaboration)
1 Institute for Nuclear Research RAS, 117312,prospect 60-letya Oktyabrya,7a, Moscow, Russia
2 INFN-Torino, OATO-Torino, 10100 Torino, Italy
3 INFN-Bologna, 40126 Bologna, Italy
4 University of Bologna, 40126 Bologna, Italy
5 Centro Enrico Fermi, 00184 Roma, Italy
6 INFN, Laboratori Nazionali del Gran Sasso, 67100 Assergi L.Aquila, Italy
7 University of Torino, 10125 Torino, Italy
8 Laboratoire de Physique Nucl.eaire et de Hautes Energies (LPNHE), Universit.es Paris 6 et Paris 7, CNRS-IN2P3, Paris, France
9 University of Campinas, 13083-859 Campinas, SP, Brazil
10 Massachusetts Institute of Technology, Cambridge, MA 02139-4307, USA
11 CERN, Geneva, Switzerland
∗ Corresponding author: agafonova@lngs.infn.it
Abstract
The charge ratio for atmospheric muons has been measured using Large Volume Detector (LVD) in the INFN Gran Sasso National Laboratory, Italy (minimal depth is 3000 m w.e.). To reach this depth muons should have the energy at the sea level greater than 1.3 TeV. The muon charge ratio was defined using the number of the decays of stopping positive muons in the LVD iron structure and the decays of positive and negative muons in scintillator. We have obtained the value of the muon charge ratio .
Keywords: atmospheric muons, underground experiment, charge composition
1 Introduction
The charge ratio of cosmic ray muons has been studied since the muon discovery. The muons
charge ratio was used to obtain that of primary cosmic rays (p.c.r.) because the ratio
at muon energy 5 TeV depends on the p.c.r. charge ratio
and on the characteristics of interactions of p.c.r. particles with air nuclei
(differential cross-section of the - and K-meson production, total cross-section).
The charge composition of near-vertical muon flux is of particular interest since
near-vertical muons dominate in the total flux. The data obtained in 20
experiments [1],[2] at the sea level up to 100 GeV/c are
in a good agreement with
the standard concept about p.c.r spectrum and pA- and AA- interactions in the
corresponding range of p.c.r. energy below 0.6 TeV.
There are very few measurements [3], [4], [5],
[6], [7] for the energy higher than 100 GeV.
The spread of the mean values of the -ratio and significant errors of
the measurements do not allow to draw a conclusion about behavoir of the
value at the energy 1 TeV.
The new mechanisms of the secondary particle production in pA-interactions
leading to the change of the value can appear for 100 GeV.
The calculations [8] show that
the discovered quark-gluon state of matter (Quark Gluon Plasma - QGP)
in pA-interaction could lead to a progressive decrease of the value from
1.3 at 100 GeV to 1.14 at 10 TeV. The value is of particular interest at
the energies above 1 TeV where the number of available experimental data is quite low.
QGP is a state of matter at
large density of quarks and gluons. This high enery density state would be characterized by a strongly
reduced interaction between quarks and gluons so they would exist in a nearly free state. QGP was
obtained at RHIC in BRAHMS, STAR, PHENIX and PHOBOS experiments
in central collisions between gold nuclei at the center of mass energy of 100GeV + 100GeV.
The large number of articles produced by the four experiments at RHIC may be found on
their respective homepages [9].
This energy is so large that conversion of a sizeable fraction of the initial kinetic energy into
matter production creates many thousands of particles in a limited volume.
Nowadays, the LVD data can be used to obtain the positive excess of near-vertical
muons of such energies and to evaluate the stopping muon charge composition [10]. The
minimum depth of LVD location is 3000 m w.e., the average depth is 3600 m w.e.
Only muons at energies above 1.3 TeV at surface
can reach this depth. The muons, stopped at the LVD depth, have at surface the median energy 1.8 TeV.
While 95% of the stopping muons are within the range of 900 GeV - 3 TeV.
The average flux of cosmic muons at the LVD depth
is [11].
2 Detection Method
LVD [12] is located under Gran Sasso Mountain in central Italy. It is a
scintillation-tracking detector with iron-hydrocarbonate target. The total detector mass is
2 kt (iron and liquid scintillator). Scintillator (, = 9.6,
with =0.78 [13]) and iron are
distributed uniformly in the volume of the apparatus forming a modular structure
of 840 elementary cells. The cells are grouped in three towers, each consisting
of 7 layers. The tower dimension is 13 (length) 6 (width) 10 (height) .
The cell is a scintillation
counter of a volume of surrounded by
iron, which has mean thickness
of 2.9 cm. Each counter is viewed from the top by three photomultiplier tubes (PMTs) with diameter of 15 cm.
Eight counters are assembled into the iron module. The configuration of
iron and scintillator permits to detect the products of nuclear interactions in iron
using the scintillation counters. The detection energy threshold is 5 MeV.
The iron mass is equal to about 45% of the total mass in the inner part of the tower.
So the ratio of the muon stopping in the scintillator and in iron is
at the uncertainty of 2.5%.
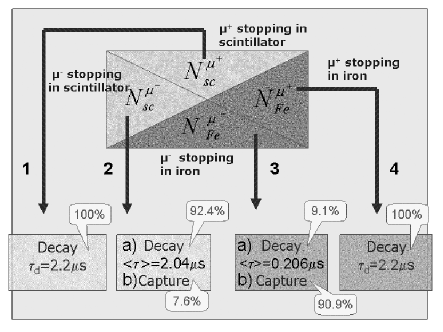
The stopping processes in the LVD materials are presented in Fig. 1.
The charge composition of the muon flux can be obtained by measuring the fraction of negative or positive muons in the total amount of stopping muons:
| (1) |
where and are the numbers of and
stops in a counter normalized by the muon flux for the counter that is
,.
The features of LVD setup such as the configuration of iron and scintillator,
the electronic dead time of 1 , the presence of photomultiplier afterpulses
allow to establish
a) the number of -decays in scintillator ;
b) the number of -decays in iron .
The value of a) is determined by searching for pulses in the
scintillation counters crossed by muon, i.e. placed along the muon track.
The value of b) can be obtained by using the data of the counters
that were adjacent to the counters crossed by muon. Using a)
we can get the total number of
stopping muons in scintillator. From b) we can go to so,
| (2) |
We can detect only decays but not captures. As follows from Fig. 1 number
of decays in iron is less than number of stops.
This fact is taken into account by using detection efficiency.
Stopping decays only.
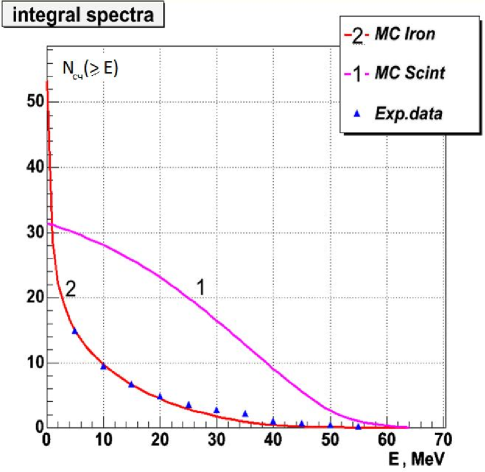
The energy spectrum of has a maximum at 37 MeV and the greatest energy of 52.8 MeV.
The positrons together with gamma-quanta from electromagnetic cascades
(if muon decays in iron) and gamma-quanta from electron-positron annihilation
are detected in the scintillation counters. The observed energy spectrum and
detection efficiency of -decays in scintillator differ radically from
the corresponding values of -decays in iron (Fig. 2).
Stopping in detector materials may either decay or be captured by iron
and carbon nuclei.
The energy spectrum of negative muon decay products is the same as for positive one,
but the time characteristics depend on nuclear composition of the matter.
The rate of -capture depends on as
[17]. Thus, in the case of
stops in iron negative muons are mainly captured by iron nuclei (90.9% of
all -stops in iron), and in the case of stops in scintillator they
mainly decay (92.4% of all -stops in scintillator). -captures
do not contribute to the final result because of the small fraction of
-captures in the scintillator and of the small duration (1 ms) of the time
window for the data taking compared to the average lifetime of the products
of the reaction
().
The fraction of detectable muon captures in the
scintillator is negligible (0.1%). The probability of
-capture by a free proton is 200 times less than the probability
of -capture, so this process was not taken into account.
-capture is accompanied by gamma-quanta emission (0.32 gamma-quanta
per capture) with energies of 3 - 10 MeV [15] and also emission of
1.13
neutrons on average [16]. The time distribution of gamma-quantum pulses
is described with a lifetime in iron:
= 0.206
(at ,
). ,
are the rates of -capture and -decay in iron.
The same exponent corresponds to the time distribution of -decays in iron.
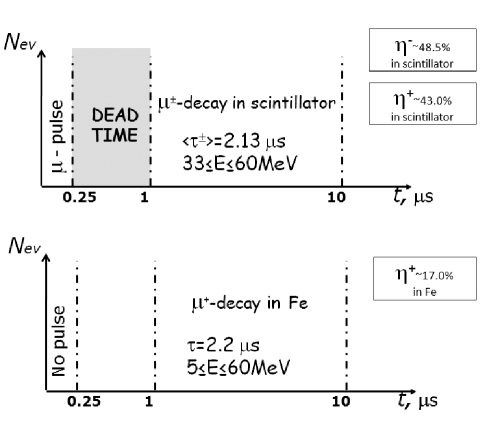
Although they represent the large fraction of events, -captures are not
considered in our analysis because large amount of events in the time interval of 0.25 - 1.00
is the composition of the processes 3a, 3b,
4 shown in Fig. 1 (See Fig. 3).
The range 0 - 0.25 is used to define if a counter is crossed by muon or
placed out the muon track. This range is a time interval of the counter hit delays due
to delays of PMT responses.
3 The selection criteria
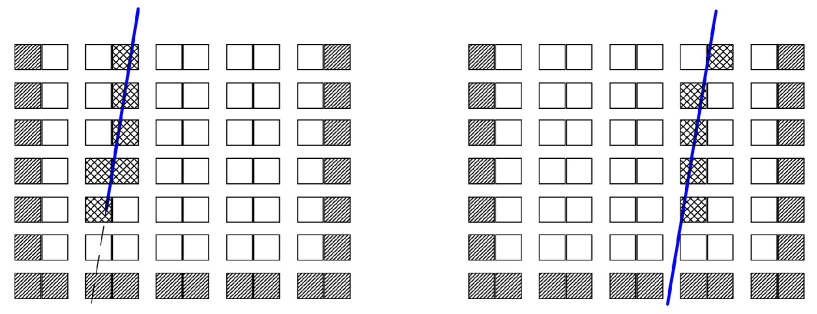
We have analyzed the single muon events in the first LVD tower. A single muon event
is defined as the presence of pulses with energy greater than
5 MeV in several counters (from 2 to 11) in the time window 0.25 from the
first pulse of the cluster of pulses originated by muon (Fig. 4).
5 MeV is the threshold of detection of an energy released in a
counter. The
cluster corresponds to a single muon event. It is the
set of muon pulses in counters crossed by muon.
Such a criterion allows to eliminate the local
produced muons, multiple muons and muons with accompanying shower. The local
produced muons are arised from
decays of pions generated in hadronic showers developed in the rock
near detector. The energy of the local muons is not enough to cross more
than one counter. Both multiple muons and muons with accompanying shower
cross as a rule more than 11 counters.
The pulse at energy from 33 to 60 MeV in a
time window of 1 - 10 is regarded
as candidate for -decay
in scintillator. The beginning of the time interval is determined by
dead time = 1.0 after muon ionization loss pulse in a counter
(Fig. 3 upper diagram).
The counter time resolution for energy range corresponding to
the energy deposit of a muon
is 70 ns, TDC discreteness
is 12.5 ns; the counter energy resolution is 25% for 5 - 60 MeV energy
range [14].
The pulses in the same energy and time intervals but in the counters outside
the muon track (i.e., without any pulse in the time window of 0.25 )
are considered as candidates for -decays in iron. Due to
the lifetime in iron, the events of -captures and -decays
have time less than 1 (Fig. 3 lower diagram).
Detection efficiency for -capture in an
adjacent counter is about (using 0.32
gamma-quanta per capture). Here is probability for gamma-quanta at energy of 1 - 3 MeV to imitate a
pulse in an adjacent counter at energy higher of 5 MeV.
Detection efficiency for -decay is 0.17 (see Fig. 3, ).
So, taking into account the decay fraction in Fe, which is about 9%,
we may neglect the number of negative muons that decay or get captured.
The data of 110 counters from 120 inner ones (from 2nd to 6th levels of first tower)
were used in the analysis. They were selected due to the time
characteristics and stability.
4 Background estimation
The PMT afterpulses are the main background for the selection of -decays
in scintillator. The -quanta induced by -captures are background
for -decays in iron. Neutrons are also produced in -captures.
To exclude the background due to the PM afterpulses in the window of 1-10 ,
all muon events are divided into 2 groups: through-going
and “quasi-stopping”. The muon is regarded as through-going
if it produced a pulse in 0 - 0.25
time interval with energy higher than 10 MeV in the lower level counter.
The remaining events are regarded as quasi-stopping (Fig. 4 right). Obviously,
the ratio of muons really stopped
in the LVD detector to the total amount of quasi-stopping muons is
small because some muons can leave the
detector through a gap (corridor) between columns (Fig. 4 left). Since
there is no muon decay, the first group of events allows to determine the
afterpulse rate for each counter.
The number of real muon decays is thus given by the difference between number of
pulses in the 1 - 10 window for the quasi-stopping events and the
normalized number for through-going muons.
Then we get the integral time distribution in the 1 - 10 window and total
amount (at t = 0) of -decays in scintillator. At this stage we
use -decay exponent to eliminate the background
from -captures which is almost flat in the range of 1 - 10 .
5 Results
The analysis of the muon charge ratio is fulfilled using data of the
1st LVD tower during 6 years of data collection.
The data set contains 10986384 muon pulses in 110 counters. We have selected
2299 -decays in scintillator having an energy released by the
decay products larger than 33 MeV. This additional cut was required
to remove the events when muon crosses a counter, then stops and decays
in iron wall while the decay products reenter into the same counter.
The energy release of the products of muon decay in iron does not exceed
33 MeV which is approximately the mean value of the free muon decay spectrum (Fig 2).
The number of -decays in iron is 1335.
5.1 Normalized number of -decays in scintillator
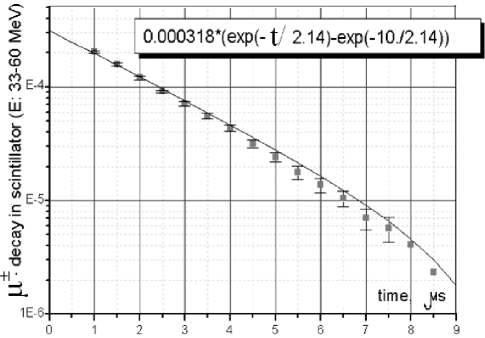
We obtain the value of in (1) using the experimental number of at the energy threshold of 33 MeV and a corresponding detection efficiency :
| (3) |
is the value of the function at t=0 (Fig 5). Each point in the plot presents the value averaged over 110 counters at fixed in the time interval of 1- 10
The value of depends on the detection efficiency (for energy threshold of 33 MeV) of -decays, the charge composition of muons , and the fraction of -decays in scintillator:
| (4) |
| (5) | |||||
, are the rates of -capture and -decay in scintillator. Uncertainties in the rates are 2.7% and 1.4%, respectively [15]. The values of and were calculated using a GEANT4 Monte Carlo simulation: = 0.430, = 0.485 (Table 1). The efficiency is less than due to worser detection efficiency of gamma-quanta from -annihilation. Thus we get:
| (6) |
To obtain the number of the experimental integral distribution (Fig. 5) is fitted by the exponent having = 2.135 . Of course, the exponent depends on both the - lifetime in scintillator ( = 2.2 , = 2.045 ) and the muon flux charge composition but the dependence is weak: we have found that a variation of k from 1.0 to 1.5 changes the exponent from 2.13 to 2.14 . On the other hand, varies insignificantly while changing value in the range 2.13 - 2.14 .
5.2 Normalized number of -decays in scintillator
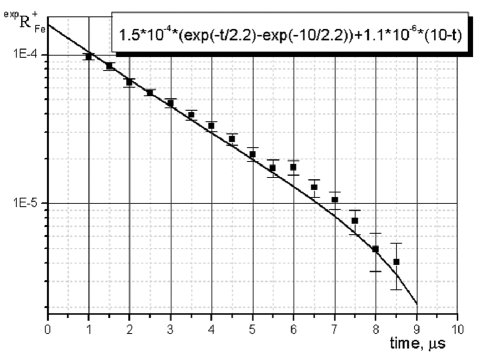
We obtain the value of using the experimental value of (Fig. 6) with provision for the mass factor and the efficiency . Besides we need the quantity which presents the amount of electrons , penetrating into a given counter from an adjacent counter where decayed occured:
| (7) | |||||
The constant takes into account the fact that a counter detects -decays
in iron of an adjacent counter, thus .
(Each side of an inner counter has only one side of an adjacent counter.
The role of the contribution of the relative counter position in the -decay detection
efficiency is taken into account by value of ).
The coefficient is the fraction of -decays in scintillator that
produce pulses with energy larger than 5 MeV in an adjacent counter:
The values of and were calculated using GEANT4:
=0.06, =0.04 (Table 1).
5.3 Determination of the charge ratio value
The ratio of in (1) is
| (8) |
and
| (9) |
The right part of the equation also depends on . Thus we solve it numerically.
In conclusion, we have determined the single muon charge ratio for the flux of near-vertical muons in
energy range from 1 TeV to 3 TeV at the sea level and
average energy about 1.8 TeV:
| (10) |
| Quantity | Magnitude | Uncertainty, % | |
|---|---|---|---|
| 1.5 | 8 | ||
| Measured | 3.18 | 5 | |
| M | 1.21 | 2.5 | |
| 0.924 | 3 | ||
| 0.17 | 2 | ||
| 0.430 | 1.5 | ||
| Calculated (MC) | 0.485 | 1.5 | |
| 0.06 | 1.5 | ||
| 0.04 | 1.5 | ||
| 0.048 | 4 |
The first error is statistic while the second one is systematic.
The statistic uncertainty depends on the statistic error of the quantities
of and in Eq.10. The values were obtained on basis
of 1335 and 2299 events, correspondingly.
The systematic error depends mainly on uncertainties of experimental values
, , the mass factor and calculated numbers of
, , (Table 1).
The systematic relative uncertainties in and
depend on the procedure of determinating of these
values using the plotted points in Fig. 5, 6.
The error of the mass factor is 0.025. It is associated
with accuracy of determination of scintillator and iron mass
which are, correspondlingly, 1150 17 kg () and
950 20 kg () per a counter.
The uncertainty of the MC calculation of efficiency
is about 2% due to accuracy of determination of an iron module mass.
Uncertainty is the values of
is 1.5 % and it depends on accuracy of determination of the scintillator mass in a counter.
The uncertainty in the value depends on the measured rates of
( = 0.027) and ( 0.014) in Eq.6. It is 0.03.
Besides the known uncertainties in the values of , , the systematic error of
the value depends on uncertainty in the unknown charge composition . As the dependence
is very week we can assume to estimate a value of . At such a condition
we have obtained .
The resultant systematic uncertainty is the square root of the quadrature sum of the errors of the values
in the equation (10).
6 Conclusion
In LVD experiment the muon charge ratio was measured without the use of a magnetic field. Method of measurement
is based on different probability of decay and capture of negative muons in heavy and light material. This method
allows to measure the charge composition of the flux of single muons at the average muon energy of 270 GeV, which
correspond to about 2 TeV at the surface.
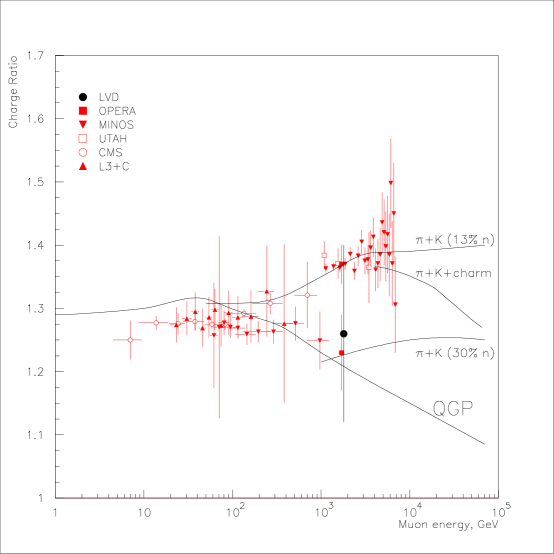
Despite the large uncertainties, the LVD result supports data in the energy range 0.2 - 2 TeV having
the value of about 1.28 (Fig. 7). Perhaps this is due to the peculiarities of the charge
composition of the near-vertical muon flux.
The experimental value of the muon charge ratio in comparisons
with the theoretical predictions [8] is shown in Fig. 7.
The first and third curves from the top of the figure are for muons from pion and kaon decays (neutrons
are 13% and 30% of protons in primary nucleon radiation). The second and forth curves are the results
of calculations with the inclusion of charm () or QGP.
Given a set of the modern experimental data at the surface energies greater than 2 TeV
obtained with magnetic spectrometer in the flux of non-vertical muons at zenith angles more than 45 degrees, one
can conclude that, firstly, the QGP state does not
play a significant role at pion production in collisions
in cosmic rays, and, secondly, the model included 30% of neutrons is unrealistic.
Acknowledgements.
This work is made with the RFFI financial support (grants 12-02-00213a, SSchool-3110.2014.2) and Program for Fundamental Research of Presidium of RAS.
References
- [1] Vadim S. Naumov, Atmospheric muons and neutrinos, arXiv:hep-ph/0201310v2 (2002)
- [2] E.V. Bugaev et al., Phys. Rev. D 58,054001 (1998)
- [3] OPERA collaboration, Measurement of the cosmic ray muon charge ratio with the OPERA experiment., Eur. Phys. J. C 67, 25-37, (2010); arXiv-1003.1907v1
- [4] P. Adamson et al. (MINOS Collaboration), Phys. Rev. D 76, 052003 (2007); P. Adamson et al. (MINOS Collaboration), Phys. Rev. D 83, 032011 (2011)
- [5] The L3 Collaboration, ArXiv:hep-ex/0408114 (2004)
- [6] G. K. Ashley II, J.W. Keuffel, and M.O. Larson, Phys. Rev. D 12, 1, (1975) p.20-35
- [7] CMS Collaboration, Phys. Lett. B 692 83-104 (2010), arXiv:1005.5332
- [8] L.V. Volkova, Bull. of the Russian Acad. of Sci.Phys. v.71,N4, (2007), pp.5560-563; Phys. of Atomic Nuclei, 71, 1782, (2008)
- [9] BRAHMS homepage: http://www4.rcf.bnl.gov/ brahms/WWW/brahms.html; PHENIX homepage: http://www.phenix.bnl.gov/; PHOBOS homepage: http://www.phobos.bnl.gov/; STAR homepage: http://www.star.bnl.gov/.
- [10] N.Yu. Agafonova et al., LVD Collaboration, The Muon Decay and Muon Capture Detection with LVD, Proc. of 29th International Cosmic Ray Conference, Pune, 6, pp.69-72, (2005)
- [11] Marco Selvi on the behalf of the LVD collaboration, Analysis of the seasonal modulation of the cosmic muon flux in the LVD detector during 2001 - 2008. Proc. of the 31st ICRC, Lodz, (2009)
- [12] Bari G et al., The large-volume detector (LVD): a multipurpose underground detector at Gran Sasso., Nucl. Instrum. Methods Phys. Res., A:277, 11-16, (1989);M. Aglietta et al., LVD Collaboration, The 1 kton LVD neutrino observatory. Proc. of 27 ICRC, 3, 1093-1095, (2001)
- [13] Voevodsky A.V., Dadykin V.L., Ryazhskaya O.G., Pribory i Tekhnika Eksperimenta, 1, 85 (1970)
- [14] Amanda Porta, Energy measurement in LVD to reconstruct Supernova neutrino emission., Tesi di Dottorato di Ricerca in Fisica XVII ciclo (2003-2005), Universita degli studi di Torino.
- [15] Veisenberg A.O., Mu-meson, Nauka, Moscow, (1964)
- [16] MacDonald B. et al., Phys. Rev., 139, 1253, (1965)
- [17] H. Primakoff, Rev. Mod. Phys. 31, 802 (1959).