The nature of supernovae 2010O and 2010P in Arp 299 – I. Near-infrared and optical evolution
Abstract
We present near-infrared and optical photometry, plus optical spectroscopy of two stripped-envelope supernovae (SNe) 2010O and 2010P that exploded in two different components of an interacting luminous infrared galaxy Arp 299 within only a few days of one another. SN 2010O is found to be photometrically and spectroscopically similar to many normal Type Ib SNe and our multiwavelength observations of SN 2010P suggest it to be a Type IIb SN. No signs of clear hydrogen features or interaction with the circumstellar medium are evident in the optical spectrum of SN 2010P. We derive estimates for the host galaxy line-of-sight extinctions for both SNe, based on both light-curve and spectroscopic comparison finding consistent results. These methods are also found to provide much more robust estimates of the SN host galaxy reddening than the commonly used empirical relations between extinction and equivalent width of Na i D absorption features. The SN observations also suggest that different extinction laws are present in different components of Arp 299. For completeness, we study high-resolution pre-explosion images of Arp 299 and find both SNe to be close to, but not coincident with, extended sources that are likely massive clusters. A very simple model applied to the bolometric light curve of SN 2010O implies a rough estimate for the explosion parameters of erg, M☉ and M☉.
keywords:
supernovae: general – supernovae: individual: SN 2010O – supernovae: individual: SN 2010P – galaxies: individual: Arp 299 – galaxies: starburst – infrared: galaxies.1 Introduction
Luminous and ultraluminous infrared galaxies (LIRGs and ULIRGs) are actively star-forming galaxies with high infrared (IR) luminosity ( and , respectively). The Arp 299 system of multiple galaxy components is commonly adopted as a prototypical LIRG due to its IR luminosity (81000; Sanders et al. 2003), relatively nearby distance (44.8 Mpc; Huo et al. 2004) and interacting nature. Arp 299 consists of two main components, Arp 299A and Arp 299B (sometimes referred to as IC 694 and NGC 3690, respectively), both likely to host an active galactic nucleus (see e.g. Della Ceca et al., 2002; Pérez-Torres et al., 2010). Most of the star formation in LIRGs is concentrated in their central regions, which is also the case in Arp 299. The milliarcsecond resolution of very long baseline interferometry (VLBI) radio observations has proven that there is a rich population of radio supernovae (SNe) and young SN remnants in the nuclear regions of Arp 299A and Arp 299B, within only 100150 and 30 pc from the centre, respectively (Pérez-Torres et al., 2009; Ulvestad, 2009; Romero-Cañizales et al., 2011; Bondi et al., 2012). In particular, Bondi et al. (2012) reported a lower limit of core-collapse supernova (CCSN) rate of 0.80 yr-1 for Arp 299A, suggesting that the bulk of the current star formation was taking place in the innermost 150 pc. The most recent estimate for the total CCSN rate of Arp 299 is 1.61.9 yr-1 derived by Mattila et al. (2012) based on IR and radio observations. So far, Arp 299 has hosted seven optically detected SNe and has been continuously the target of multiple systematic SN search programmes in the optical and near-IR (NIR) wavelengths during the last 15 yr (for a summary see Mattila et al., 2012).
Recently Anderson, Habergham & James (2011) carried out a study on the seven optically detected SNe in Arp 299 indicating that the stripped-envelope Type Ib and IIb SNe are more common and more centrally concentrated than other CCSNe in Arp 299 compared to normal spiral galaxies in the local Universe. The authors explain the excess of Type Ib and IIb SNe to be caused either by the young age of the dominating star formation or a top-heavy initial mass function (IMF), see also Habergham, Anderson & James (2010). In the former case of still-young starburst only the most massive stars would have reached the end of their life cycle, exploding as stripped-envelope SNe, in contrast with Type II SNe with progenitors having lower mass and longer lifetimes. In the latter model the skewed IMF produces an intrinsically higher ratio of high mass progenitors. However, these are both predicated on the assumption that the progenitors to stripped-envelope SNe are massive, presumably Wolf Rayet like stars, whereas the results may reflect a more complex progenitor population of stripped-envelope SNe. In fact, a number of recent studies (e.g. Dessart et al., 2012; Eldridge et al., 2013) have concluded that binaries must contribute a significant fraction of stripped-envelope SN progenitors. The reason why binary systems could be more common in LIRGs such as Arp 299 is unclear, although this can be related to a larger fraction of star formation taking place in high-density environments of young massive clusters (Portegies Zwart, McMillan & Gieles, 2010). A similar trend of excess stripped-envelope SNe has also recently been found in statistical samples of disturbed (Habergham, James & Anderson, 2012) and IR bright actively star-forming galaxies (Kangas et al., 2013), who argued metallicity effects not to be a dominant effect on this. We also note that the seemingly ‘normal’ spiral galaxy NGC 2770 has hosted three CCSNe which have all been Type Ib SNe (Thöne et al., 2009) showing that such a CCSN distribution can also exist in a non-starburst galaxy by chance.
This is Paper I in a set of two papers studying the nature of SNe 2010O and 2010P, the two most recent optically detected SNe in Arp 299, the initial results of which were used by the recent studies of Anderson et al. (2011) and Mattila et al. (2012). In this paper we present and discuss in detail the NIR and optical follow-up data of these SNe, including adaptive optics (AO) data obtained with the Gemini-North Telescope. The accompanying Paper II (Romero-Cañizales et al., 2014, hereafter Paper II) concentrates on the radio data obtained on SN 2010P probing the SN interaction with the surrounding circumstellar medium (CSM).
In Section 2 background information on SNe 2010O and 2010P is given, in Section 3 we present the NIR and optical observations and in Section 4 the results from the analysis are reported. The high-resolution pre-explosion data are studied in Section 5 and the nature of the two SNe is discussed in Section 6. Conclusions are given in Section 7.
2 SN 2010O and SN 2010P
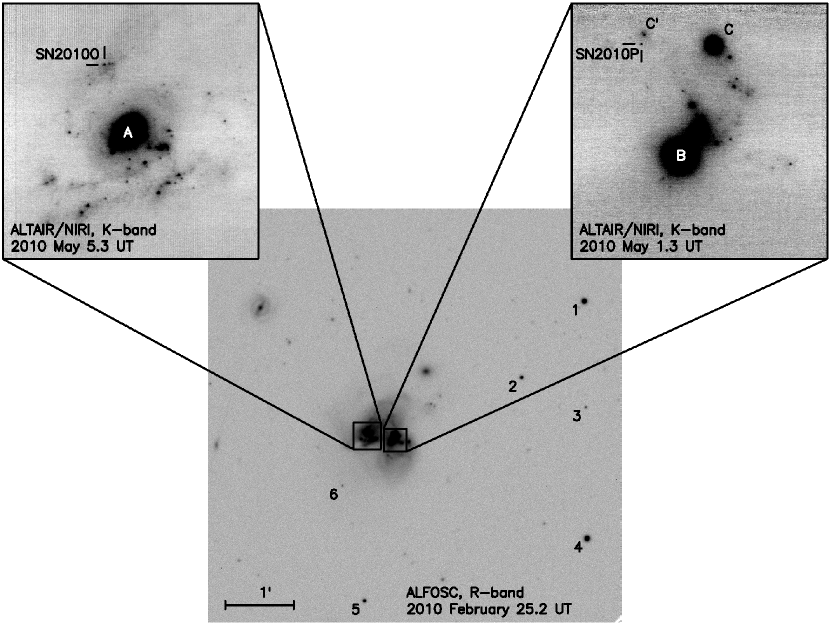
The discovery of SN 2010O, located at and (equinox J2000.0), was first reported by Newton, Puckett & Orff (2010) based on unfiltered optical imaging carried out by the Puckett Observatory Supernova Search on 2010 January 24.37 and 25.34 ut. Arp 299 was also observed by us in a monthly monitoring programme on 2010 January 18.2 ut using the 2.56-m Nordic Optical Telescope (NOT) in JHKs bands, leading to a NIR discovery of both SNe 2010O and 2010P via comparison to a reference image, with SN 2010P located at and (equinox J2000.0). A confirming epoch of observations was obtained on 2010 January 23.1 ut. Thus our independent NIR discovery of SN 2010O precedes that of Newton et al. (2010) and provides tighter constraints on the explosion date. The fact that the Puckett Observatory did not report the discovery of SN 2010P already indicates a very high visual host galaxy extinction in the line-of-sight to this SN. Our NIR discovery of SN 2010P was reported in Mattila & Kankare (2010). The field of SNe 2010O and 2010P is shown in Fig. 1, with an R-band image of Arp 299 and subsections of the K-band Altitude Conjugate Adaptive Optics for the Infrared (ALTAIR)/Near-Infrared Imager (NIRI) AO images of the main components of Arp 299. The explosion site of SN 2010O is overlapping with one of the spiral arms of the A component of Arp 299, whereas the explosion site of SN 2010P has a small angular distance (170 pc) to the IR bright C nucleus of Arp 299. For the naming convention of the components of Arp 299, see Gehrz, Sramek & Weedman (1983).
Beswick et al. (2010) reported a 5.0-GHz Multi-Element Radio Linked Interferometer Network (MERLIN) non-detection of SNe 2010O and 2010P at the 3 confidence level of 186 Jy beam-1, observed between 2010 January 29.8 and February 1.1 ut. The first radio detection of SN 2010P was reported by Herrero-Illana et al. (2012), obtained on 2011 June 15, 1.4 yr from the explosion, with the Expanded Very Large Array (EVLA) at 8.5 GHz with a 703 60 Jy beam-1 counterpart to SN 2010P.
The optical spectroscopy of SN 2010O obtained on 2010 January 28.0 ut showed it to be a Type Ib SN close to maximum light (Mattila et al., 2010). The radio non-detections of SN 2010O, reported in Paper II, are consistent with this (Soderberg et al., 2006a). An optical spectrum of SN 2010P was obtained on 2010 February 11.5 ut showing it to be consistent with a very highly reddened Type Ib or Type IIb SN, 13 weeks after the maximum light, as reported in Ryder et al. (2010). However, the Type Ib origin of SN 2010P is ruled out by the late-time evolution observed at radio wavelengths, indicating that the SN is a Type IIb event, with a substantially longer rise time to reach the peak radio luminosity than previously observed for any Type IIb SN (see Paper II).
Bond et al. (2010) obtained early ground-based images of SN 2010O and by aligning them with pre-explosion archival Hubble Space Telescope (HST) images observed in B and I bands (F435W and F814W, respectively) reported the SN to be coincident with a young and very blue stellar cluster hosting likely very massive stars. However, the follow-up observations with the HST revealed SN 2010O to be only close, but not on the line-of-sight to this cluster (Bond et al., 2011). Furthermore, Nelemans et al. (2010) analysed two epochs of Chandra X-ray archival data concluding the position of SN 2010O to be coincident with a varying X-ray source and suggested its progenitor to be a Wolf-Rayet X-ray binary, if associated with this system.
3 Observations
3.1 Near-infrared and optical imaging
JHKs-band imaging of Arp 299 with the NOT was carried out with the Nordic Optical Telescope Near-Infrared Camera and Spectrograph (NOTCam; Djupvik & Andersen, 2010) with a pixel scale of 0.234 arcsec pixel-1 and field-of-view (FOV) of arcmin2 in the wide-field imaging mode. The NOTCam data reduction included flat-fielding, sky subtraction and median combination of the aligned frames. The reductions were carried out using an external iraf111iraf is distributed by the National Optical Astronomy Observatories, which are operated by the Association of Universities for Research in Astronomy, Inc., under cooperative agreement with the National Science Foundation. package notcam version 2.5, available on the NOT webpages.222http://www.not.iac.es/instruments/notcam/guide/observe.html The geometric distortion on the NOTCam was also corrected using the above mentioned package. JHKs images obtained on 2009 July 15.0 ut in our monitoring programme were used as reference frames for image subtraction. Reference frames were reduced similarly to the frames with the SNe, and the image pairs were aligned with iraf scripts based on geomap and geotran. Image subtraction was carried out with the isis 2.2 image subtraction package based on the Optimal Image Subtraction (OIS) method (Alard & Lupton, 1998; Alard, 2000). In the OIS method the point spread function (PSF) of the better seeing image is matched to that of the worse seeing image by using a convolution kernel derived by the software between the spatially aligned pair of images. The NOTCam images of SNe 2010O and 2010P were calibrated using Two Micron All-Sky Survey (2MASS) stars in the FOV. The PSF photometry was carried out with the quba333python package specifically designed by S. Valenti for SN imaging and spectra reduction. For more details on the pipeline, see Valenti et al. (2011). pipeline.
Follow-up imaging of SNe 2010O and 2010P with the Gemini-North Telescope was carried out as part of our survey to search for highly obscured nuclear CCSNe in a sample of eight LIRGs (see Kankare et al., 2008, 2012). The observations were conducted with the NIRI (Hodapp et al., 2003) with the ALTAIR laser guide star (LGS) AO system in JHK-bands (programmes GN-2009B-Q-23 and GN-2010A-Q-40, PI: S. Ryder). The ALTAIR/NIRI AO set-up with the f32 camera provides a pixel scale of 0.0219 arcsec pixel-1, a FOV of arcsec2 and a typical full width at half-maximum (FWHM) of 0.1 arcsec. The ALTAIR/NIRI data were reduced with the external niri package available in iraf, including flat-fielding and sky subtraction. We used our own iraf scripts to remove the horizontal noise pattern visible in some of the frames and to combine the individual frames. Similar to the NOTCam data, reference images were subtracted from the reduced ALTAIR/NIRI frames using isis 2.2. The reference frames were obtained with the same instrument and set-up in JHK on 2012 January 29.5 ut for SN 2010O, in K on 2011 April 17.3 ut and in JH on 2012 January 31.5 ut for SN 2010P. The subtracted images used the zero-point derived from the reference fields, and were calibrated with instrument zero-points derived from photometric JHK-band standard star (Hawarden et al., 2001) observations. The standard star FS 127 was observed on the same nights as the reference frames with the exception of the K-band reference field for SN 2010P, which was calibrated with the photometric standard star FS 131 observed on the following night. The atmospheric extinction correction was done using the values of Leggett et al. (2006). The photometry was carried out using aperture photometry with gaia.444http://star-www.dur.ac.uk/~pdraper/gaia/gaia.html For each subtracted image a curve of growth of the SN flux with increasing aperture size was measured and an optimal aperture size was selected to be as large as possible such that the aperture photometry would not be compromised by nearby sources or background, with a typical radius adopted of 0.7 or 0.9 arcsec. This was used to measure both the SN and to derive the instrument zero-point. The statistical error given by gaia was adopted as the error of photometry, no systematic errors were estimated. This is likely to somewhat underestimate the errors of ALTAIR/NIRI photometry, when the SNe were still bright.
The optical imaging of SNe 2010O and 2010P was obtained using the Andalucia Faint Object Spectrograph and Camera555The data presented here were obtained in part with ALFOSC, which is provided by the Instituto de Astrofisica de Andalucia (IAA) under a joint agreement with the University of Copenhagen and NOTSA. (ALFOSC) and stand-by CCD camera (StanCam) at the NOT, the RATCam at the Liverpool Telescope (LT; Steele et al., 2004), and the SBIG ST-8XME camera with the 14-inch Celestron at Taurus Hill Observatory (THO). Archive images from the Wide Field Camera (WFC) at the Isaac Newton Telescope (INT) and the HST Wide Field Camera 3 (WFC3) Ultraviolet-Visible (UVIS) channel were also used. The ground-based imaging was reduced using the standard iraf tasks and the help of the quba pipeline, including bias subtraction and flat-field correction. Similar to the NIR data, the optical images were template subtracted using the OIS method, and the reference images of Arp 299 obtained with the ALFOSC on 2009 April 13.1 ut and 2012 February 18.2 ut. The optical images were calibrated using (up to) six field stars which, in turn, were calibrated with the observations of the field of Arp 299 and Landolt (1992) standard star fields (SA 104 334 and PG 1323086) on 2013 May 28.1 ut. The night on La Palma was later confirmed as photometric based on the atmospheric extinction monitoring measurements at the Carlsberg Meridian Telescope666http://www.ast.cam.ac.uk/~dwe/SRF/camc_extinction.html and the comparison of the derived and the reported777http://www.not.iac.es/instruments/alfosc/zpmon/ instrumental zero-points for ALFOSC to each other. The PSF-fitting photometry was carried out with the quba pipeline. The optical colour terms for ALFOSC and RATCam were adopted from Ergon et al. (2013). The image subtraction yielded detections of SN 2010O in the BVRI bands whereas SN 2010P could only be detected in the I band due to the high line-of-sight host galaxy extinction obscuring the SN in shorter wavebands. The magnitudes of the sequence stars derived in BVRI and adopted from 2MASS in JHK are listed in Table 1 and the photometry for SNe 2010O and 2010P is presented in Tables 24. In 2010 July SNe 2010O and 2010P disappeared behind the Sun. However, when Arp 299 became observable again at a reasonable airmass, JHKs imaging with NOTCam was obtained on 2010 November 1.3 ut, which yielded non-detection of both SNe.
PSF-fitting photometry was performed on both SNe in the archive HST+WFC3/UVIS images (programme GO-12295, PI: H. Bond) taken on 2010 June 24.9 ut using the dolphot package.888http://americano.dolphinsim.com/dolphot/ The magnitudes are reported in the VEGAMAG system in the HST filters, which are comparable to UBI for F336W, F438W and F814W, respectively.
| Star | |||||||
|---|---|---|---|---|---|---|---|
| # | (mag) | (mag) | (mag) | (mag) | (mag) | (mag) | (mag) |
| 1 | 15.49(0.01) | 14.91(0.01) | 14.56(0.02) | 14.21(0.01) | 13.82(0.03) | 13.55(0.04) | 13.52(0.05) |
| 2 | 18.26(0.01) | 17.21(0.01) | 16.46(0.02) | 15.82(0.01) | 14.94(0.05) | 14.50(0.07) | 14.27(0.07) |
| 3 | 20.97(0.01) | 19.41(0.01) | 18.44(0.02) | 17.10(0.01) | 15.83(0.09) | 15.38(0.14) | 15.03(0.12) |
| 4 | 15.78(0.01) | 14.85(0.01) | 14.37(0.02) | 13.87(0.01) | 13.22(0.02) | 12.79(0.03) | 12.67(0.03) |
| 5 | 18.21(0.01) | 17.13(0.01) | 16.87(0.02) | 16.24(0.01) | 15.56(0.07) | 14.84(0.09) | 15.36(0.16) |
| 6 | 21.16(0.01) | 19.87(0.01) | 19.27(0.02) | 18.39(0.01) |
| JD | Date | Telescope/instrument | |||
| (240 0000+) | (ut) | (mag) | (mag) | (mag) | |
| 55214.7 | January 18.2 | 16.55(0.03) | 16.49(0.05) | 16.22(0.07) | NOT/NOTCam |
| 55219.5 | January 23.0 | 16.19(0.02) | 16.06(0.05) | 15.64(0.05) | NOT/NOTCam |
| 55224.1 | January 27.6 | 15.93(0.04) | 15.32(0.02) | 14.74(0.02) | Gemini-North/ALTAIR/NIRI |
| 55234.8 | February 7.3 | 15.92(0.02) | 14.94(0.09) | 14.85(0.13) | NOT/NOTCam |
| 55251.9 | February 24.4 | 15.77(0.02) | 15.45(0.05) | Gemini-North/ALTAIR/NIRI | |
| 55252.9 | February 25.4 | 16.95(0.10) | Gemini-North/ALTAIR/NIRI | ||
| 55315.5 | April 29.0 | 18.41(0.12) | 17.68(0.13) | 17.44(0.12) | NOT/NOTCam |
| 55321.8 | May 5.3 | 18.83(0.42) | 17.21(0.09) | 17.29(0.20) | Gemini-North/ALTAIR/NIRI |
| JD | Date | Telescope/instrument | |||||
|---|---|---|---|---|---|---|---|
| (240 0000+) | (ut) | (mag) | (mag) | (mag) | (mag) | (mag) | |
| 55219.6 | January 23.1 | 16.55(0.03) | NOT/StanCam | ||||
| 55223.4 | January 26.9 | 18.27(0.11) | 17.41(0.02) | 16.45(0.04) | THO | ||
| 55224.5 | January 28.0 | 18.46(0.05) | 17.48(0.02) | 16.99(0.03) | 16.43(0.02) | NOT/ALFOSC | |
| 55237.5 | February 10.0 | 19.63(0.05) | 18.02(0.08) | 17.30(0.03) | 16.54(0.02) | LT/RATCam | |
| 55240.5 | February 13.0 | 19.79(0.07) | 18.20(0.05) | 17.44(0.03) | 16.68(0.06) | LT/RATCam | |
| 55252.7 | February 25.2 | 20.61(0.15) | 18.98(0.05) | 18.06(0.03) | 17.30(0.02) | NOT/ALFOSC | |
| 55264.5 | March 9.0 | 21.04(0.15) | 19.20(0.06) | 18.42(0.02) | 17.61(0.03) | NOT/ALFOSC | |
| 55275.4 | March 19.9 | 18.70(0.09) | 17.64(0.10) | NOT/ALFOSC | |||
| 55345.4 | May 28.9 | 21.68(0.26) | 20.60(0.10) | 19.47(0.14) | 19.10(0.15) | INT/WFC | |
| 55372.4 | June 24.9 | 22.90(0.04) | 22.03(0.02) | 19.77(0.01) | HST/WFC3 |
| JD | Date | Telescope/instrument | ||||
| (240 0000+) | (ut) | (mag) | (mag) | (mag) | (mag) | |
| 55214.7 | January 18.2 | 17.47(0.04) | 16.84(0.07) | 16.34(0.06) | NOT/NOTCam | |
| 55219.5 | January 23.0 | 17.04(0.04) | 16.48(0.04) | 15.77(0.05) | NOT/NOTCam | |
| 55219.6 | January 23.1 | 19.36(0.03) | NOT/StanCam | |||
| 55224.1 | January 27.6 | 16.06(0.03) | 15.25(0.03) | Gemini-North/ALTAIR/NIRI | ||
| 55224.5 | January 28.0 | 19.08(0.05) | NOT/ALFOSC | |||
| 55234.8 | February 7.3 | 16.30(0.03) | 15.07(0.11) | 15.23(0.28) | NOT/NOTCam | |
| 55237.5 | February 10.0 | 19.11(0.17) | LT/RATCam | |||
| 55240.5 | February 13.0 | 19.13(0.09) | LT/RATCam | |||
| 55252.7 | February 25.2 | 19.45(0.24) | NOT/ALFOSC | |||
| 55252.9 | February 25.4 | 17.22(0.10) | 16.17(0.03) | 15.37(0.03) | Gemini-North/ALTAIR/NIRI | |
| 55264.5 | March 9.0 | 19.75(0.10) | NOT/ALFOSC | |||
| 55315.5 | April 29.0 | 19.06(0.13) | 17.81(0.06) | 17.13(0.08) | NOT/NOTCam | |
| 55317.8 | May 1.3 | 17.68(0.11) | 17.20(0.12) | Gemini-North/ALTAIR/NIRI | ||
| 55372.4 | June 24.9 | 22.18(0.02) | HST/WFC3 |
3.2 Optical spectroscopy
An optical spectrum of SN 2010O was obtained at the NOT with the ALFOSC on 2010 January 28.0 ut. Also a low-resolution optical spectrum of SN 2010P was obtained during the same night with ALFOSC, however, due to the high extinction it had a very low signal-to-noise ratio. A follow-up spectrum of SN 2010O was also obtained on 2010 March 20.1 ut with ALFOSC. The NOT spectra were reduced using the quba pipeline including bias subtraction, flat-fielding, spectral extraction, wavelength and flux calibration. The wavelength calibration was carried out using a HeNe arc lamp exposure and cross-correlated with the sky lines. Relative flux calibration was conducted using a spectrum of a spectroscopic standard star observed close in time to the SN spectrum. Telluric features have not been removed.
A deep optical spectrum of SN 2010P was obtained with the Gemini-North Telescope using the Gemini Multi-Object Spectrograph (GMOS; Hook et al., 2004) on 2010 February 11.5 ut. The GMOS optical spectral data were reduced using the gmos tasks in the gemini package within iraf. A master bias frame (constructed by averaging with 3 clipping a series of bias frames) was subtracted from all raw images. Images of a CuAr lamp spectrum were used to wavelength calibrate the science images and straighten them along the spatial dimension, while images of a quartz-halogen lamp spectrum helped correct for sensitivity variations within and between the CCDs. Observations of the spectrophotometric standard star Feige 66 (Massey et al., 1988) with the same instrument set-up and similar airmass to that of the SN 2010P observations enabled a system response function to be derived and applied over the wavelength range 47108950 Å; and the removal of telluric features in the SN 2010P spectrum. The spectroscopic observations are reported in Table 5.
| SN | JD | Date | Grism/grating | Range | Resolution | Exp. time | Telescope/instrument |
|---|---|---|---|---|---|---|---|
| (240 0000+) | (ut) | (Å) | (R) | (s) | |||
| 2010O | 55224.5 | January 28.0 | gm#7 | 38506850 | 650 | 600 | NOT/ALFOSC |
| 2010P | 55239.0 | February 11.5 | R400 | 40009500 | 1918 | Gemini-North/GMOS | |
| 2010O | 55275.6 | March 20.1 | gm#4 | 32009100 | 270 | 3600 | NOT/ALFOSC |
4 Results
4.1 Photometric results
| SN | JDexplosion | JDmax | Ref. | |||||||
|---|---|---|---|---|---|---|---|---|---|---|
| (240 0000+) | (mag) | (mag) | (mag) | (240 0000+) | (d) | (mag) | (mag) | (mag) | ||
| 1999ex | 51480.5 | 33.55 | 0.06 | 0.87 | 51498.1a | 18a | 1 | |||
| 2005bf | 53458 | 34.62 | 0.14 | 0.0b | 53499.8c | 42c | 2,3 | |||
| 2007Y | 54145.5 | 31.43 | 0.07 | 0.28 | 54163.1c | 18c | 4 | |||
| 2009jf | 55099.5 | 32.65 | 0.35 | 0.16 | 55120.0c | 20.5c | 5 | |||
| 2010O | 55203.7 | 33.26 | 0.05 | 2 | 55225c | 19c | 6,7 | |||
| 1993J | 49074.0 | 27.71 | 0.22 | 0.36 | 49094.5d | 20.5d | 7,8,9 | |||
| 2000H | - | 33.66 | 0.63 | 0.0 | 51586e | 7,10,11 | ||||
| 2008ax | 54528.8 | 29.92 | 0.07 | 1.17 | 54547.1e | 18.3e | 12 | |||
| 2010P | 55206.7 | 33.26 | 0.05 | 7 | 55228c | 21c | 6,7 | |||
| 2011dh | 55713.0 | 29.46 | 0.09 | 0.12 | 55733.8c | 20.8c | 13 |
a maximum.
b mag also possible according to Folatelli et al. (2006).
c maximum.
d Second maximum.
e maximum.
References: 1 Stritzinger et al. (2002); 2 Tominaga et al. (2005); 3 Folatelli et al. (2006); 4 Stritzinger et al. (2009);
The optical+NIR light curves were used to estimate the host galaxy line-of-sight extinction and evaluate the best-fitting extinction law towards SNe 2010O and 2010P. The BVRIJH light curves of SN 2010O and IJHK light curves of 2010P were compared to those of the Type Ib SN 2007Y (Stritzinger et al., 2009) and Type IIb SN 2011dh (Ergon et al., 2013), respectively. Light curves or templates of other CCSN types were not tried for the comparison, as the classification of the SNe based on optical spectroscopy and radio observations was considered to be robust. SN 2007Y was selected as the comparison template for SN 2010O as they are spectroscopically similar (see Section 4.3) and there are well sampled broad-band light curves available, covering SN 2007Y also around maximum light, including the crucial NIR region. The general transformations of Smith et al. (2002) were used to convert the r- and i-band magnitudes of SN 2007Y (Stritzinger et al., 2009) into Landolt (1992) system R- and I-band magnitudes for the comparison. SN 2011dh was selected as the comparison template for SN 2010P, as it has (i) the best sampled optical and NIR light curves available in the literature for any Type IIb event; and (ii) like SN 2010P, it does not show either a double-peaked shape in the light curves, nor strong H features in the post-maximum spectrum (see Section 4.4) unlike the prototypical Type IIb SN 1993J.
The light-curve comparisons were carried out as a -fitting between the observed and the template light curves similar to Kankare et al. (2012). Three free parameters were estimated, i.e. the epoch of the first detection from the explosion, V-band host galaxy extinction and a constant shift applied to the comparison light curves. All the light curves used in the comparison, in different wavebands, were fitted simultaneously to match those of the chosen template SN to derive the optimal set of parameters taking into account all the photometric data in a single fit to minimize the value. We emphasize that the same derived constant is applied to all bands of the template light curve, reflecting the difference in the absolute brightness between the SNe and possible errors in distances. The intrinsic colours of the comparison and reference SNe are assumed to be the same. As the parameter does not affect the colour of the compared SNe, it has negligible effect on the derived values for host galaxy extinction. Both and are tightly related to the observed colour of the SN and a minimum number of wavebands required for a reliable estimate of these parameters is three. By contrast, the epoch is defined mainly by the evolution of the light curves and to estimate the epoch of the first detection requires data over a long time frame. In this study we have multiple epochs of data, both pre- and post-maximum, covering SN 2010O in six and SN 2010P in four different bands over a broad wavelength range. Therefore, no degeneracy issues are present in the fitting process.
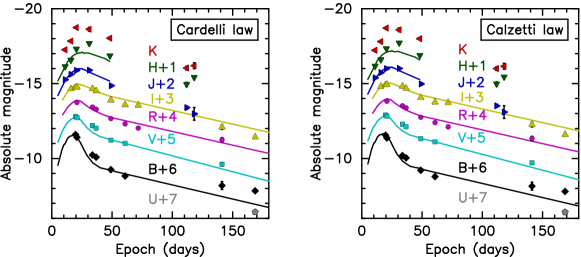
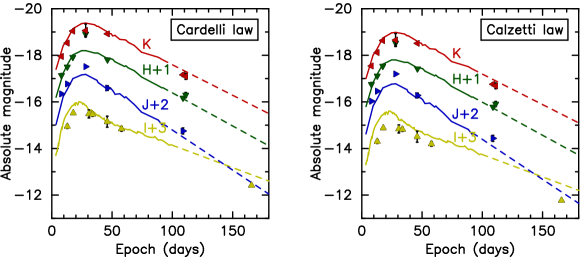
For Arp 299 we adopt a Galactic extinction of mag (Schlafly & Finkbeiner, 2011) and a luminosity distance of 44.8 Mpc corrected to the cosmic microwave background reference frame (Fixsen et al., 1996) corresponding to a distance modulus of ( km s-1 Mpc-1). Both the Cardelli, Clayton & Mathis (1989, ) and Calzetti et al. (2000, ) extinction laws were considered for the host galaxy extinction of SNe 2010O and 2010P. The Calzetti et al. (2000) extinction, or attenuation, curve is strictly speaking not applicable to a single point source, but since it is widely used to describe the dust properties of starburst galaxies in particular, and in the absence of a well-defined extinction law for LIRGs, we use it in comparison to the Cardelli et al. (1989) extinction law. For the Galactic extinction and host galaxy extinction of the comparison SNe, the Cardelli et al. (1989) extinction law was adopted. For a summary of the parameters of SNe used to compare with SN 2010O and SN 2010P photometrically and spectroscopically, see Table 6.
The -fitting provides reasonable matches between SN 2010O and SN 2007Y with both host galaxy extinction laws and suggests our NIR discovery of SN 2010O to have been roughly 11 d after the explosion (2010 January 7), SN 2010O to be 1.4 mag brighter than the low-luminosity Type Ib SN 2007Y and to be extinguished by mag of host galaxy extinction. The template comparison for SN 2010P suggests it to be discovered roughly 8 d after the explosion (2010 January 10), to be 1.4 mag brighter than SN 2011dh and to have a line-of-sight host galaxy extinction of 79 mag, depending on the adopted extinction law. The -fit values are reported in Table 7 and the absolute magnitude light curves of SNe 2010O and 2010P are shown in Figs 2 and 3 including also the template light curves (shifted with a constant ), that provided the best fit. We also note that the non-detections of SNe 2010O and 2010P in our ALTAIR/NIRI images of Arp 299 from 2009 December 3 and 5, respectively, are consistent with a relatively early discovery of the two SNe, though not providing strong constraints.
When adopting for SN 2010O the best -fit using the Cardelli et al. (1989) extinction law with mag, a line-of-sight extinction corrected colour (VR) mag is obtained roughly 14 d from the assumed V-band peak. This is in excellent agreement with the intrinsic colour of (VR) mag for Type Ib/c SNe on day 10 post V-band maximum, derived empirically by Drout et al. (2011).
| Extinction law | ||||
|---|---|---|---|---|
| (mag) | (d) | (mag) | ||
| SN 2010O | ||||
| Cardelli law | 1.9 | 11 | 33.3 | |
| Calzetti law | 2.0 | 11 | 25.2 | |
| SN 2010P | ||||
| Cardelli law | 9.0 | 8 | 23.4 | |
| Calzetti law | 6.8 | 8 | 40.6 |
4.2 Bolometric light curve of SN 2010O
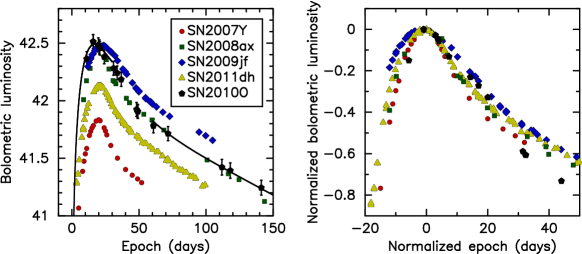
An interpolated pseudo-bolometric UBVRIJHK light curve of SN 2010O was created from available photometry assuming host galaxy extinction of mag and the Cardelli et al. (1989) extinction law. The U-band contribution of SN 2010O was estimated by upscaling the same bandpass magnitudes of SN 2007Y, based on the BVRIJH -comparison, as detailed in the previous section. The U-band magnitudes of SN 2007Y were converted from the Swift Ultraviolet/Optical Telescope observations reported by Brown et al. (2009) using the method presented by Li et al. (2006). The possible errors arising from this necessary approach of estimating the U-band contribution from a comparison SN can be assumed to be relatively small, as for Type Ib/c SNe, the total contribution of the UV is only 515 per cent of the total flux (Valenti et al., 2008). To derive the pseudo-bolometric light curve, fluxes from the extinction-corrected magnitudes were integrated over the filter functions and converted into luminosities.
To infer first-order estimates of the explosion parameters, kinetic energy , ejecta mass and 56Ni mass of SN 2010O we fitted to the bolometric light curve a simple model presented by Valenti et al. (2008) based on the work of Arnett (1982). For a full and detailed description of the model and its initial assumptions and assumed parameters, we refer to Valenti et al. (2008) and references therein, and provide only a short summary on the main features of the model here. The model fit for SN 2010O was carried out in two parts: one covering the photospheric phase of the SN (the initial 30 d), and a second one covering its nebular phase (from 60 d since the explosion and onwards). The fitting of the photospheric phase is based on the model of Arnett (1982) appropriate for Type I SNe, expanded by Valenti et al. (2008) to include not only the radioactive decay of 56Ni but also decay of 56Co. During the nebular phase the energy output of the SN is dominated by the radioactive decay of 56Co. In the work of Valenti et al. (2008) this energy output, taking into account the incomplete -ray and e+ trapping, is described by equations presented in Sutherland & Wheeler (1984), Cappellaro et al. (1997) and Clocchiatti & Wheeler (1997). The model takes into account the energy arising from -rays from 56Ni and 56Co decay and the annihilation of the e+ created in the cobalt decay, as well as the kinetic energy of these positrons (Valenti et al., 2008). The fitting to the bolometric light curve of SN 2010O was carried out including a two-component model of inner high-density and high-velocity ejecta and low-density outer ejecta following the photospheric bulk velocity at maximum luminosity, adopted from the Fe ii 5169 line velocity, see Section 4.3. In Fig. 4 the best model fit is shown together with a comparison of the pseudo-bolometric UBVRIJHK light curve of SN 2010O with a selection of other stripped-envelope SNe. The constant optical opacity of 0.06 cm2 g-1 was adopted in the fitting (Valenti et al., 2011). The method yields a rough estimate of erg, M☉ and M☉, with an inner ejecta contribution of erg, M☉ and M☉. The comparison in Fig. 4 shows the bolometric light curve of SN 2010O to be fairly similar to that of SN 2008ax for which Valenti et al. (2011) inferred relatively similar explosion parameters.
4.3 Spectroscopic results for SN 2010O
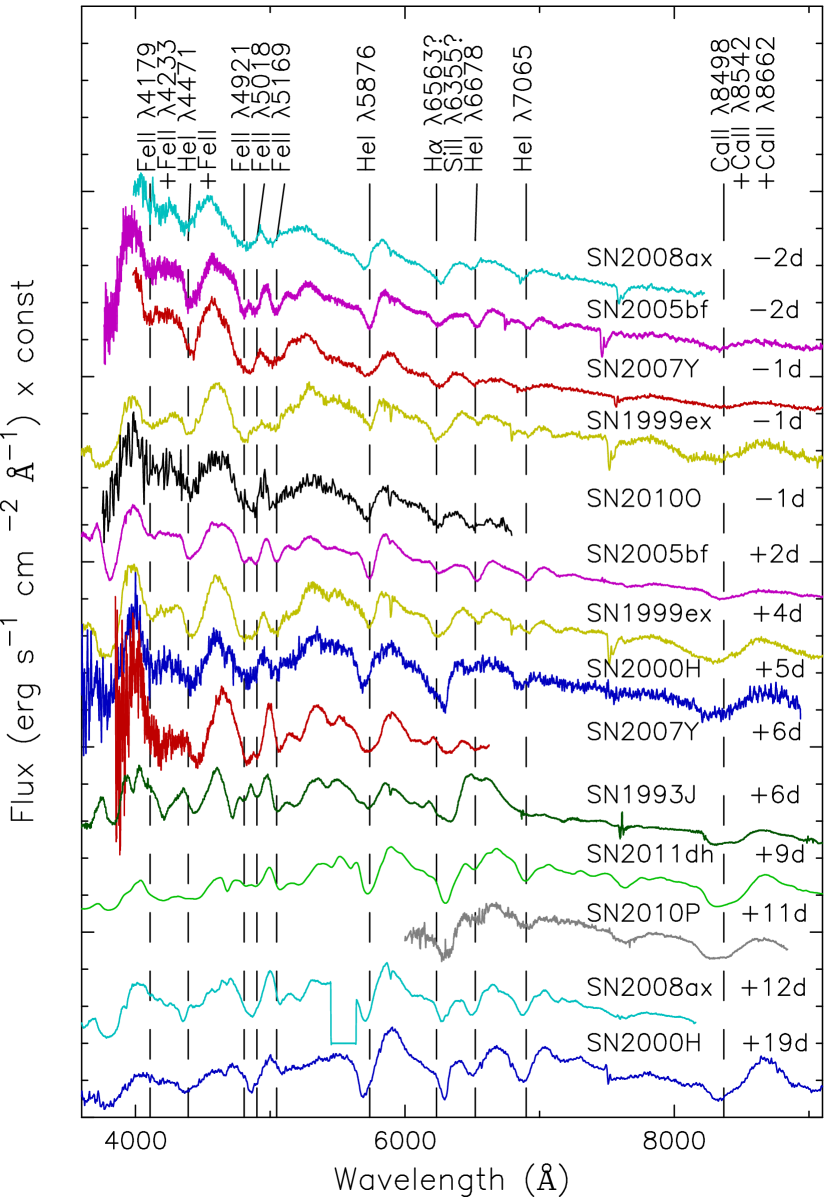
The optical classification spectrum of SN 2010O is similar to spectroscopically normal Type Ib events, such as SNe 1999ex (Hamuy et al., 2002), 2005bf (Folatelli et al., 2006) or 2007Y (Stritzinger et al., 2009), close to the maximum light. We do note that SN 2005bf was a peculiar SN with a slowly evolving double-peak optical light curve (Tominaga et al., 2005) and a slow rise to the maximum bolometric luminosity as late as day 42 from the inferred explosion date, which has been associated with a very asymmetric explosion (Folatelli et al., 2006). In the literature the spectra of SN 2005bf close in time to the first of the two light-curve peaks have been compared to normal Type Ib SNe close to maximum light (e.g. Folatelli et al., 2006). However, we suggest to place the classification spectrum of SN 2010O in a sequence of spectra around maximum luminosity of the Type Ib SNe 1999ex (Hamuy et al., 2002) and 2007Y (Stritzinger et al., 2009), as well as SN 2005bf, see Fig. 5. The spectrum comparison shows a coherent sequence of evolution supporting the epoch of the spectrum of SN 2010O to be close in time to the maximum bolometric luminosity. This is also quite consistent with the light-curve comparison with SN 2007Y, which suggested our first NIR detection to have taken place 11 d after the explosion. This would make the epoch of our optical spectrum to be 21 d from the explosion. For comparison, SN 2007Y peaked in luminosity roughly at day 18.
The dominant features in the classification spectrum of SN 2010O are helium and iron lines, in particular He i 4471, 5876, 6678 and Fe ii 4921, 5018, 5169 (see e.g. Hamuy et al., 2002; Anupama et al., 2005). In addition the feature at 4100 Å is likely a blend of Fe ii 4179, 4233 and the He i 4471 is possibly blended with multiple Fe ii lines. Other elements such as Mg ii and Ti ii may also be blended in some of the observed line features. We adopt the Fe ii 5169 line as the best tracer of the photospheric velocity, for which a Gaussian fit to the absorption minimum suggests a photospheric velocity 9000 km s-1 near the light-curve peak. He i lines in the spectrum of SN 2010O show somewhat lower velocities. In addition, the spectrum shows an absorption feature at 6240 Å which has also been observed in some other stripped-envelope SNe, spectroscopically also similar to SN 2010O, and has been associated e.g. with Si ii 6347, 6371, high-velocity H, a blend of these features or some other metals or their blends (e.g. Folatelli et al., 2006; Stritzinger et al., 2009, and references therein). In the case of SN 2005bf the feature was considered to arise, at least partly, from high-velocity, 15000 km s-1, H due to the similar high velocity of the feature associated with H and lines clearly identified as Ca ii (see e.g. the discussions of Folatelli et al., 2006; Parrent et al., 2007; Stritzinger et al., 2009). If associated with Si ii the line velocity of the feature would be roughly 6000 km s-1 and thus slower than the inferred photospheric velocity, though we note that this is not impossible. As noted above, the spectrum of SN 2010O is very similar to that of SN 2005bf close to the peak. If the feature in SN 2010O is associated with high-velocity H, at 15000 km s-1, this would indicate that at least a small amount of hydrogen was still present in the outer envelope of the progenitor. Unfortunately our spectrum does not cover the Ca ii NIR triplet for further comparison of the velocities.
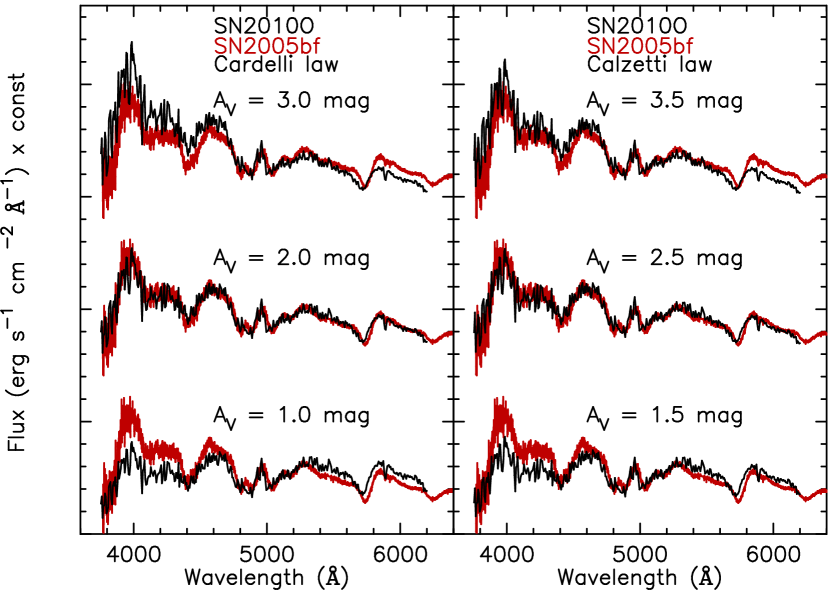
Because of the striking similarity between the classification spectrum of SN 2010O and the spectra of SN 2005bf at the time of the maximum luminosity a more detailed comparison was carried out with different applied host galaxy extinctions and two extinction laws, those of Cardelli et al. (1989) and Calzetti et al. (2000). The spectrum of SN 2010O, shifted in the rest wavelength, was dereddened with extinction in the range of A 010 mag in steps of 0.1 mag. The dereddened spectra were scaled to the spectrum of SN 2005bf (dereddened with the extinction law of Cardelli et al., 1989) and subtracted from this reference spectrum. The standard deviation of the subtraction was used as a measure of the quality of the fit and the minimum value was assumed to infer the optimal host galaxy extinction yielding or mag assuming the Cardelli et al. (1989) or Calzetti et al. (2000) extinction laws, respectively. The best comparison and cases with 1 mag of extinction for reference are shown in Fig. 6. Part of the spectrum, redwards from 6200 Å, has been omitted from the comparison due to the second-order effect, caused by the ALFOSC grism #7, which was used to obtain the classification spectrum of SN 2010O. We conclude that the BVRIJH light-curve comparison and the optical spectrum comparison are both consistent and favour the line-of-sight host galaxy extinction for SN 2010O to be mag and to follow the Cardelli et al. (1989) extinction law. We note that the spectra of SNe 2010O and 2010P (Section 4.4) are compared to reference SNe with quite small estimated host galaxy line-of-sight extinctions ( mag). Any errors that these extinction estimates might have are additive to the inferred results. Compared to the high line-of-sight extinctions of the two SNe in Arp 299 that are studied here, these errors are expected to be very small.
The second spectrum of SN 2010O was obtained 51 d after the classification spectrum. The extended wavelength range reveals also the detection of the He i 7065 feature not covered by the first spectrum. He i 5876 is also visible, possibly blended with Na i 5890, 5896 doublet. The spectrum also reveals Ca ii NIR triplet, the O i 7774 feature and the semiforbidden Ca ii] 7291, 7324 doublet. The spectrum still shows some continuum; however, the onset of the latter features is indicating that the SN is moving towards the nebular phase. Similarly, very tentatively the forbidden [O i] 6300, 6364 can be detected in SN 2010O, arising from the ejecta synthesized in the SN explosion. The spectrum is shown in Fig. 7 with the most prominent features identified.

4.4 Spectroscopic results for SN 2010P
The spectrum of SN 2010P was already shown in Mattila et al. (2012) as a part of an investigation of the missing fraction of SNe in LIRGs. In Section 4.1 the discovery date of SN 2010P was inferred to be only 8 d after the explosion when comparing the light curves of SN 2010P to those of SN 2011dh. Based on this, the epoch of the spectrum corresponds to roughly 12 d after the bolometric maximum of SN 2011dh, quite consistent with the spectral evolution of several Type Ib/IIb SNe, as was shown in Fig. 5. Part of the SN 2010P spectrum, bluewards from 6000 Å, was omitted from the analysis due to unreliable relative flux calibration. The spectrum shows a Ca ii NIR triplet blend, He i 7065 line and a weak H feature, similar to such Type IIb SNe as 2000H, 2008ax and 2011dh.
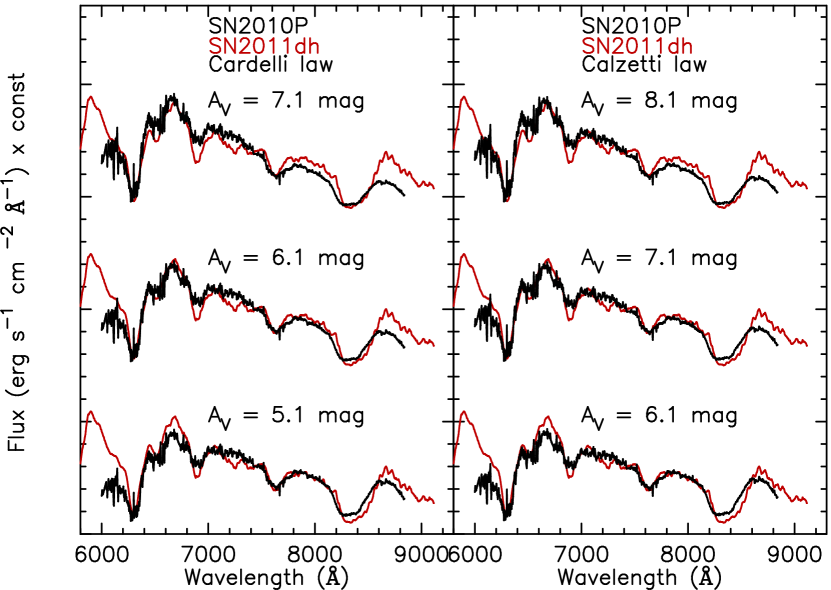
Similar to the analysis of SN 2010O, a comparison between the dereddened spectra of SN 2010P with the reference spectrum of SN 2011dh at a similar epoch was carried out. The method yielded an estimate of or mag for the host galaxy extinction of SN 2010P assuming the Cardelli et al. (1989) or Calzetti et al. (2000) extinction laws, respectively. The comparison is shown in Fig. 8. Between the light-curve and spectrum comparisons of SN 2010P there is a clear discrepancy in the derived extinctions if the Cardelli et al. (1989) extinction law is adopted. However, if the Calzetti et al. (2000) extinction law is adopted, even though it provides a worse fit in the I band, the derived results from the light-curve and the spectrum comparisons are in fact in pretty good agreement, even if the methods and wavelength regions probed are quite different. To conclude, we favour a host galaxy extinction of roughly 7 mag in V band for SN 2010P and that the line-of-sight extinction law is following that of Calzetti et al. (2000). The derived extinction is also consistent, though slightly higher, than the initial estimate of Mattila et al. (2012) and does not affect their results.
4.5 Na i D features
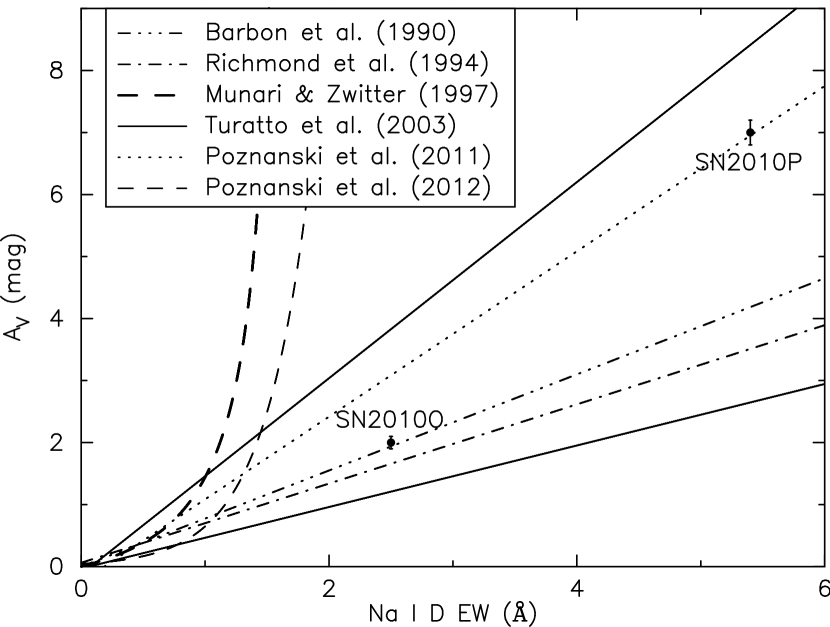
A commonly used method of estimating the host galaxy line-of-sight extinction to SNe is to measure the equivalent width (EW) of the Na i 5890, 5896 doublet and apply an empirical relation inferred between extinction and the Na i D EW. However, recently Poznanski et al. (2011) argued, based on a sample of hundreds of low-resolution Type Ia SN spectra, that no strong correlation exists between the extinction and the EW measured for Na i D. Nonetheless, the method is widely used to give an estimate for CCSNe in the absence of a superior method. To carry out a comparison to our host galaxy extinction estimates, Gaussian components (with the same FWHM) were fitted to both the Na i D1 and D2 absorption features in the spectra of SNe 2010O and 2010P, using the spectool task in iraf. This yielded EW(D Å and EW(D Å for SN 20100 and EW(D Å and EW(D Å for SN 2010P. Unreliable relative flux calibration of SN 2010P bluewards from 6000 Å does not prevent measuring Na i D EW as it is normalized with the continuum. Following for example the commonly used relations of Turatto, Benetti & Cappellaro (2003) with the Cardelli et al. (1989) extinction law, this suggests a host galaxy extinction of mag (or mag with the steeper relation) and mag (or mag) for SN 2010O and SN 2010P, respectively. Both estimates for both SNe are in discrepancy with our previously derived values for the host galaxy line-of-sight extinction.
A selection of empirical Na i D EW versus relations is plotted in Fig. 9 together with our derived results for SNe 2010O and 2010P. The relations of Barbon et al. (1990), Turatto et al. (2003) and Poznanski et al. (2011) are based on SN data, whereas Richmond et al. (1994) and Munari & Zwitter (1997) make use of stellar spectra, and Poznanski, Prochaska & Bloom (2012) use the spectra of galaxies. In particular, the logarithmic relations would suggest unrealistically high extinctions for SNe 2010O and 2010P based on the Na i D EW measurements. However, none of the empirical relations is unambiguously consistent with both SNe, at least when using low-resolution spectra. This is likely reflecting the large intrinsic scatter in such relations and can be related to the non-negligible saturation effect of the Na i D lines (Sollerman et al., 2005). Overall this suggests that, especially with high host galaxy extinctions, broad wavelength range light-curve and spectroscopic comparisons, as carried out here, are likely to provide much more robust estimates of the reddening than the methods based on the usage of Na i D EW. In particular, high-resolution NIR observations have already been shown to be crucial when investigating host galaxy extinctions for SNe that explode in highly obscured ( mag) environments Kankare et al., 2008, SN 2008cs,; Mattila et al., 2013, SN 2008iz,.
5 Pre-explosion imaging
Whilst there have been numerous successful identifications of the progenitors of CCSNe in archival images (see Smartt, 2009, for a review), this has typically only been accomplished for very nearby SNe ( Mpc). The distance of Arp 299 (44.8 Mpc) and the high extinction towards SNe 2010O and 2010P ( and 7 mag, respectively) make the identification of a progenitor candidate in this instance unlikely. Nonetheless, we discuss below the available pre-explosion archival data taken with the HST.
5.1 SN 2010O
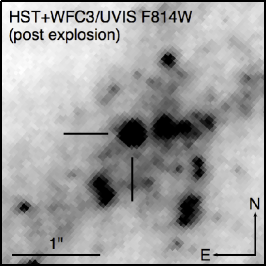
The pipeline drizzled pre-explosion Advanced Camera for Surveys (ACS) Wide Field Channel (WFC) F814W image (0.050 arcsec pixel-1) taken on 2006 March 19 (archive file name j9cv38020_drc, programme GO-10592, PI: A. Evans) was aligned to the post-explosion WFC3/UVIS F814W image (0.040 arcsec pixel-1) taken on 2010 June 24 (archive file name ibfz01030_drz, programme GO-12295, PI: H. Bond). We identified 21 point-like sources common to both frames and within a 12-arcsec radius of the SN position, and measured their pixel coordinates. The matched pixel coordinates in each image were then used to derive a geometric transformation using iraf geomap, with an rms error of only 8 mas (0.16 pixels). The pixel coordinates of the SN were then measured in the post-explosion image using the three centring algorithms (Gaussian, centroid and ofilter) within iraf phot; the average was taken as the SN position, and the standard deviation (2 mas) was taken as the uncertainty. Transforming the measured SN coordinates to the pre-explosion image, we do not find a point source coincident with the SN, although we find a source offset by 35 mas (0.69 pixels) as shown in Fig. 10. This offset is larger than the sum of all uncertainties of the measurements, and at the distance of Arp 299 corresponds to 8 pc.
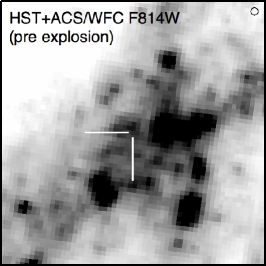
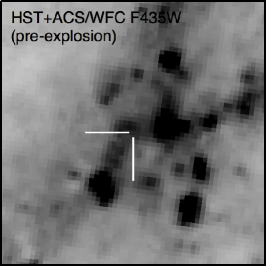
The source is clearest in the F814W image (approximately corresponding to I band), and we measure a magnitude in the VEGAMAG system of mag using the dolphot package (dolphot is a modified version of the hstphot package; Dolphin, 2000). Photometry was performed on the _flc files, which have been corrected for charge-transfer efficiency (CTE) losses, but have not been drizzled. The value returned by dolphot () indicates that the source was not particularly well fit by with a PSF, while the sharpness parameter () is consistent with a slightly extended source. We do not see an obvious corresponding source in the F435W-filter image taken at the same epoch (Fig. 10). We also examined the multiple Wide-Field and Planetary Camera 2 (WFPC2) images which covered the site of SN 2010O, but as these were of inferior resolution and depth to the ACS data they have not been considered any further here.
For the distance modulus and line-of-sight extinction towards SN 2010O ( mag, mag), the nearby source has an absolute magnitude of . This is too bright to be a single star. For instance, if adopting a bolometric correction of 0, this corresponds to a luminosity of dex; for comparison the progenitor of SN 2011dh had a luminosity of dex (Maund et al., 2011). It is possible that the source is a cluster with which SN 2010O is physically associated. However, given the distance to Arp 299 and the crowded nature of the region, it is impossible to make this determination with any confidence. We hence conclude that there is no point-like source coincident with SN 2010O, but that this is not surprising given the distance and extinction. Hence we do not set any strong limits on the progenitor luminosity.
5.2 SN 2010P
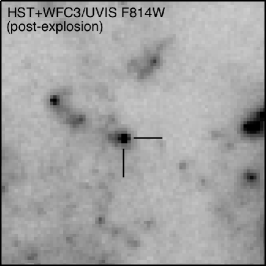
SN 2010P suffers from even higher extinction than SN 2010O ( mag), which together with the distance of Arp 299 makes any search for a progenitor at optical wavelengths futile. We have hence only considered the NIR data in the HST archive, which consists of a 600-s observation taken with the Near Infrared Camera and Multi-Object Spectrometer (NICMOS) using the NIC2 camera (0.075 arcsec pixel-1) and the F160W filter (approximately corresponding to H band), taken on 2003 September 1 (data set n8n716010, snapshot programme GO-9726, PI: R. Maiolino).
Using the same procedure as for SN 2010O, we find a position of SN 2010P in the NIC2 F160W image with an uncertainty of 8 mas, as shown in Fig. 11. The transformed position is offset by 0.7 pixels (35 mas) from a nearby source. The SN is formally not coincident with this source, although as in the case of SN 2010O, it is possible that the source is a cluster with which the progenitor of SN 2010P was associated. We performed aperture photometry on the source using a small aperture within iraf, and using the appropriate photometric calibration from the STScI webpages,999http://www.stsci.edu/hst/nicmos/performance/photometry/postncs_keywords.html along with aperture corrections derived using tiny tim,101010http://tinytim.stsci.edu we measure a magnitude for the source of mag in the AB system. The absolute magnitude ( mag) is too bright to be a single massive star, leaving open the possibility that it is a cluster or complex.
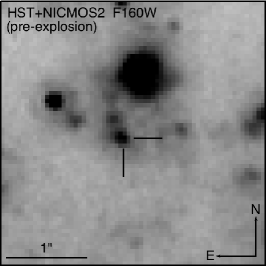
To conclude, both SN 2010O and SN 2010P are close, but not coincident with bright sources. In both cases, these sources are probably clusters or complexes. They are too bright to be single stars, but rather have typical luminosities of super star clusters in such galaxies (Randriamanakoto et al., 2013). These clusters are typically young with ages of a few Myr, and hence very plausible sites for massive CCSNe. However, since we do not know the exact characteristics of the cluster candidates in question here, nor whether they are with any certainty physically related to SNe 2010O and 2010P, we can infer no information on the progenitors of either SN from these results.
6 Discussion
SN 2010O appears to be photometrically and spectroscopically a normal Type Ib SN. A fast decline rate after the light-curve peak suggests that not all the -rays are trapped in the ejecta, which is typical for Type Ib/c SNe. The physical parameters, erg, M☉ and M☉, inferred for explosion of SN 2010O, would suggest, assuming a single progenitor, a rough zero-age main-sequence mass of 2025 M☉ (see e.g. Mazzali et al., 2009) which has lost its outer hydrogen envelope via stellar winds. In the case of a binary system, as suggested for SN 2010O also by Nelemans et al. (2010), where the outer envelope stripping of the progenitor star would take place via Roche-lobe overflow (Podsiadlowski, Joss & Hsu, 1992), the progenitor mass can be expected to be smaller.
Already during post-maximum, some Type IIb and Type Ib SNe do not show significant spectroscopic differences, especially as many Type Ib SNe can in fact show some weak signs of hydrogen in their spectra. The spectrum of SN 2010P, obtained roughly 11 d after the peak, is found to be spectroscopically very similar to such Type IIb events as SNe 2000H, 2008ax and 2011dh. All the above mentioned SNe do not show strong hydrogen features anymore a few days after the peak and relatively low (0.1 M☉) hydrogen masses have been inferred for them (Elmhamdi et al., 2006; Chornock et al., 2011; Bersten et al., 2012). The IJHK light curves of SN 2010P do not show any signs of a double peaked maximum, however, it might be that we lack observations obtained very early and in the UV region for a clear detection of this effect. Nonetheless, the Type IIb SN 1993J, which also shows more prominent hydrogen features at comparable epochs to the spectrum of SN 2010P and has been associated with higher hydrogen mass (Elmhamdi et al., 2006) does show a clear double-peaked light curve. The rise to the first initial light-curve peak is associated with shock heating of the extended low-mass hydrogen envelope followed by a declining light curve and recombination of the ionized hydrogen analogous to Type IIP SNe (e.g. Shigeyama et al., 1994). Therefore, the weak hydrogen features in the spectrum and the lack of this early light-curve evolution suggest that SN 2010P was not an extreme case of Type IIb SNe with a relatively high mass of the outer hydrogen envelope, but instead had a hydrogen mass of 0.1 M☉ and a more compact progenitor. Claeys et al. (2011) placed a hydrogen mass lower limit of 0.1 M☉ for Type IIb SNe, which would classify SN 2010P as a Type Ib SN; however, the late-time radio observations (Paper II) rule out a Type Ib origin of SN 2010P and we consider the object to be a Type IIb event. Interestingly, the very long rise time of hundreds of days to the radio maximum shown by SN 2010P (Paper II) is empirically expected to occur with Type IIb SNe with much extended ( cm) envelopes with hydrogen mass of M☉ (Chevalier & Soderberg, 2010) rather than compact ( cm) progenitors. However, we note that the case of SN 2010P could be somewhat analogous to SN 2011dh, for which a combination of analysis of high-resolution pre-explosion imaging and hydrodynamical modelling of the light curves has suggested a consistent model with an extended ( cm) progenitor with a modest mass of hydrogen (Maund et al., 2011; Van Dyk et al., 2011; Bersten et al., 2012; Benvenuto, Bersten & Nomoto, 2013), even when e.g. the early-time light curve has suggested a more compact progenitor (e.g. Arcavi et al., 2011). However, the rise time of SN 2011dh to the maximum luminosity in radio wavelengths was relatively fast and happened in a few tens of days (Soderberg et al., 2012), unlike in the case of SN 2010P (Paper II). Furthermore, recent results of the Type IIb SN 2011hs (Bufano et al., 2013) have found also a discrepancy between the radio and optical observations, inferring a compact or extended progenitor, respectively. SNe 2010P, 2011dh and 2011hs are therefore examples of transients which suggest that the relation between radio rise time and the progenitor nature of Type IIb SNe is more complex than previously thought.
The early NIR and optical observations of SN 2010P did not show any obvious signs of ejecta–CSM interaction and the early radio observations yielded non-detections. However, after a long observational gap, at age 1.4 yr from the explosion, the radio luminosity of SN 2010P (Paper II) reveals that the ejecta is interacting with a CSM, suggesting that the progenitor experienced episodic mass loss at the end of its life cycle. We note that recent modelling results have suggested that some 20 M☉ stars could explode as Type IIb SNe and experience variability in their mass-loss rate due to crossing the bistability limit shortly before the core-collapse, resulting in modulations in their radio light curve (see Moriya, Groh & Meynet, 2013, and references therein), consistent with the radio observations of SN 2010P. Furthermore, radio light-curve modulations have been observed in the follow-up of some compact Type IIb SNe, such as e.g. SNe 2001ig (Ryder et al., 2004), 2003bg (Soderberg et al., 2006b), 2008ax (Roming et al., 2009) and 2011ei (Milisavljevic et al., 2013), see also the discussions in Kotak & Vink (2006). However, such observations have not shown as late re-brightening in radio wavelengths as the peak time observed for SN 2010P.
7 Conclusions
Based on the analysis of both NIR light curves and optical spectroscopy we find consistent results for the explosion date, SN type, line-of-sight host galaxy extinction and the extinction laws in Arp 299 for both SNe 2010 and 2010P. We find both events to be stripped-envelope SNe and to have exploded by chance very close in time to one another, within only a few days. A simple model for the bolometric light curve of SN 2010O yields a very rough estimate for the SN explosion parameters of erg, M☉ and M☉, suggesting either a 2025 M☉ single progenitor star or possibly a less massive progenitor in a binary system. The reported optical/NIR observations indicate a compact progenitor with a modest amount of hydrogen for SN 2010P, whereas the radio observations (presented in Paper II) with a long rise time to the radio peak suggest an extended progenitor for the SN. Such a discrepancy indicates that the radio rise time and the progenitor nature relation of Type IIb SNe is more complex than previously suggested. The study of high-resolution pre-explosion images of Arp 299 reveals both SNe to be close to, but not coincident, with extended sources that are likely massive and possibly blended clusters. Because of the distance and high host galaxy extinction, no further constraints on the progenitors are possible based on pre-explosion data.
Based on both light-curve and spectroscopic comparisons we derive host galaxy extinctions of and mag for SNe 2010O and 2010P, respectively. The Cardelli et al. (1989) extinction law is found to be the best choice to describe the host galaxy line-of-sight extinction to SN 2010O in the spiral arm of the A component of Arp 299, whereas in the case of SN 2010P the Calzetti et al. (2000) extinction law is found to be more consistent with the observations. The latter extinction law is thus found to better describe the dust properties of the IR bright C nucleus of Arp 299. Future SN discoveries, with multiwavelength follow-up observations, in the nuclear regions of the major components of Arp 299 could be used to independently map the extinction properties of this prototypical LIRG and to study its SN population. This is a strong motivation for high-resolution IR searches of CCSNe in the high SN rate LIRGs such as Arp 299.
Acknowledgements
We thank the anonymous referee for very useful comments. We thank Mattias Ergon for providing the spectrum of SN 2011dh for our comparison. EK acknowledges financial support from the Jenny and Antti Wihuri Foundation. SM and CR-C acknowledge support from the Academy of Finland (Project 8120503). AP is partially supported by the PRIN-INAF 2011 with the project ‘Transient Universe: from ESO Large to PESSTO’. NE-R acknowledges financial support by the MICINN grant AYA2011-24704/ESP, by the ESF EUROCORES Program EuroGENESIS (MINECO grants EUI2009-04170) and by the European Union Seventh Framework Programme (FP7/2007-2013) under grant agreement no 267251. CR-C acknowledges financial support from the ALMA-CONICYT FUND Project 31100004. AA, RH-I and M-AP-T acknowledge support from the Spanish MINECO Projects AYA2009-13036-CO2-01 and AYA2012-38491-C02-02, cofunded with FEDER funds. This work was partly supported by the European Union FP7 programme through ERC grant number 320360.
Based on observations obtained at the Gemini Observatory, which is operated by the Association of Universities for Research in Astronomy, Inc., under a cooperative agreement with the NSF on behalf of the Gemini partnership: the National Science Foundation (United States), the National Research Council (Canada), CONICYT (Chile), the Australian Research Council (Australia), Ministério da Ciência, Tecnologia e Inovação (Brazil) and Ministerio de Ciencia, Tecnología e Innovación Productiva (Argentina).
Some of the data presented in this paper were obtained from the Mikulski Archive for Space Telescopes (MAST). STScI is operated by the Association of Universities for Research in Astronomy, Inc., under NASA contract NAS5-26555. Support for MAST for non-HST data is provided by the NASA Office of Space Science via grant NNX13AC07G and by other grants and contracts.
This paper is based on observations made with the Nordic Optical Telescope, operated on the island of La Palma jointly by Denmark, Finland, Iceland, Norway and Sweden, in the Spanish Observatorio del Roque de los Muchachos of the Instituto de Astrofisica de Canarias.
The Liverpool Telescope is operated on the island of La Palma by Liverpool John Moores University in the Spanish Observatorio del Roque de los Muchachos of the Instituto de Astrofisica de Canarias with financial support from the UK Science and Technology Facilities Council.
This paper makes use of data obtained from the Isaac Newton Group Archive which is maintained as part of the CASU Astronomical Data Centre at the Institute of Astronomy, Cambridge.
This research has made use of the NASA/IPAC Extragalactic Database (NED) which is operated by the Jet Propulsion Laboratory, California Institute of Technology, under contract with the National Aeronautics and Space Administration.
We have made use of the Weizmann interactive supernova data repository (www.weizmann.ac.il/astrophysics/wiserep).
References
- Alard (2000) Alard C., 2000, A&AS, 144, 363
- Alard & Lupton (1998) Alard C., Lupton R. H., 1998, ApJ, 503, 325
- Anderson et al. (2011) Anderson J. P., Habergham S. M., James P. A., 2011, MNRAS, 416, 567
- Anupama et al. (2005) Anupama G. C., Sahu D. K., Deng J., Nomoto K., Tominaga N., Tanaka M., Mazzali P. A., Prabhu T. P., 2005, ApJ, 631, L125
- Arcavi et al. (2011) Arcavi I. et al., 2011, ApJ, 742, L18
- Arnett (1982) Arnett W. D., 1982, ApJ, 253, 785
- Barbon et al. (1990) Barbon R., Benetti S., Rosino L., Cappellaro E., Turatto M., 1990, A&A, 237, 79
- Barbon et al. (1995) Barbon R., Benetti S., Cappellaro E., Patat F., Turatto M., Iijima T., 1995, A&AS, 110, 513
- Benvenuto et al. (2013) Benvenuto O. G., Bersten M. C., Nomoto K., 2013, ApJ, 762, 74
- Bersten et al. (2012) Bersten M. C. et al., 2012, ApJ, 757, 31
- Beswick et al. (2010) Beswick R. J., Perez-Torres M. A., Mattila S., Garrington S. T., Kankare E., Ryder S., Alberdi A., Romero-Canizales C. et al., 2010, Astron. Telegram, 2432, 1
- Bond et al. (2010) Bond, H. E. et al., 2010, Astron. Telegram, 2422, 1
- Bond et al. (2011) Bond, H. E. et al., 2011, BAAS, 43, #337.18
- Bondi et al. (2012) Bondi M., Pérez-Torres M. A., Herrero-Illana R., Alberdi A., 2012, A&A, 539, A134
- Branch et al. (2002) Branch D. et al., 2002, ApJ, 566, 1005
- Brown et al. (2009) Brown P. J. et al., 2009, AJ, 137, 4517
- Bufano et al. (2013) Bufano F. et al., 2013, MNRAS, submitted
- Calzetti et al. (2000) Calzetti D., Armus L., Bohlin R. C., Kinney A. L., Koornneef J., Storchi-Bergmann T., 2000, ApJ, 533, 682
- Cappellaro et al. (1997) Cappellaro E., Mazzali P. A., Benetti S., Danziger I. J., Turatto M., della Valle M., Patat F., 1997, A&A, 328, 203
- Cardelli et al. (1989) Cardelli J. A., Clayton G. C., Mathis J. S., 1989, ApJ, 345, 245
- Chevalier & Soderberg (2010) Chevalier R. A., Soderberg A. M., 2010, ApJ, 711, L40
- Chornock et al. (2011) Chornock R. et al., 2011, ApJ, 739, 41
- Claeys et al. (2011) Claeys J. S. W., de Mink S. E., Pols O. R., Eldridge J. J., Baes M., 2011, A&A, 528, A131
- Clocchiatti & Wheeler (1997) Clocchiatti A., Wheeler J. C., 1997, ApJ, 491, 375
- Della Ceca et al. (2002) Della Ceca R. et al., 2002, ApJ, 581, L9
- Dessart et al. (2012) Dessart L., Hillier D. J., Li C., Woosley S., 2012, MNRAS, 424, 2139
- Djupvik & Andersen (2010) Djupvik A. A., Andersen J., 2010, in Diego J. M., Goicoecha L. J., González-Serrano J. I., Gorgas J., eds, Astrophys. Space Sci. Proc., Highlights of Spanish Astrophysics V. Springer-Verlag, Berlin, p. 211
- Dolphin (2000) Dolphin A. E., 2000, PASP, 112, 1383
- Drout et al. (2011) Drout M. R. et al., 2011, ApJ, 741, 97
- Eldridge et al. (2013) Eldridge J. J., Fraser M., Smartt S. J., Maund J. R., Crockett R. M., 2013, MNRAS, 436, 774
- Elmhamdi et al. (2006) Elmhamdi A., Danziger I. J., Branch D., Leibundgut B., Baron E., Kirshner R. P., 2006, A&A, 450, 305
- Ergon et al. (2013) Ergon M. et al., 2013, A&A, in press (arXiv:1305.1851)
- Fixsen et al. (1996) Fixsen D. J., Cheng E. S., Gales J. M., Mather J. C., Shafer R. A., Wright E. L., 1996, ApJ, 473, 576
- Folatelli et al. (2006) Folatelli G. et al., 2006, ApJ, 641, 1039
- Gehrz et al. (1983) Gehrz R. D., Sramek R. A., Weedman D. W., 1983, ApJ, 267, 551
- Habergham et al. (2010) Habergham S. M., Anderson J. P., James P. A., 2010, ApJ, 717, 342
- Habergham et al. (2012) Habergham S. M., James P. A., Anderson J. P., 2012, MNRAS, 424, 2841
- Hamuy et al. (2002) Hamuy M. et al., 2002, AJ, 124, 417
- Hawarden et al. (2001) Hawarden T. G., Leggett S. K., Letawsky M. B., Ballantyne D. R., Casali M. M., 2001, MNRAS, 325, 563
- Herrero-Illana et al. (2012) Herrero-Illana R., Romero-Canizales C., Perez-Torres M. A., Alberdi A., Kankare E., Mattila S., Ryder S. D., 2012, Astron. Telegram, 4432, 1
- Hodapp et al. (2003) Hodapp K. W. et al., 2003, PASP, 115, 1388
- Hook et al. (2004) Hook I. M., Jørgensen I., Allington-Smith J. R., Davies R. L., Metcalfe N., Murowinski R. G., Crampton, D., 2004, PASP, 116, 425
- Huo et al. (2004) Huo Z. Y., Xia X. Y., Xue S. J., Mao S., Deng Z. G., 2004, ApJ, 611, 208
- Kangas et al. (2013) Kangas T., Mattila S., Kankare E., Kotilainen J. K., Väisänen P., Greimel R., Takalo A., 2013, MNRAS, 436, 3464
- Kankare et al. (2008) Kankare E. et al., 2008, ApJ, 689, L97
- Kankare et al. (2012) Kankare E. et al., 2012, ApJ, 744, L19
- Kotak & Vink (2006) Kotak R., Vink J. S., 2006, A&A, 460, L5
- Landolt (1992) Landolt A. U., 1992, AJ, 104, 340
- Leggett et al. (2006) Leggett S. K. et al., 2006, MNRAS, 373, 781
- Lewis et al. (1994) Lewis J. R. et al., 1994, MNRAS, 266, L27
- Li et al. (2006) Li W., Jha S., Filippenko A. V., Bloom J. S., Pooley D., Foley R. J., Perley D. A., 2006, PASP, 118, 37
- Massey et al. (1988) Massey P., Strobel K., Barnes J. V., Anderson E., 1988, ApJ, 328, 315
- Mattila & Kankare (2010) Mattila S., Kankare E., 2010, Cent. Bureau Electron. Telegrams, 2145, 1
- Mattila & Meikle (2001) Mattila S., Meikle W. P. S., 2001, MNRAS, 324, 325
- Mattila et al. (2010) Mattila S., Kankare E., Datson J., Pastorello A., 2010, Cent. Bureau Electron. Telegrams, 2149, 1
- Mattila et al. (2012) Mattila S. et al., 2012, ApJ, 756, 111
- Mattila et al. (2013) Mattila S., Fraser M., Smartt S. J., Meikle W. P. S., Romero-Cañizales C., Crockett R. M., Stephens A., 2013, MNRAS, 431, 2050
- Maund et al. (2011) Maund J. R. et al., 2011, ApJ, 739, L37
- Mazzali et al. (2009) Mazzali P. A., Deng J., Hamuy M., Nomoto K., 2009, ApJ, 703, 1624
- Milisavljevic et al. (2013) Milisavljevic D. et al., 2013, ApJ, 767, 71
- Moriya et al. (2013) Moriya T. J., Groh J. H., Meynet G., 2013, A&A, 557, L2
- Munari & Zwitter (1997) Munari U., Zwitter T., 1997, A&A, 318, 269
- Nelemans et al. (2010) Nelemans G., Voss R., Nielsen M. T. B., Roelofs G., 2010, MNRAS, 405, L71
- Newton et al. (2010) Newton J., Puckett T., Orff T., 2010, Cent. Bureau Electron. Telegrams, 2144, 2
- Parrent et al. (2007) Parrent J. et al., 2007, PASP, 119, 135
- Pastorello et al. (2008) Pastorello A. et al., 2008, MNRAS, 389, 955
- Pérez-Torres et al. (2009) Pérez-Torres M. A., Romero-Cañizales C., Alberdi A., Polatidis A., 2009, A&A, 507, L17
- Pérez-Torres et al. (2010) Pérez-Torres M. A., Alberdi A., Romero-Cañizales C., Bondi M., 2010, A&A, 519, L5
- Podsiadlowski et al. (1992) Podsiadlowski P., Joss P. C., Hsu J. J. L., 1992, ApJ, 391, 246
- Portegies Zwart et al. (2010) Portegies Zwart S. F., McMillan S. L. W., Gieles M., 2010, ARA&A, 48, 431
- Poznanski et al. (2011) Poznanski D., Ganeshalingam M., Silverman J. M., Filippenko A. V., 2011, MNRAS, 415, L81
- Poznanski et al. (2012) Poznanski D., Prochaska J. X., Bloom J. S., 2012, MNRAS, 426, 1465
- Randriamanakoto et al. (2013) Randriamanakoto Z., Väisänen P., Ryder S., Kankare E., Kotilainen J., Mattila S., 2013, MNRAS, 431, 554
- Richmond et al. (1994) Richmond M. W., Treffers R. R., Filippenko A. V., Paik Y., Leibundgut B., Schulman E., Cox C. V., 1994, AJ, 107, 1022
- Romero-Cañizales et al. (2011) Romero-Cañizales C., Mattila S., Alberdi A., Pérez-Torres M. A., Kankare E., Ryder S. D., 2011, MNRAS, 415, 2688
- Romero-Cañizales et al. (2014) Romero-Cañizales C. et al., 2014, MNRAS, 440, 1067 (Paper II)
- Roming et al. (2009) Roming P. W. A. et al., 2009, ApJ, 704, L118
- Ryder et al. (2004) Ryder S. D., Sadler E. M., Subrahmanyan R., Weiler K. W., Panagia N., Stockdale C., 2004, MNRAS, 349, 1093
- Ryder et al. (2010) Ryder S., Mattila S., Kankare E., Perez-Torres M., 2010, Cent. Bureau Electron. Telegrams, 2189, 1
- Sanders et al. (2003) Sanders D. B., Mazzarella J. M., Kim D.-C., Surace J. A., Soifer B. T., 2003, AJ, 126, 1607
- Schlafly & Finkbeiner (2011) Schlafly E. F., Finkbeiner D. P., 2011, ApJ, 737, 103
- Shigeyama et al. (1994) Shigeyama T., Suzuki T., Kumagai S., Nomoto K., Saio H., Yamaoka H., 1994, ApJ, 420, 341
- Smartt (2009) Smartt S.J., 2009, ARA&A, 47, 63
- Smith et al. (2002) Smith J. A. et al., 2002, AJ, 123, 2121
- Soderberg et al. (2006a) Soderberg A. M., Nakar E., Berger E., Kulkarni S. R., 2006a, ApJ, 638, 930
- Soderberg et al. (2006b) Soderberg A. M., Chevalier R. A., Kulkarni S. R., Frail D. A., 2006b, ApJ, 651, 1005
- Soderberg et al. (2012) Soderberg A. M. et al., 2012, ApJ, 752, 78
- Sollerman et al. (2005) Sollerman J., Cox N., Mattila S., Ehrenfreund P., Kaper L., Leibundgut B., Lundqvist P., 2005, A&A, 429, 559
- Steele et al. (2004) Steele I. A. et al., 2004, Proc. SPIE, 5489, 679
- Stritzinger et al. (2002) Stritzinger M. et al., 2002, AJ, 124, 2100
- Stritzinger et al. (2009) Stritzinger M. et al., 2009, ApJ, 696, 713
- Sutherland & Wheeler (1984) Sutherland P. G., Wheeler J. C., 1984, ApJ, 280, 282
- Taubenberger et al. (2011) Taubenberger S. et al., 2011, MNRAS, 413, 2140
- Thöne et al. (2009) Thöne C. C., Michałowski M. J., Leloudas G., Cox N. L. J., Fynbo, J. P. U., Sollerman J., Hjorth J., Vreeswijk P. M., 2009, ApJ, 698, 1307
- Tominaga et al. (2005) Tominaga N. et al., 2005, ApJ, 633, L97
- Turatto et al. (2003) Turatto M., Benetti S., Cappellaro E., 2003, in Hillebrandt W., Leibundgut B., eds, Proc. ESO/MPA/MPE Workshop, From Twilight to Highlight: The Physics of Supernovae. Springer-Verlag, Berlin, p. 200
- Ulvestad (2009) Ulvestad J. S., 2009, AJ, 138, 1529
- Valenti et al. (2008) Valenti S. et al., 2008, MNRAS, 383, 1485
- Valenti et al. (2011) Valenti S. et al., 2011, MNRAS, 416, 3138
- Van Dyk et al. (2011) Van Dyk S. D. et al., 2011, ApJ, 741, L28
- Yaron & Gal-Yam (2012) Yaron O., Gal-Yam A., 2012, PASP, 124, 668