CANDELS+3D-HST: compact SFGs at z2–3, the progenitors of the first quiescent galaxies
Abstract
We analyze the star-forming and structural properties of 45 massive (log(M/M⊙)) compact star-forming galaxies (SFGs) at to explore whether they are progenitors of compact quiescent galaxies at . The optical/NIR and far-IR Spitzer/Herschel colors indicate that most compact SFGs are heavily obscured. Nearly half (47%) host an X-ray bright AGN. In contrast, only about 10% of other massive galaxies at that time host AGNs. Compact SFGs have centrally-concentrated light profiles and spheroidal morphologies similar to quiescent galaxies, and are thus strikingly different from other SFGs, which typically are disk-like and sometimes clumpy or irregular. Most compact SFGs lie either within the SFR–mass main sequence (65%) or below it (30%), on the expected evolutionary path towards quiescent galaxies. These results show conclusively that galaxies become more compact before they lose their gas and dust, quenching star formation. Using extensive HST photometry from CANDELS and grism spectroscopy from the 3D-HST survey, we model their stellar populations with either exponentially declining () star formation histories (SFHs) or physically-motivated SFHs drawn from semi-analytic models (SAMs). SAMs predict longer formation timescales and older ages 2 Gyr, which are nearly twice as old as the estimates of the models. While both models yield good SED fits, SAM SFHs better match the observed slope and zero point of the SFR–mass main sequence. Contrary to expectations, some low-mass compact SFGs (log(M/M⊙)) have younger ages but lower sSFRs than that of more massive galaxies, suggesting that the low-mass galaxies reach the red sequence faster. If the progenitors of compact SFGs are extended SFGs, state-of-the-art SAMs show that mergers and disk instabilities are both able to shrink galaxies, but disk instabilities are more frequent (60 versus 40) and form more concentrated galaxies. We confirm this result via high-resolution hydrodynamic simulations.
Subject headings:
galaxies: starburst — galaxies: photometry — galaxies: high-redshift1. Introduction
The formation history of very massive galaxies is not well understood. Present-day massive galaxies are known to be a homogeneous population characterized by red optical colors that follow a tight correlation with stellar mass (i.e., the red sequence; Kauffmann et al. 2003; Baldry et al. 2004). This population consists mostly of galaxies with early-type morphologies and passively evolving stellar populations (e.g., Djorgovski & Davis 1987; Thomas et al. 2005). However, a coherent evolutionary picture of their early star formation histories (SFHs) and the buildup of their stellar mass over cosmic time is still lacking.
Observations at higher redshifts suggest that the first quiescent galaxies formed very early during the first 2–3 Gyr of the Universe, becoming the dominant population among massive galaxies as early as (Fontana et al. 2009; Ilbert et al. 2010; Brammer et al. 2011; Muzzin et al. 2013). Recent works have even identified, photometrically and spectroscopically, a small number of these galaxies at (Guo et al. 2011; Gobat et al. 2012; Stefanon et al. 2013), indicating that a fraction of the quiescent population appear in only 1 Gyr. What is perhaps even more surprising is that the first quiescent galaxies were structurally very different from their local analogs, having effective radii up to a factor of smaller than those of quiescent galaxies at . (e.g., Daddi et al. 2005; van Dokkum et al. 2008; Trujillo et al. 2007; Buitrago et al. 2008; Toft et al. 2007; Saracco et al. 2010; Cassata et al. 2011; Szomoru et al. 2011).
Theoretical models are slowly converging on an evolutionary picture that describes the formation of quiescent galaxies as a two-stage process (e.g., Naab et al. 2007; Oser et al. 2010). First, an early phase of highly dissipative in situ star formation fueled by cold gas streams (Birnboim & Dekel 2003; Kereš et al. 2005; Dekel & Birnboim 2006; Dekel et al. 2009a) or gas-rich mergers (Hopkins et al. 2006; Hopkins et al. 2008) leads to the formation of a compact remnant (Elmegreen et al. 2008; Dekel et al. 2009b; Wuyts et al. 2010). Then, a late phase of size growth dominated by the accretion of smaller systems slowly increases their radii (Bournaud et al. 2007; Naab et al. 2009; Bezanson et al. 2009; although see Poggianti et al. 2013; Carollo et al. 2013 for a different picture). One of the main challenges of this picture is identifying the mechanism responsible for both the truncation of the star formation and the structural transformation to understand the relation between the quiescent population and their star-forming progenitors. Indeed, observations reveal that these two populations have significantly different structural properties at . While star-forming galaxies (SFGs) exhibit disk-like morphologies and, in many cases, irregular and clumpy structures (e.g., Elmegreen & Elmegreen 2005a; Elmegreen et al. 2007; Kriek et al. 2009a; Guo et al. 2012), quiescent galaxies at that redshift are spheroid-dominated (Szomoru et al. 2011; Bell et al. 2012). Furthermore, quiescent galaxies have smaller sizes than star-forming galaxies of the same stellar mass (Williams et al. 2010; Wuyts et al. 2011a). This difference suggests that the observational picture is missing a key population in the evolutionary sequence that connects star-forming and quiescent galaxies, namely, objects transitioning from star-forming to quiescent that simultaneously experience a shrinkage in size.
Naively one would expect that such a connection would be through a population of massive, compact star-forming galaxies (SFGs). However, evidence for such galaxies remained elusive even for the deepest HST optical surveys, which can only probe the rest-frame UV of galaxies, and thus tend to miss dust-obscured galaxies. Now, owing to new IR capabilities of the WFC3 camera, the analysis of (rest-frame optical) sizes can be extended to higher redshifts, and evidence has started to accumulate, revealing the existence of an abundant population of compact but red SFGs at (Wuyts et al. 2011b; Patel et al. 2012b; Barro et al. 2013; Stefanon et al. 2013; Williams et al. 2013). These galaxies typically have large stellar masses, heavily obscured star formation and spheroid-like morphologies. More importantly, they exhibit the small radii of compact quiescent galaxies implying that structural changes can occur on timescales comparable to the SF quenching timescale.
Barro et al. (2013, hereafter B13) demonstrated that the radii and stellar mass surface densities of compact SFGs quantitatively matched those of compact quiescent galaxies. They further showed that the fall in the number density of compact SFGs since is consistent with the observed increase in the density of compact quiescent galaxies assuming quenching times for the former of 300 Myr to 1 Gyr. Relatively short star formation timescales are plausible if, as pointed out in Wuyts et al. (2011b), some of these galaxies are offset from the SFR correlation (the so-called main sequence; Noeske et al. 2007; Elbaz et al. 2007) towards the high-SFR upper envelope. In such extreme cases, gas exhaustion, supernova and AGN feedback lead to a rapid decline in SFR. The latter can be particularly relevant in compact galaxies sustaining large SFRs over very small regions. As shown in, e.g., Diamond-Stanic et al. (2012) (see also Tremonti et al. 2007; Newman et al. 2013b) high SFR surface densities are associated with strong galactic outflows that can deplete the gas reservoirs in a short period of time.
Understanding the location and evolution of compact SFGs in relation to the main sequence of “normal” galaxies is critical to assess whether they represent extreme cases of high star formation efficiency (starburst; Daddi et al. 2010; Rodighiero et al. 2010) such as SMG and HyLIRGs (Smail et al. 1997; Blain et al. 2002; Targett et al. 2013), or if they are forming stars gradually over longer timescales. Life-paths on this diagram allow us to explore the proposed evolutionary connection with quiescent galaxies, as well as discriminate between possible formation scenarios that predict different trends in the structural properties, the morphological type or the amount of dust extinction along the evolutionary track.
The aim of this paper is to extend the results of B13 and present further evidence that compact SFGs at are the natural progenitors of compact quiescent galaxies at . To that end, we present a detailed analysis of a sample of 45 compact SFGs, selected from the CANDELS survey in GOODS-S. First, we assemble comprehensive UV-to-far IR stellar energy distributions (SEDs) for these galaxies, and we study their observed and rest-frame colors, SFRs, morphologies, structural properties and AGN activity with respect to other star-forming and quiescent galaxies at the same redshift. Then, we model their SEDs using stellar population synthesis (SPS) to: 1) estimate their stellar ages, 2) study the implications of the assumed SFH on the predicted tracks in the SFR–M diagram, and compare these with the observed galaxy distribution; 3) estimate their quenching times and compare the predicted number of quenched compact SFGs as a function of time with the observed number density of quiescent galaxies since . Finally, we speculate on the origin of compact SFGs by studying their possible formation mechanisms using semi-analytic models (SAMs) and N-body simulations.
The structure of the paper is as follows. In Section 2 we describe the datasets, the SED modeling, the procedure to estimate galaxy properties and the criteria to select compact SFGs. In Section 3 we study the SFRs, optical/NIR/far IR colors, structural properties and AGN activity of these galaxies. In Section 4 we compare the best-fit stellar ages and formation timescales for compact SFGs obtained with 3 different SFH models. In Section 5 we show the evolutionary tracks in the SFR–M and UVJ diagrams inferred from their SFHs, and we discuss the implications for the proposed evolutionary sequence from star-forming to quiescent. In Section 6, we discuss the formation mechanisms of compact SFGs in the context of theoretical simulations.
Throughout the paper, we adopt a flat cosmology with =0.3, =0.7 and H km s-1 Mpc-1 and we quote magnitudes in the AB system.
2. DATA
The sample of compact SFGs analyzed in this paper is drawn from the parent catalog presented in B13. In the following, we briefly outline the datasets on which the catalog is based, the procedures to estimate stellar properties and SFRs, and the most relevant over B13.
2.1. Multi-band photometric data in GOODS-S/CANDELS
The parent galaxy sample is derived from a HST/WFC3 F160W (-band) selected catalog in the GOODS-S field. The WFC3/IR observations in this field cover a total area of 173 arcmin2 at different depths. The Early Release Science (ERS, Windhorst et al. 2011) and the CANDELS Wide regions (Grogin et al. 2011; Koekemoer et al. 2011) cover 2/3 of the area at 2-orbit depth ( mag; 115 arcmin2), and the CANDELS Deep region covers the remaining 1/3 at 10-orbit depth ( mag; 55 arcmin2). The galaxies were selected from a combined mosaic drizzled to a 0.06″/pixel scale with a typical point spread function (PSF) of 0.18 arcsec. The multi-wavelength catalog based on the -band selection includes photometry in 14 passbands ranging from U to 8m, with 7 high-resolution bands from HST/ACS and WFC3 (B435,V606,i775,z850,YJH) and the deepest Spitzer/IRAC data from SEDS (Ashby et al. 2013). The merging with lower resolution data (ground-based and Spitzer/IRAC) was computed using TFIT (Laidler et al., 2006). A comprehensive overview of this catalog can be found in Guo et al. (2013; see also Galametz et al. (2013) for more details).
We also include complementary mid-IR photometry in Spitzer/MIPS 24 and 70 m (30 Jy and 1 mJy, ) from Pérez-González et al. (2008b), and far-IR from the GOODS-Herschel (Elbaz et al. 2011) and PEP (Magnelli et al. 2013) surveys, including PACS- 100 and 160 m, and SPIRE- 250, 350 and 500 m. A description of the method used to derive consistent mid-to-far IR SEDs is presented in Pérez-González et al. (2008a); Pérez-González et al. (2010). X-ray source identifications and total luminosities () were computed for the sources identified in the Chandra 4 Ms catalog (Xue et al., 2011).
2.2. Inferred galaxy properties
In order to select a sample of compact SFGs, we first derive photometric redshifts, stellar masses and star formation rates (SFRs) for all the galaxies in the band selected catalog from SED modeling. These properties have been used in previous works by Wuyts et al. (2011b, 2012) and B13. Therefore we describe here only the most relevant details. In brief, photometric redshifts were estimated from a variety of different codes available in the literature which are then combined to improve the individual performance. The technique is fully described in Dahlen et al. (2013), and the catalog will be released in Dahlen et al. (2014, in prep). Based on the best available redshifts (spectroscopic or photometric; see Table 1) we estimated stellar masses and other stellar population properties (such age, extinction, UV-based SFR, etc.) using FAST (Kriek et al., 2009b). The modeling is based on a grid of Bruzual & Charlot (2003, BC03) models that assume a Chabrier (2003) IMF, solar metallicity, exponentially declining star formation histories, and a Calzetti et al. (2000) extinction law. Rest-frame magnitudes based on the best-fit redshifts and stellar templates were computed using EAZY (Brammer et al., 2008).
We compute SFRs on a galaxy-by-galaxy basis using a ladder of SFR indicators as described in Wuyts et al. (2011a). The method essentially relies on IR-based SFR estimates for galaxies detected at mid- to far-IR wavelengths, and SED-modeled SFRs for the rest. As shown in Wuyts et al. (2011a) the agreement between the two estimates for galaxies with a moderate extinction (faint IR fluxes) ensures the continuity between the different SFR estimates (see also Appendix B). For IR-detected galaxies the total SFRs, SFRIR+UV , were then computed from a combination of IR and rest-frame UV luminosities (uncorrected for extinction) following Kennicutt (1998) (see also Bell et al. 2005):
| (1) |
The normalization factor corresponds to a Chabrier (2003) IMF, and is estimated from the best fitting SED template. Note that for the analysis of compact SFGs we perform a more exhaustive SED modeling in § 4. However, we base our sample selection in an easy-to-reproduce method using the standard data described above. We verify that the re-computed stellar properties do not introduce any significant difference on the sample selection.
The shape of the two-dimensional surface brightness profiles measured from the HST/WFC3 F160W image were modeled using GALFIT (Peng et al., 2002). The method and the catalog are fully described in van der Wel et al. (2012). A single component fit was performed to determine the circularized, effective (half-light) radius, re ( is the half-light radius along the major axis), and the Sérsic index, . Spatially variable point spread functions (PSFs) were created and processed with TinyTim (Krist, 1995) to replicate the conditions of the observed data when fitting light profiles. We note that the circularized radius, although widely use in the literature, may cause edge-on galaxies to appear smaller (see § 3.3).
2.3. Selection of compact SFGs
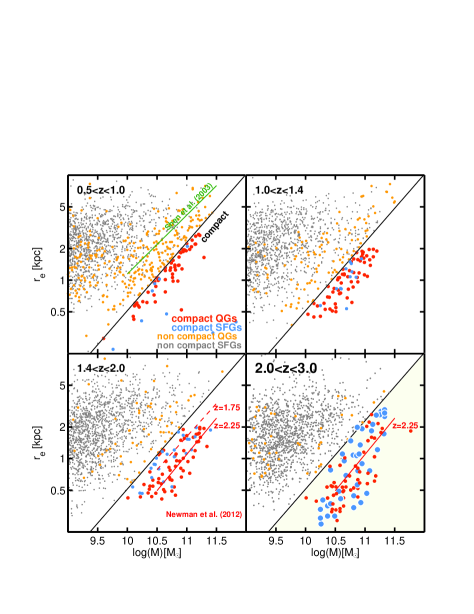
Following the criteria of B13, we select a sample of massive () compact star-forming galaxies at , using a threshold in pseudo stellar mass surface density, , of logkpc-1.5 (below the black line in Figure 1) and specific SFR, log(sSFR/Gyr-1). The latter is set slightly above a mass doubling time of at to reject the majority of passively evolving galaxies, whereas the limit in is chosen to select galaxies in the region of the mass size diagram occupied by quiescent galaxies at . Based on these criteria we identify a total of 45 compact SFGs. The overall properties of these galaxies are summarized in Table 1. We note that 4 of these galaxies are excluded from the analysis of the stellar properties in the following sections (except § 3.4) due to AGN continuum contamination in the SED (see Appendix A).

To illustrate the motivation of the selection criteria, Figure 1 shows the mass–size relation for galaxies more massive than log(M/M⊙) in 4 redshift intervals ranging from . The sub-populations of compact SFGs and quiescent galaxies are highlighted in blue and red, respectively. As discussed in B13 and other previous works, the region limited by the threshold encloses most of the quiescent population at , which appears to follow a very tight mass-size correlation with a nearly constant slope and an increasing zero point towards larger sizes as a function of time (see e.g., Cassata et al. 2011; Newman et al. 2012). Interestingly, at , this region becomes more densely populated with compact SFGs (large blue markers) which are not nearly as abundant at lower redshifts (Figure 2 of B13). The changing nature of the galaxies populating the compact region, from star-forming to quiescent around , jointly with the remarkable similarity of their structural properties (Sérsic, and ) and the rapid increase in the number density of compact quiescent galaxies (Cassata et al. 2013) was interpreted in B13 as an indication of the evolutionary connection between the two populations.
2.4. 3D-HST NIR grism spectra of compact SFGs
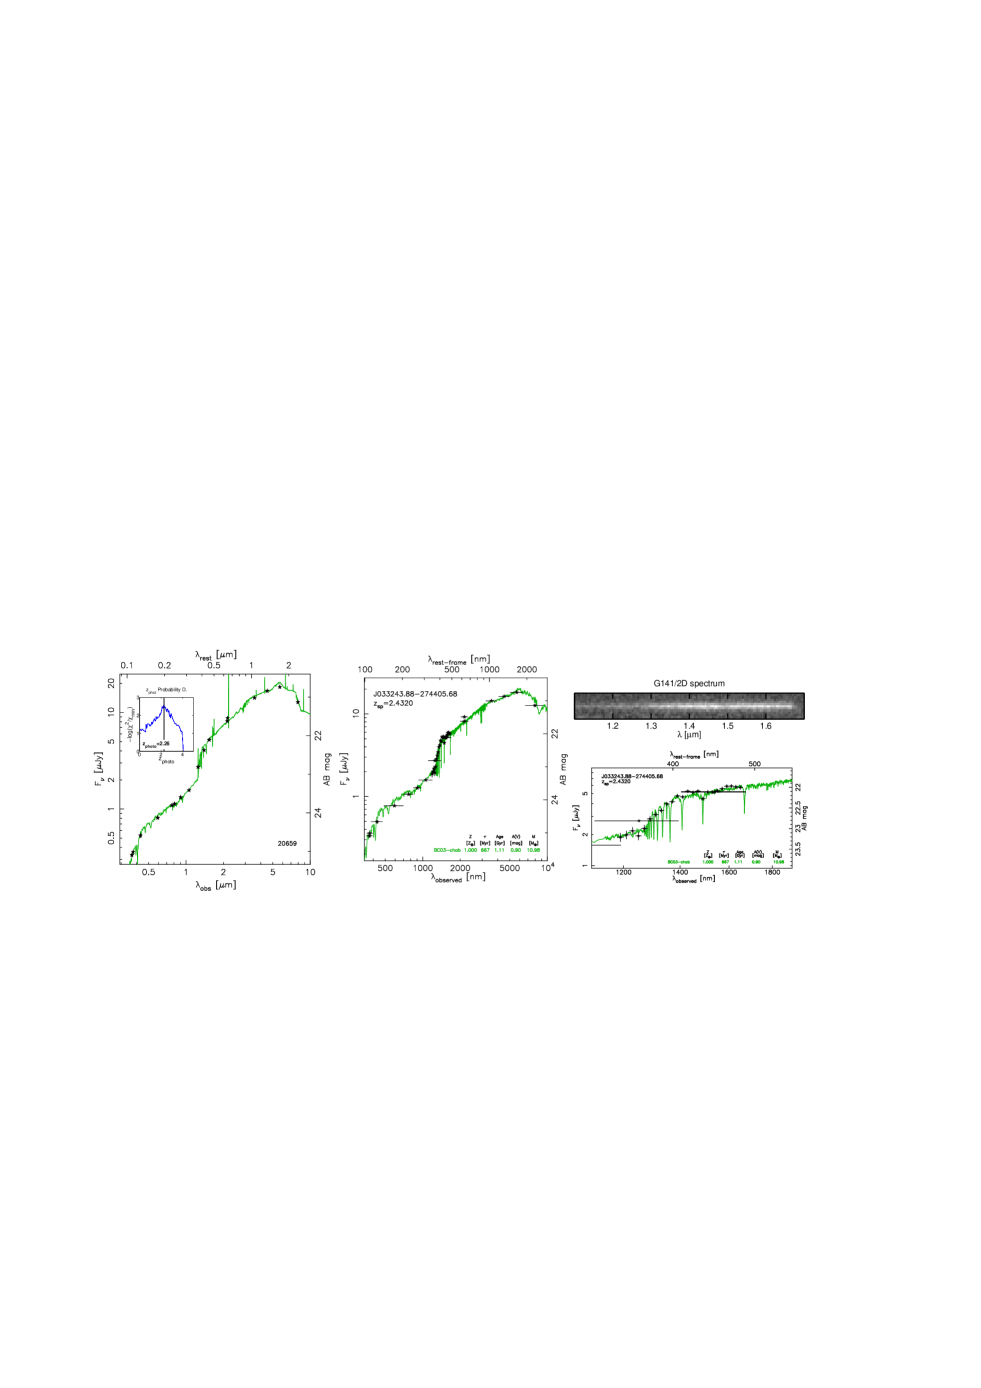
In order to improve the spectral characterization of the compact SFGs, we combined the broad-band photometry SEDs with HST/WFC3 G141 grism spectroscopy from the 3D-HST survey (Brammer et al., 2012). The grism provides continuous wavelength coverage from 1.1 to 1.6 m with medium resolution (; 47 Å/pixel), yielding continuum detections for sources brighter than . This allows us to improve the spectral resolution around the age-sensitive features in the rest-frame optical of galaxies at ( Å; e.g., Kriek et al. 2011; Whitaker et al. 2013). The source catalog and one-dimensional flux-calibrated spectra reduced with the aXe software (Kümmel et al., 2009) were drawn from Trump et al. (2013). All compact SFGs fall within the area covered by the G141 observations. However, the grism spectra of nearby objects can sometimes overlap with the main extraction causing partial, or severe, flux contamination (Brammer et al., 2012). Nevertheless, the aXe reduction provides a contamination estimate that can be used to determine the un-contaminated spectral range. Based on that determination, we extracted good quality spectra ( contamination) for 36 of the 45 compact SFGs.
Figure 2 illustrates the procedure to merge a G141 spectrum with the broad-band SED. Briefly, we extract the 1D spectrum in the wavelength range 1.11.7 m at a native resolution of 46.5 Å/pixel. Then, we convolve it with a square filter transmission of FWHM200Å for the purpose of combining it with the broad-band photometry. The spectra are already flux calibrated, but we perform an additional re-calibration by comparing to the broad-band photometry in F140W and F125W. This results in small variations of less than 2% level. For the faintest objects in the sample, we bin the spectra by a factor 23 to increase the SNR at the expense of lowering the spectral resolution.
At the G141 spectra can yield detections of emission lines due to [Oiii] or [Oii], or absorption lines in the Balmer series or the G-band. However, due to the low spectral resolution and the additional broadening caused by the intrinsic galaxy shape, high-EW emission lines are more easily detected (e.g., Trump et al. 2011; Fumagalli et al. 2012) than absorption lines, which are only identified with high significance in bright galaxies (van Dokkum & Brammer 2010) or in stacked spectra (e.g., Whitaker et al. 2013; Bedregal et al. 2013; Krogager et al. 2013). Among our compact SFGs only 3 galaxies show emission lines, and another 6 (with confirmed spectroscopic redshift) show evidence of absorption lines at the appropriate rest-frame wavelengths (Barro et al. 2014, in prep). Nonetheless, the grism data provide a solid detection of the stellar continuum (top-right panel of Figure 2) which, when combined with the broad-band photometry, increase the spectral resolution of the SED, improving the quality of the photometric redshifts and the estimated stellar properties (Brammer et al. 2012; Bedregal et al. 2013). Roughly half of the sample (23/45; see Table 1) have previous spectroscopic redshifts. For those galaxies, the overall accuracy of the photometric redshifts based on the composite SEDs is better than 1% (%).
3. Properties of compact SFGs at
In this section, we review and expand the analysis of the properties of compact SFGs at presented in B13, and in § 4 and § 5 and we model their stellar populations to verify if the proposed evolutionary connection with compact quiescent galaxies is consistent with the estimated ages, quenching times, and evolutionary tracks on the SFR–M diagram.
3.1. Distribution in the SFR–M plane
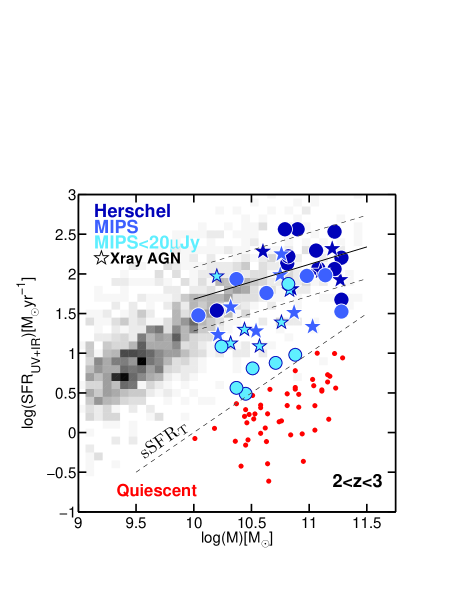
The left panel of Figure 3 shows SFR versus stellar mass for all SFGs (boxed gray scale) and quiescent galaxies (red markers) at highlighting the location of compact SFGs (blue markers; the shade of blue indicates the strength of the far-IR detection). A correlation between SFR–M, usually referred as the “main sequence” of star-forming galaxies (Noeske et al. 2007; Elbaz et al. 2011), is visible across the whole mass range. In agreement with previous studies of massive galaxies (log(M/M⊙)), we find that the majority of compact SFGs present dust obscured star formation (Papovich et al. 2007; Pérez-González et al. 2008b; Bauer et al. 2011), based on their detection at mid-to-far IR wavelengths: 71% are detected in MIPS 24 m, and 44%/13% are detected in Herschel PACS/SPIRE, respectively. All Herschel detections are also recovered in the deeper 24 m data (S20Jy vs. 1mJy in the Herschel bands). In addition, the fraction of IR-detections increases towards the most massive galaxies indicating that IR-luminosity, and in general dust attenuation (/; Barro et al. 2011), both correlate with stellar mass in SFGs, i.e., the most massive, star-forming galaxies are more obscured (Brammer et al. 2011; Wuyts et al. 2011b).
The fraction of compact SFGs among all massive SFGs is 20%. This number however depends on the stellar mass, increasing from 10% to 30% and 37% at log(M/M⊙)[],[] and []. This is because, at the high-mass end, the number of non-compact SFGs and the scatter in their mass–size distribution (i.e., the range in ) decreases, leading to an increase in the relative number of compact vs. extended SFGs (below and above the black line in Figure 1).
In agreement with previous works, we find a flattening in the slope of the main sequence at the high-mass end (Bauer et al. 2011; Whitaker et al. 2012b). The black line in Figure 3 shows the best fit (3) to a single power-law () for all massive (log(M/M⊙)) SFGs. With respect to this fit, most compact SFGs are found either on the main sequence (65%) or below it (30%), which is consistent with the idea that at least some of these galaxies are in transit to the red sequence. We note also that compact SFGs below the main sequence have a stellar mass distribution more skewed towards smaller values (log(M/M⊙)) than those in the main sequence (see also § 4.1.1 for further discussion). Only 2 compact SFGs present SFRs slightly above the 3 upper-limit of the main sequence (we reject another 2 due to AGN contamination; see next section). Such galaxies, usually called starburst (Daddi et al. 2010; Rodighiero et al. 2011), are thought to be in a short-lived, high star formation efficiency phase (high gas-to-SF ratio), possibly triggered by an external mechanism, such as mergers or galaxy interactions. If compact SFGs are the precursors of the quiescent population, the small starburst fraction suggests that quenching is not usually preceded by a strong peak in the SFR, or, alternatively, the duty cycle of the starburst phase is very short compared to the duration of the star-forming phase. Incidentally, we do not find evidence for tidal features or disturbed appearances in either of these 2 galaxies, but we note that these are not necessarily representative of the whole starburst population, as is the case in, e.g., Kartaltepe et al. (2012).
3.2. Extinction properties
The right panel of Figure 3 shows the rest-frame vs. color (hereafter UVJ) for compact SFGs and other massive star-forming and quiescent galaxies at . The UVJ diagram is an alternative diagnostic to distinguish between reddened star-forming and quiescent galaxies according to their SEDs. This method has been shown to be very successful in breaking the dust /age degeneracy using the color as a proxy for dust attenuation (Wuyts et al. 2007; Williams et al. 2010; Whitaker et al. 2011). The UVJ colors of compact SFGs are consistent with their distribution on the SFR–M diagram, and support the idea of their transitory nature from star-forming to quiescent. Roughly 70% of the compact SFGs, predominantly those with far-IR detections, present red colors characteristic of dusty SFGs, while the remaining 30% appear to lie within (or close to) the quiescent region. Within the latter, we also find evidence for differences in the attenuation level as a function of the color. Those with lower extinctions, to the left of , were identified in Whitaker et al. (2011) as recently quenched galaxies, following a nearly vertical color track (i.e., maintaining a low extinction) starting as low-mass, un-extinguished, galaxies. If that is the case, those nearly quiescent galaxies at could indicate the arrival point on the red sequence for more dusty compact SFGs. We further investigate the possible evolutionary tracks of compact SFGs in the UVJ diagram as a function of their stellar mass and SFH in § 5.2. For the purpose of further discussion in the following sections, we divide the UVJ diagram into 5 regions, roughly corresponding to the following overall properties: 1) low-SFR, low-extinction; 2) low-SFR, higher-extinction; 3, 4 and 5) star-forming with increasing stellar mass and extinction.
3.3. Structural properties and visual appearance
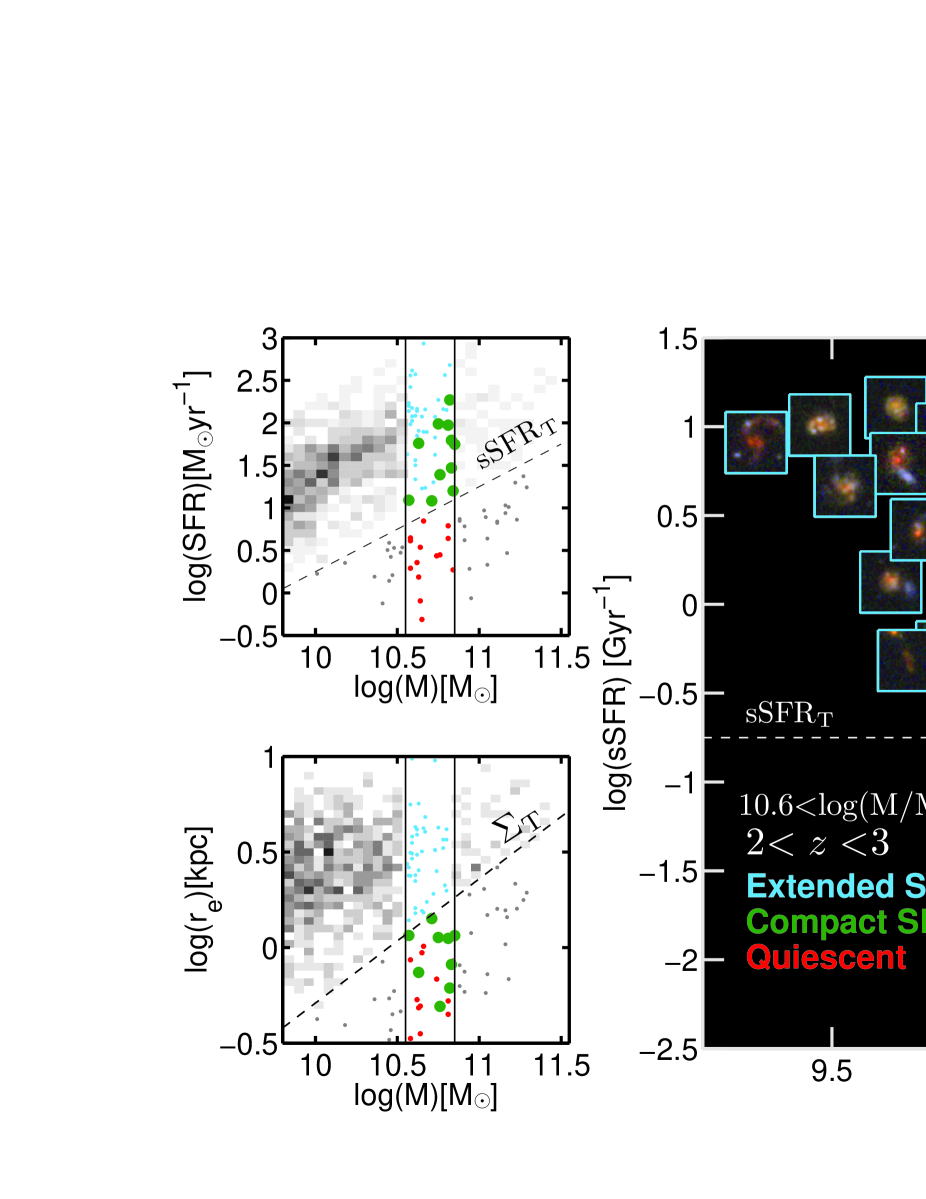
Compact SFGs are selected to have high stellar mass surface densities similar to those of quiescent galaxies at . This means that, for a given slice in stellar mass, compact SFGs exhibit the remarkably small effective radii of quiescent galaxies while having the SFRs of normal, main sequence, galaxies (Figure 4). As a result, they occupy a distinct region in the sSFR– diagram which, combined with the lack of extended-quiescent galaxies, suggest that, at these redshifts, the quenching of star formation takes place in the most compact (higher ) galaxies (see e.g., Cheung et al. 2012, and Fang et al. 2013 for an extension of this result to lower redshifts), and thus compact SFGs are the immediate progenitors of the quiescent population. Under the assumption that galaxies grow both in stellar mass and size during their star-forming phase, the natural precursors of massive, compact SFGs are larger SFGs, suggesting that the evolutionary sequence in Figure 4 goes from extended to compact SFGs (left-to-right) and then to quiescence by simply shutting down star formation. This sequence implies also the need for a mechanism to shrink the size and to change the structure of extended SFGs transforming them into compact SFGs. We explore these mechanisms in § 6.
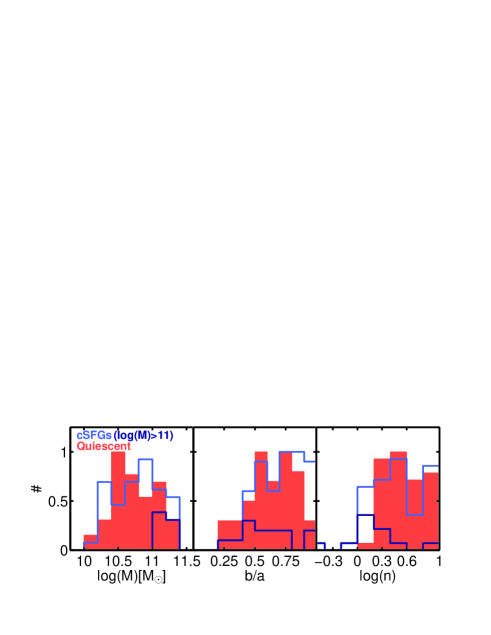
The evolution from compact SFGs to compact quiescent galaxies is supported by the histograms in Figure 5 which show that compact SFGs span roughly the same range in stellar mass (log(M/M⊙)) as quiescent galaxies, while having high Sérsic indices () and axis-ratios (), characteristic of that population (e.g., Szomoru et al. 2012; Bell et al. 2012). We also find a trend with stellar mass such that the most massive (log(M/M⊙)) and larger ( kpc) compact SFGs are more akin to edge-on disks, with lower Sersic indices and a flatter distribution of axis ratios (dark-blue line in Figure 5). This however is also true also massive compact quiescent galaxies at (van der Wel et al. 2011; Bruce et al. 2012; Chang et al. 2013), indicating that the structural similarities between the two populations are also preserved at different stellar masses.
In terms of their visual appearance, compact SFGs show undisturbed spheroidal morphologies, very similar to compact quiescent galaxies, but strikingly different from non-compact SFGs, which are predominantly disk-like or irregular (right panel of Figure 4). Only the most massive and dust-obscured galaxies, mainly in region 5 of the UVJ diagram, present different morphologies, more similar to edge-on disks or patchy galaxies with diffuse light profiles nearly undetected in the rest-frame UV images (see also Patel et al. 2012a). Indeed, their selection as compact galaxies may be partially due to an inclination effect. Signatures of mergers or interactions are uncommon among compact SFGs and, in general, among spheroidal galaxies at (Kaviraj et al., 2012, 2013a). The few examples of disturbed morphologies within our sample appear to be in the most unobscured galaxies in region 3 of the UVJ. Interestingly, 3 of these galaxies host the most luminous X-ray galaxies ( erg/s) in the sample.
3.4. Far IR colors and SEDs
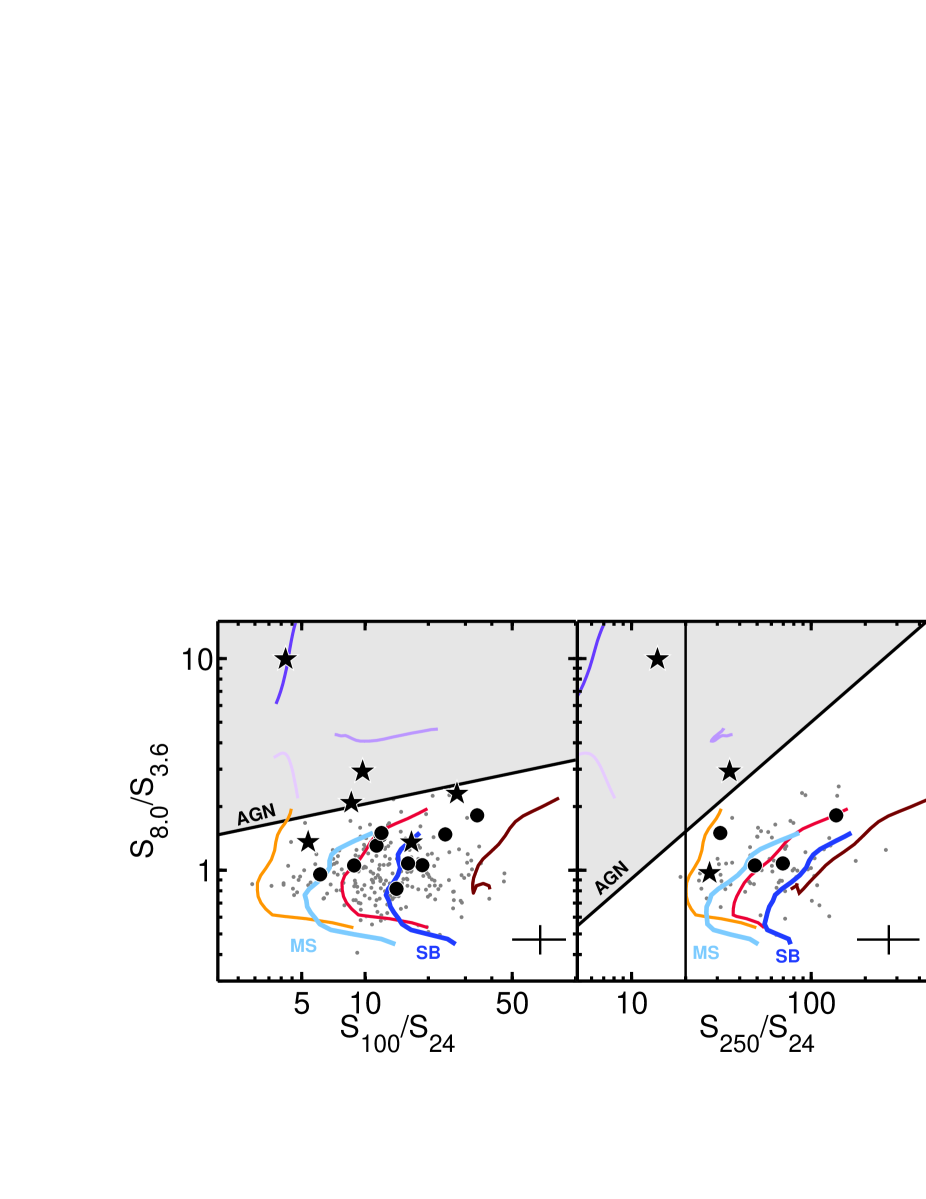
The emission at mid-to-far IR wavelengths is typically associated with dust heated by star formation. However, if part of this emission originates from a different source, such as an AGN or an evolved stellar population, it could lead us to overestimate the IR-based SFR. The latter case appears to be relevant only for galaxies with low SFRs (Salim et al. 2009; Fumagalli et al. 2013), however, an obscured AGN can have a significant contribution to the IR-emission even in strongly SFGs (Daddi et al. 2007b, a). The shape of the IR SED, probed by Spitzer/Herschel colors, provides an effective diagnostic tool to identify the power source of the dust heating (e.g., Kirkpatrick et al. 2013). Dust heated by star formation has colder temperatures ( K), and thus emits at longer wavelengths than dust heated by an AGN ( K), which is a more intense heating source. Figure 6 shows the S250/S24 and S100/S24 Spitzer/Herschel colors versus the S8.0/S3.6 IRAC color for 19 (7) compact SFGs detected in PACS (SPIRE) compared with other massive SFGs at . In the presence of an AGN, the emission at shorter wavelengths leads to bluer Herschel colors and redder IRAC colors, typically within the gray shaded areas. IRAC colors have been widely used in the literature as an AGN selection criterion (e.g., Lacy et al. 2004; Stern et al. 2005; Donley et al. 2007), but combined with their Herschel colors, also provide additional information on the heating source (SF vs. AGN) or the nature of the star formation (main sequence vs. starburst). To illustrate these differences, Figure 6 shows color tracks of IR templates with increasing levels of AGN activity (purple) and IR luminosity (red).
The overall Herschel colors and the distribution with respect to other SFGs indicates that the IR emission in compact SFGs is mainly fueled by star formation. Only 2/6 X-ray detected compact SFGs (22603 and 9834) appear to have a significant contribution from the AGN to the IR emission, whereas the other 4 present colors consistent, or slightly above, the star-forming range. The first 2 galaxies and another one of the second group, were already excluded from our analysis on the basis of AGN contamination in the stellar SED, but are shown in this section to illustrate the effects of AGN emission in the IR-colors.
We also find an excellent agreement between the main sequence/starburst classification derived from the SFR–M diagram and the Herschel colors. Only 2 galaxies (25998 and 14876), the same ones above the main sequence in Figure 3, appear to have a high S100/S2420 ratio characteristic of starburst galaxies. The remaining compact SFGs lie roughly between the tracks of the main sequence and starburst templates (Elbaz et al. 2011; Magdis et al. 2012), with IR luminosities ranging from .
3.5. AGN identification from X-rays
Using the Chandra 4 Ms catalog, we find that roughly of all massive () galaxies at host an X-ray detected AGN (see also Wang et al. 2012). Interestingly, the majority of these luminous ( erg/s) AGNs are found in compact hosts. In this sample, which covers a slightly wider area of GOODS-S than B13, 47% (21/45) of the compact SFGs are X-ray detected AGN, 6 of which are also selected using the IRAC power-law criteria (PLG; Donley et al. 2007, 2008; Caputi 2013). Note also that, at the depth of the 4 Ms Chandra survey, only the most luminous AGNs can be detected at . Thus the intrinsic fraction could be higher if we were able to detect lower-luminosity AGNs. For comparison, only 9% and 17% of the non-compact SFGs and compact quiescent galaxies host an AGN. In the context of the evolutionary sequence, the large fraction of AGNs among compact SFGs suggests that the transformation from extended to centrally concentrated compact SFG triggers a phase of black hole and stellar bulge growth which could signal the building of the M relation (Cisternas et al. 2011; Mullaney et al. 2012).
Compact SFGs with and without AGNs (stars in Figure 3) appear to have a similar distribution in the UVJ and SFR–M diagrams, which provides no conclusive evidence on the role of the AGN in the quenching of the star formation. We note however, that the high AGN fraction among compact SFGs makes the quenching scenario more likely at high redshift than in the local Universe, where AGNs are more frequent among older star-forming galaxies or post-starburst (Davies et al. 2007; Wild et al. 2010; Yesuf et al. 2013, in prep.).
4. Stellar population modeling of compact SFGs
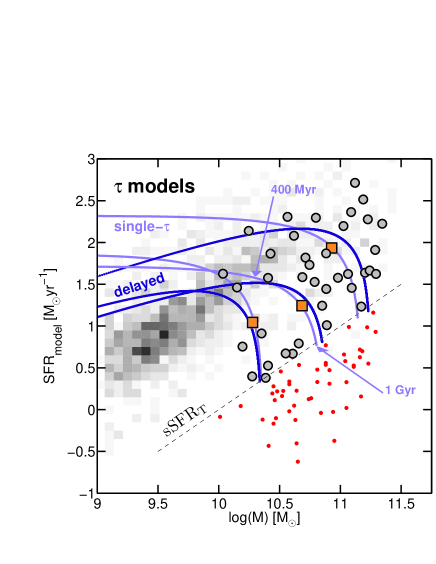
In § 2.4 we described the method to create composite SEDs combining broad-band photometry in 17 bands with WFC3/G141 grism spectroscopy. Here we make use of these detailed SEDs to estimate the stellar properties of compact SFGs from SED-fitting. In particular, we focus on deriving stellar ages and formation timescales (see also Appendix for a discussion on SFRs), and we study the differences arising from the use of 3 different parametrizations of the SFH, namely: single (§ 4.1) and delayed (§ 4.2) exponentially declining () models, and a library of SFHs derived from semi-analytic models (SAMs) of galaxy formation (§ 4.3). There are different possible definitions of galaxy age that are frequently used in the literature (e.g., SFR- or mass-weighted ages, Wuyts et al. 2011a). Here, we refer to the best-fit age as the time since the onset of star formation, .
4.1. Single models
The main modeling assumptions used with single (and also delayed) models are: the BC03 stellar library, a Chabrier (2003) IMF (), with a Calzetti et al. (2000) attenuation law ranging from , and solar metallicity. In addition, the folding times are required to be larger than 300 Myr to obtain a better agreement between the SFRIR+UV and the best-fit SFR from the models (see Appendix 1 for detailed discussion). No other constraints are imposed on the best-fit ages.
The best-fit ages estimated from single models range from Gyr, with a median value of Myr. Based on those ages, the formation redshifts range between and . The majority of compact SFGs present best-fit -folding times close to the minimum threshold, with a median value of Myr, and of the galaxies presenting values lower than Myr. The distribution of values peaks around 2.6, as expected from the star-forming nature of the sample. For comparison, quiescent galaxies are often selected with a threshold of (e.g., Fontana et al. 2009), which roughly corresponds to log(sSFR/Gyr-1).
4.1.1 Short-lived compact SFGs
We verify that the overall for constrained ( Myr) SED fits is fully consistent with the values obtained imposing no restrictions on the -folding time. For the majority of galaxies a weak constraint favors solutions with smaller and younger ages for similar values of log(t/)constant, i.e., within the well-known degeneracy in age- (see, e.g., Figure 11 of Pérez-González et al. 2013).
Nevertheless, for the (low-sSFR) galaxies in region 1 of the UVJ diagram (Figure 3b) the constrained models overestimate the rest-frame UV luminosity ( Å) providing a poor fit in that spectral range. Forcing a maximally-old age to reduce the UV-luminosity worsens the , suggesting that shorter formation timescales (i.e., shorter ) are required to reproduce the SEDs of these galaxies. Indeed, the unconstrained models provide the best-fit for typical -folding times of Myr and a median age of Gyr. As mentioned in § 3.2, region 1 of Figure 3b was identified in Whitaker et al. (2012a) as the arrival point on the red sequence for recently quenched galaxies (see also McIntosh et al. 2013). The small values of needed to fit these galaxies suggest that this is not only the arrival point for recently quenched galaxies, but specifically for galaxies with short assembly histories, i.e, a “fast track” to the red sequence. Meanwhile, other compact SFGs, well reproduced with constrained models, may follow a different route to the quiescent region of the UVJ. We further discuss this possibility in § 4.3 and § 5.2.
4.2. Delayed models
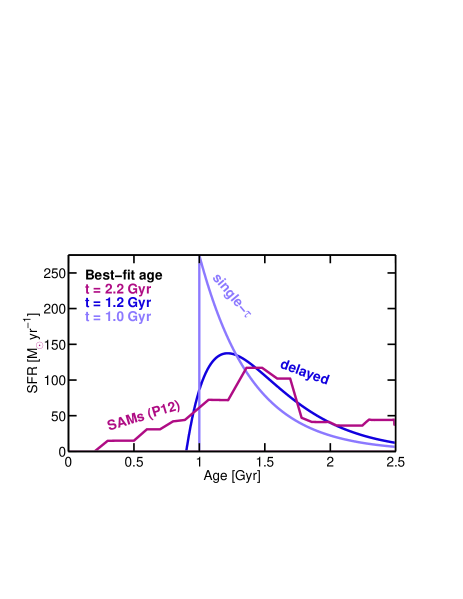
Several recent papers have addressed the issue of how the use of different SFHs affects the best-fit stellar properties (Lee et al. 2009; Pforr et al. 2012). While it is not yet clear what is the preferred functional form, there is a general agreement on the limitations of declining models to recover the stellar properties of young star-forming galaxies at (Finlator et al. 2011; Papovich et al. 2011; Schaerer et al. 2011). The problem arises because some galaxies might undergo increasing, rather than decreasing, SFHs during the early phases of their lives. For such galaxies there is often a better agreement between the properties derived from SED-modeling and observed estimates of the stellar age and SFR using inverted (exponentially increasing) models or the delayed models, SFR (Maraston et al. 2010; Gonzalez et al. 2012; Curtis-Lake et al. 2012). The main difference between single and delayed models is an early phase () of increasing SFR in the latter, while at intermediate-to-late times both models present the same exponential decline with time (Figure 7).
We find however, that none of the compact SFGs are in the increasing SFR phase at the epoch of observation, i.e., they are predominantly in intermediate-to-late evolutionary stages (), for which the single and delayed models have similar behavior, and thus provide similar best-fit stellar properties. The only significant difference is that stellar ages are older in the delayed models, with values ranging from Gyr, and a median value of Gyr. The median -folding time is the same in both models, Myr, and the distribution is similarly skewed towards the minimum threshold, with of the galaxies having Gyr. The stellar masses are also fully consistent, with only a small offset (log(M/M⊙) dex) towards larger stellar masses in the delayed models. The typical scatter of the comparison is smaller than 0.1 dex. Thus we conclude that, for compact SFGs, the use of single or delayed models produce similar best-fit results, with the only noticeable difference of slightly older stellar ages in the latter.
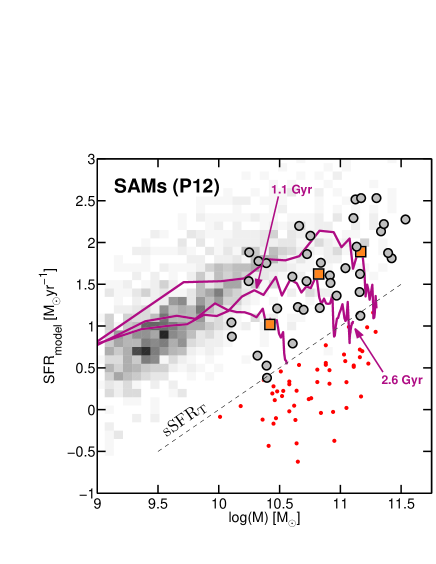
4.3. SFHs from semi-analytic models of galaxy formation
An alternative option to parametric SFHs is to use a library of physically motivated SFHs drawn from theoretical models of galaxy formation. The advantage of this approach is that the range of possible SFHs is more diverse, including increasing and decreasing phases, as well as sudden bursts of star formation caused by galaxy interactions. This method has been successfully used in Finlator et al. (2007) to analyze a sample of galaxies using hydrodynamic simulations and, recently, in Pacifici et al. (2012, hereafter P12) to reproduce evolutionary paths of low and high mass galaxies at using a template library derived from semi-analytical modeling (SAM) of a dark matter simulation. In this section we follow the latter approach to analyze the SFH of compact SFGs.
The details of the modeling procedure are described in P12. Briefly, the template library is based on SFHs and chemical enrichment histories for galaxies drawn from the Millenium cosmological simulation (Springel et al., 2005) as processed by the semi-analytical recipes of De Lucia & Blaizot (2007). The initial library is expanded in two ways: adding galaxies at randomly drawn stages of their evolution (i.e., not only at the default redshift given by the model); varying the SFR and metallicity of the galaxies in the last 10 Myr (defined as current SFR in P12) before the time of observation. The effect of these variations is similar to the addition of a recent burst or a sudden truncation of the SFR. The stellar populations are modeled using the latest version of the Bruzual & Charlot (2003) models with a Chabrier (2003) IMF and the two-phase dust attenuation recipe (birth clouds and ambient ISM) of Charlot & Fall (2000).
4.3.1 Overall results for SAM SFHs
On average, we find that the evolution of the best-fit SAM SFHs for compact SFGs is similar to that of a delayed model with a long -folding time, particularly at mid and late times (Figure 7). The key difference is that SAM SFHs present more gradual increase of the SFR during the rising phase at the onset of star formation. As a result, the best-fit stellar ages tend to be older than those of the models. The typical stellar ages for compact SFGs obtained with SAM SFHs range between Gyr, with a median value of Gyr. This is a factor of 2 older than the estimates of the models. Attending to these values, their formation redshifts would increase from in the models, to , suggesting that these galaxies are nearly maximally old. The age of the Universe at is 2.6 Gyr. Despite the longer duration of the increasing SFR phase in SAM SFHs, we again find very few galaxies () with rising SFRs at the epoch of observation. The majority of compact SFGs present, on average, either declining or roughly constant SFRs.
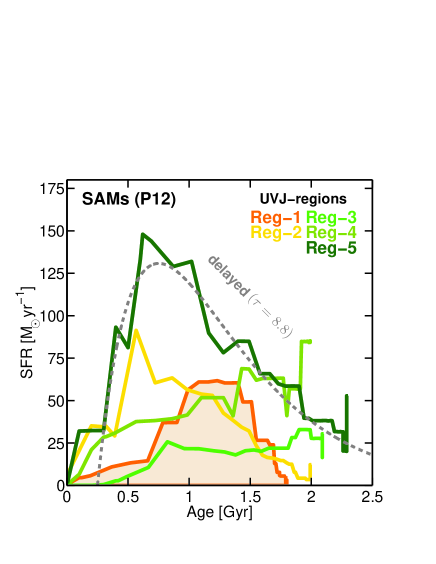
Figure 8 shows the averaged best-fit SFHs for compact SFGs in different regions of the UVJ diagram from Figure 3b. In § 4.1.1 we showed that fits of the SEDs of (low-sSFR) galaxies in region 1 with models required short formation timescales ( Myr). The best-fit SAM SFHs support this result by showing that these galaxies have, on average, a bell-shaped SFH with a FHWM of only 500 Myr (shaded orange area). The average SFHs of compact SFGs in other regions show longer duration. As a result, galaxies in region 1 are also younger (1.8 Gyr) than the average of other compact SFGs (2.1 Gyr). The fact that younger compact SFGs have lower sSFRs than the older ones (see also Figure 10) implies that, in this case, age correlates with sSFR, contrary to intuition. We note, however, that such correlations only apply when using constant or declining SFHs, and when comparing galaxies with the same formation timescale (). Figure 8 also illustrates that, although some SAM SFHs may resemble the evolution of a long- delayed model, in general, they display a broad range of trends in SFR vs. time, presenting phases of increasing, nearly constant, or rapidly decreasing SFR.
5. Evolutionary tracks of compact SFGs: linking progenitors to their descendants
In this section we study the evolutionary tracks of compact SFGs in the SFR–M and UVJ diagrams as inferred from their best-fit SFHs. In particular, we study the predictions of 3 different SFH models for the slope of the SFR–M correlation at early times (), and the duration of the main sequence phase for the compact SFGs. Then, we compare the galaxy number densities estimated from the forward extrapolation of these SFHs with the observed number density of quiescent galaxies, and thus verify the proposed evolutionary sequence between the 2 populations. Finally, we study the distribution of compact SFGs in the UVJ diagram as a function of stellar mass and extinction, and we discuss the implications for their formation timescales and their history of dust production and destruction.
5.1. Evolutionary tracks in the SFR-M diagram
The left panel of Figure 9 shows the distribution of compact SFGs in the SFR–M diagram based on SFRs and stellar masses (gray circles) derived from single models. The values derived from delayed models are very similar and thus are not shown. However, the predicted evolution on the diagram is not the same for each model. The light and dark blue lines illustrate the differences in the evolutionary tracks (from the onset of star formation until they become quiescent) of 3 compact SFGs fitted with single and delayed models, respectively. While both models present the same exponential decline of the SFR at late () times, the predicted slope of the SFR–M correlation at early times () is different. For delayed models, the slope, log(SFR)log(M), is , whereas for single models the SFR is nearly independent of the stellar mass, 0. Neither of these, however, appear to follow the steeper observed slope of the main sequence at and log(M/M⊙) (, e.g., Santini et al. 2009; Whitaker et al. 2012b) suggesting that these SFHs do not adequately reproduce the early phases of galaxy growth. If the SFR zero point of the main sequence keeps increasing at , it could explain a flatter slope for an evolutionary track that follows the main sequence as a function of time. However, the evolution of the SFR zero point since to is not strong enough to reproduce the flat evolutionary track of the single models (sSFR dex; Stark et al. 2009; Karim et al. 2011; Bouwens et al. 2012; Gonzalez et al. 2012). This suggest that an increasing SFR is more appropriate to reproduce the early phases of stellar mass growth (e.g., Maraston et al. 2010). In that regard, the tracks of the SAM SFHs (right panel of Figure 9) produce the best results, following more closely the observed slope of the main sequence at (see also Pacifici et al. (2013) for a similar result at ), presenting a steeper slope () than the delayed models. This difference arises from a more gradual increase of the SFR at early times ( Myr) in SAM SFHs (Figure 8).
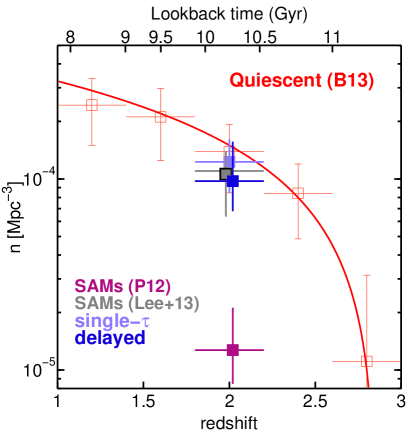
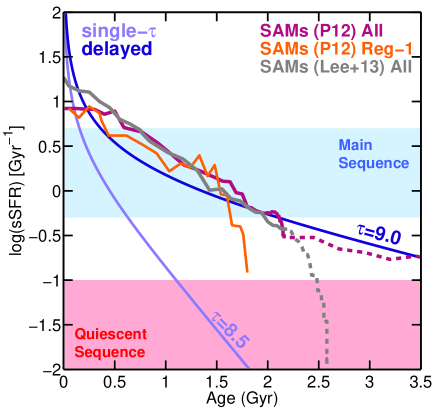
Figure 10 show the evolution of sSFR versus time for the different SFHs. The shaded regions indicate the approximate location of the star-forming main sequence and the quiescent sequence, defined a range in sSFR. The longer formation timescales of SAM SFHs compared to the models lead to a longer duration of the main sequence phase, Gyr (magenta/gray lines). To obtain a similarly long main sequence phase with delayed models, would require -folding times of 1 Gyr (dark-purple). However, the majority of compact SFGs are best fitted with much shorter timescales (300 Myr), which result in an average duration of the main sequence of Myr (light-purple line).
Not surprisingly, if we extrapolate the SFHs to estimate the quenching times, i.e., the time since the epoch of observation until the galaxy becomes quiescent (log(sSFR/Gyr-1)), , we also obtain significantly larger average values for the P12 SAM SFHs ( Gyr) compared to single ( Myr) and delayed ( Myr) models. We note however, that this trend is strongly dependent on the choice of the library of SAM SFHs. The P12 library was created for the analysis of local galaxies, and therefore favors long-lived SFHs, similar to those of main-sequence galaxies at . If we build a library of SEDs including only galaxies that have low sSFR (log(sSFR/Gyr-1)) at , the predicted quenching times became substantially shorter ( Myr; magenta vs. gray dashed lines in Figure 10). For this purpose, we used a slightly different SAM (Lee & Yi, 2013) because it allowed a simpler selection of the library of quenched galaxies by . As shown by the good agreement between the solid gray and magenta lines in Figure 10, the best-fit SFHs from this library and that of P12 are fully consistent. Only the forward evolution of the SFH differs. Individual examples of short SFHs can be found in the P12 library. For example, the orange line shows the rapid decline in the sSFR of compact SFGs in region 1 ( Gyr). However, if the galaxy presents a high current SFR, the P12 library usually favors a long-lived forward evolution over a short one.
Although this test shows that the extrapolated SFHs have limited predictive power (i.e., the results depend on the model choice), we can test if, assuming any of the previous SFHs, it is possible to reproduce the emergence of the quiescent population in terms of quenched compact SFGs . In B13 we showed that the number densities of these two populations are in good agreement for quenching times between Myr (see also Williams et al. 2013). Figure 11 shows that the single and delayed models predict number densities that are also consistent, or slightly lower, than the observed value. For SAM SFHs however there is a strong dichotomy depending on which template library we use. While the default (long-lived) templates under-predict the number density by more than an order of magnitude, the short-lived templates are in good agreement with the observations. If, as argued above, SAM SFHs are better at describing the evolutionary paths of compact SFGs, this implies that, to reproduce the emergence of the quiescent population, these galaxies would have to end their lives with a sharp truncation of the SFR on a short timescale compared to their average age (t Myr over Gyr; see also Stefanon et al. (2013) for a similar argument). This could indicate the action of a strong quenching mechanism triggered (or enhanced) by the transformation from the extended to the compact phase.
5.2. Evolutionary paths in the UVJ diagram
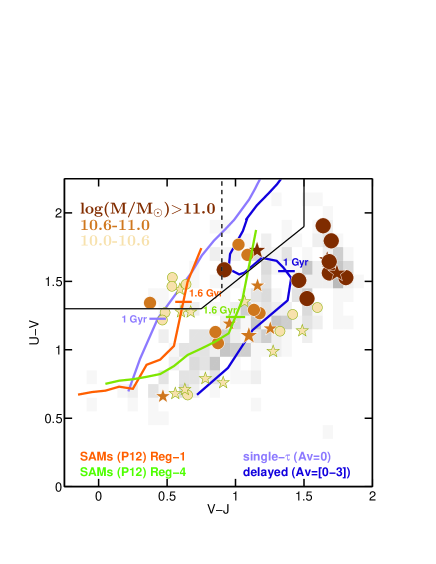
Figure 12 shows the UVJ diagram for compact SFGs color-coded by stellar mass. As discussed in § 3.2, we find a strong correlation between stellar mass and extinction (; see also Wuyts et al. 2011b; Brammer et al. 2011). We also find that nearly all compact SFGs in region 1 belong in the lowest stellar mass bin (log(M/M⊙)). As shown in the previous sections, these galaxies appear to have shorter formation timescales and younger ages than other compact SFGs. Recent studies of the stellar populations of quiescent galaxies at report a similar correlation between age and stellar mass (Whitaker et al. 2012a, 2013; Newman et al. 2013a). In those cases, however, the older galaxies are also more quiescent (i.e., with lower sSFRs and redder colors), whereas for compact SFGs, this correlation is reversed. The more massive (older) galaxies are forming stars more actively than the lower-mass ones. This result suggests that at least some low-mass compact SFGs arrive onto the red sequence before the more massive ones, thus populating faster the intermediate-to-low mass end of the quiescent stellar mass function (e.g., Tomczak et al. 2013).
We speculate that the age difference leads to different evolutionary tracks for compact SFGs in the UVJ diagram depending on their stellar mass. The more massive, long-lived SFGs undergo active star formation for a longer duration, thus gradually increasing the amount of dust (produced in supernovae and late phases of stellar evolution) and reaching higher levels of extinction. On the contrary, low-mass compact SFGs have shorter formation timescales and thus exhibit a smaller range of extinctions before shutting down star formation. Regardless of the final stellar mass, however, the amount of dust must decrease prior to quenching to be able to match the low extinction observed in quiescent galaxies.
To illustrate these possibilities, Figure 12 shows the evolutionary tracks for different SFHs with variable levels of dust extinction. For simplicity, we model the evolution of the extinction after the SFHs (i.e., the SFR). This parametrization reproduces, qualitatively, the observed correlation between SFR (mass) and obscuration, and leads to lower after quenching. Although this model is not exhaustive (see e.g., Zahid et al. 2013 for detailed modeling based on similar hypothesis) it provides a simple way to study plausible evolutionary tracks in the UVJ diagram. The light-purple line shows the simplest case of a single model with no extinction. The dark-purple line shows a delayed model where the dust-extinction ranges from to 3 mag. The orange and green lines show the color tracks based on the best-fit SAM SFHs for a compact SFG in region 1 and another one in region 4. In this case, we normalize the extinction to match the best-fit of the galaxies at the time of observation. The difference between these tracks is that the low-mass galaxy (orange) has a shorter star-forming phase, and thus reaches lower extinction levels and bluer VJ colors than the more massive galaxy (green). Each evolutionary track indicates the point where the galaxies are 1.6 Gyr old. At that age, the galaxy in region 1 is nearly quiescent, and un-obscured, while the galaxy in region 4 is still star-forming and has an mag. For comparison, the evolutionary tracks for single and delayed models with Myr reach the quiescent region earlier at ages of 1 Gyr.
Overall, the evolutionary tracks reproduce well the observed location in the UVJ diagram of the compact SFGs and their quiescent descendants. The only exceptions are the most extinguished galaxies in region 5, whose location on the UVJ diagram is, at least partially, the result of inclination effects (see § 3.2). We note also that a diminishing extinction level following the shutdown of star formation in the most massive galaxies is consistent with the observations of faint IR detections in UVJ-quiescent galaxies reported in previous works (Pérez-González et al. 2008b; Brammer et al. 2011). Similarly recent spectroscopic observations indicate that recently quenched galaxies span a broad range of rest-frame U-V colors, suggesting they can indeed arrive on the red sequence through a more dusty track (Bezanson et al. 2013).
6. The formation of compact SFGs
The remarkably small sizes of compact SFGs is among the strongest evidence in favor of their evolutionary connection to the quiescent population at . In B13 we speculated that such small sizes could be the result of strongly dissipational processes that reduce the effective radius of SFGs with more extended light profiles. Gas rich major mergers (Springel & Hernquist 2005; Robertson et al. 2006) or disk instabilities (DI; Dekel et al. 2009b; Ceverino et al. 2010) triggered by strong processes of gas accretion from the halo (Kereš et al. 2005; Dekel et al. 2009a) are plausible mechanisms. Recent results pointing out the paucity of major mergers at (Williams et al. 2011) and the low incidence of merging signatures on compact SFGs and quenched galaxies (Kaviraj et al. 2013b) seem to favor internal, self-regulated mechanisms like DI. However, direct evidence of the mechanisms responsible for the formation of compact SFGs remains to be found.
Cosmological simulations of galaxy formation provide a perfect framework to test different scenarios and make predictions about which galaxies are likely to experience significant structural transformations. In this section we present the results of 2 sets of theoretical models, namely: the recent SAMs of Porter et al. (2013a) and a set of hydrodynamical simulations described in Ceverino et al. (2010). Note that the SAMs discussed in this section are different from those used in § 4.3. The latter were preferred for the analysis of the stellar populations, as they were described and exhaustively tested for that purpose in Pacifici et al. (2012, 2013). However, the SAMs of Porter et al. (2013a) include new physical prescriptions critical for the formation of compact SFGs, and thus are more suitable for the study of structural evolution. We are now working to incorporate the new SAMs into the code used for stellar population analysis.
6.1. Compact SFGs in the SAMs of Porter et al. (2013)
A full description of the semi-analytic recipes and the accuracy of the models to reproduce observational trends at low and high redshifts is presented in Porter et al. (2013abc). Briefly, these SAMs are an extension of those presented in Somerville et al. (2008, 2012), which included prescriptions for radiative cooling, star formation, supernova and black hole feedback as well as chemical enrichment and galaxy mergers. A novel feature of the new version is the addition of dissipational processes, critical for the formation of spheroidal galaxies. In particular, these SAMs include a new treatment of gravitational perturbations that allows the formation of star-forming clumps and the triggering of disk instabilities. These result in the inward migration of gas and clumps to the center, making the galaxy more compact (Ceverino et al. 2012; Dekel et al. 2013). DIs are modeled using the Toomre (1964) instability criterion. If a galaxy exceeds the critical threshold, a fraction of the total stellar mass is removed from the disk and added to the central (bulge) component, thereby reducing the half-light (and half-mass) radius. Although a detailed characterization of the DI requires high-resolution simulations (see next section), the Toomre criterion allows one to quickly test a plausible formation scenario for compact SFGs which is consistent with the observational picture of unstable clumpy disks (Elmegreen & Elmegreen 2005b; Genzel et al. 2008; Förster Schreiber et al. 2009).
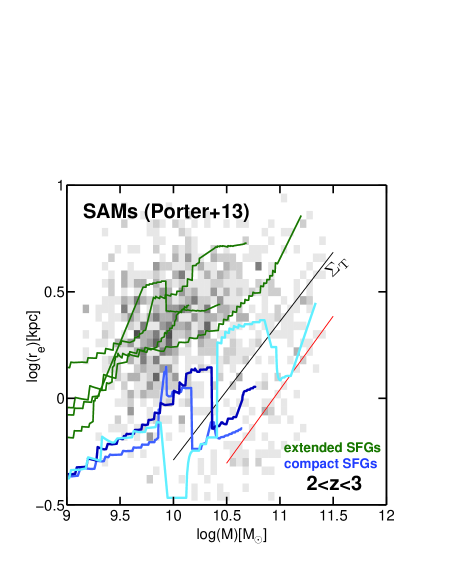
The left panel of Figure 13 shows the predicted evolutionary tracks in the mass-size diagram for 3 simulated galaxies that satisfy the compact SFG selection criteria at (blue lines). For comparison, we also show the tracks for a group of non-compact SFGs at the same redshift (green lines). All compact SFGs experience a significant shrinkage in effective radius of a factor of 2, increasing the mass surface density beyond the compactness threshold (dashed line). According to Porter et al. (2013c), all galaxies in the compact region are the result of a dissipational processes, either DIs (60%) or major mergers (40%). Overall, the remnants of DIs are 10% more compact than those of mergers, and thus are more efficient at populating the region of highest . In the SAMs, the contraction enhances the strength of the quenching mechanisms responsible for shutting down star formation. In particular, most compact SFGs quench on timescales of a few hundred Myrs as a result of quasar mode feedback. These numbers are consistent with the quenching timescales estimated in § 5.1.
An interesting prediction of the models is that the precursors of compact SFGs are usually among the smallest galaxies for a given stellar mass, even before the dissipational process, i.e., they are on the lower envelope of the mass-size relation for SFGs (Figure 13). They also present the highest sSFRs at a given mass, which combined with their small sizes, makes them more susceptible to the Toomre instability.
6.2. Compact SFGs in Hydrodynamic simulations
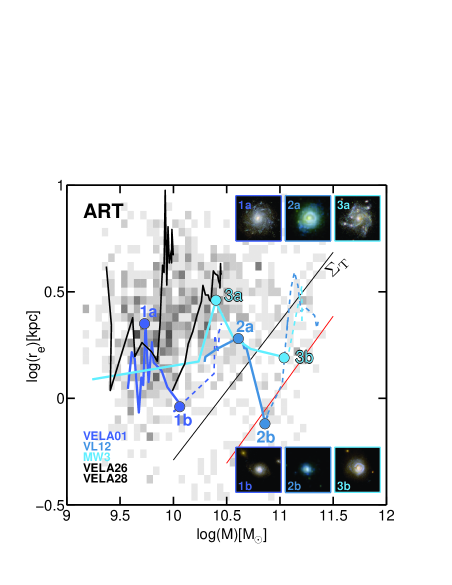
Hydrodynamic simulations provide a high-resolution view of the processes shaping galaxy structure (gas inflow, DIs, galaxy interactions, etc.), that is unavailable in the SAMs. Unfortunately, such detailed simulations require large computational efforts, which are only possible for small samples of 30–50 galaxies. Here we focus on a handful of galaxies drawn from the larger sample of Ceverino et al. (2010, 2013) and Dekel et al. (2013), computed with the Adaptive Refinement Tree (ART) code (Kravtsov et al. 1997) using spatial resolutions ranging between 17–75 pc (see Ceverino & Klypin (2009) for more details about the code). To ensure a fair comparison between models and observations, the structural properties of the simulated galaxies are measured using GALFIT on images processed to emulate the properties of the CANDELS data. This includes degrading the high-resolution simulations down to 0.06”/px, convolving with the PSF of the F160W image, and adding random noise to emulate the SNR of the real data (Mozena et al. 2013, in prep.).
The right panel of Figure 13 shows the evolutionary tracks of the simulated galaxies in the mass–size diagram. The blue lines depict the only 3 galaxies in the sample that present (at some point) a decrease in effective radii larger than a factor of 2, over a period of time of at least 300 Myr (i.e., we reject rapid fluctuations that last only for 1 or 2 simulation time steps). The shrinkage is large enough to be significant, and it is similar to the decrease in experienced by compact SFGs in the SAMs. For comparison, the black lines illustrate the evolution of other simulated galaxies showing milder size fluctuations. Interestingly, none of the 3 compact galaxies experienced a major merger. In all cases, the shrinkage appears to be the result of DIs. As a result, the star-forming clumps (clearly seen in the high-resolution images of Figure 13; Moody et al. 2013, in prep.), along with large amounts of gas, migrate inward due to dynamical friction and tidal torques generated by the unstable disk(e.g., Dekel et al. 2009b; Bournaud et al. 2011). In the center, the gas is turned into stars very efficiently causing a significant increase in the inner stellar mass (0.3–0.5 dex) at the same time that the size of the galaxy decreases. In the compact stage, the galaxies are more centrally concentrated and show no evidence of star-forming clumps. In terms of their light profiles, during and after the contraction, we find that the Sérsic index increases from low () to high (), spheroid-like values (see also Ceverino et al. 2013; Zolotov et al. 2013, in prep.). The whole transformation process from extended, clumpy disk to compact spheroid occurs on timescales of a few hundred Myr, i.e., of the order of the dynamical timescale of the disks (Ceverino et al. 2010; Cacciato et al. 2012). This is consistent with the scenario proposed in B13 in which new compact SFGs are being formed at a similar pace at which the existing ones are turning quiescent.
Based on analytic calculations, Dekel & Burkert (2013) showed that the process of disk contraction due to DIs is expected to happen for nearly half of the massive SFGs at . Such a high fraction results from a combination of high SFRs and continuous gas accretion common at these redshifts. The ratio of the timescales of these processes, (wetness parameter), controls the DI process. For the galaxy triggers a dissipative wet inflow, becoming more compact and centrally concentrated, whereas for lower values it forms the new stars in an inside-out growing disk. The duration of the DI phase determines if the galaxy shrinks enough to become a compact SFGs or if it grows in size again after the contraction (i.e., the mode). The answer to this question depends on the process that regulate star formation (internal quenching) and gas infall (halo quenching). For example, the version of the simulations used in this paper does not include the effects of radiation feedback, either from AGN or star formation, and thus galaxies are unlikely to experience a severe suppression of SFR (Dekel et al., 2013) after the shrinkage. In fact, all of them tend to re-grow an extended disk component. This is illustrated by the dashed lines in Figure 13, which show a rapid increase in effective radii of the compact SFGs shortly after the contraction. The relevance of these hydrodynamical simulations for compact SFG formation is thus the physics and duration of the event, not the total evolutionary picture.
7. Summary
1. We analyze the SFRs, structural properties, and stellar populations of 45 massive (log) compact SFGs at in GOODS-S to extend the results of Barro et al. (2013) and present further evidence that these galaxies are the natural progenitors of the compact, quiescent galaxies at .
-
•
Compact SFGs present heavily-obscured star formation based on their Spitzer/Herschel far-IR colors (71% and 44%/13% are detected in MIPS and PACS/SPIRE). As a group, they exhibit a higher fraction of X-ray detected AGN (47%) than more extended SFGs (12%) or quiescent galaxies (9%) at the same redshift and stellar mass. Such a high fraction implies that compact SFGs are typically in an active phase of black hole growth.
-
•
The distribution of compact SFGs in the SFR–M diagram extends from the normal main sequence (65%) to nearly the region occupied by quenched galaxies (30%). This result is consistent with the notion that these galaxies are in transit to become compact, quiescent galaxies. Only 2/45 compact SFGs lie above the SFR–M main sequence and they present far-IR SEDs typical of a starburst galaxy. Such a small fraction suggests that either the transition from star-forming to quiescent does not require an abrupt burst of star formation, or the starburst duty cycle is very short, 5% the duration of the main-sequence phase.
-
•
The transiting nature of compact SFGs is further supported by their location in the UVJ diagram, where most compact SFGs lie within the dusty, reddened region occupied by other massive SFGs, while those with lower sSFRs scatter off towards the quiescent region.
-
•
The radii, Sersic indices, axial ratios, and spheroidal morphologies of compact SFGs match well to those of the quiescent galaxies and indicate that they can directly evolve into the red population simply by shutting down their star formation.
-
•
The structural properties of compact SFGs are strikingly different from those of non-compact SFGs, which have disk-like morphologies and usually clumpy or irregular appearance. Under the assumption that galaxies grow both in stellar mass and size during the star-forming phase, the progenitors of massive (log), compact SFGs are probably among these extended SFGs. This suggests the need for a transformation mechanism to link the 2 populations that shrinks the size and transforms the structure of extended galaxies from disk to spheroid (see point 3.).
2. We study the stellar populations of compact SFGs using 2 sets of SFHs: 1) exponentially-declining (single and delayed) models, and 2) a library of physically-motivated SFHs extracted from SAMs. Qualitatively, both sets of SFHs produce similar results and trends; however,they differ in their quantitative predictions.
-
•
SAM SFHs predict longer formation timescales and older ages, Gyr (), which are nearly a factor of 2 older than the estimates of single, Gyr, and delayed, Gyr, models ().
-
•
Both sets of SFHs provide good SED fits. However, the predicted evolutionary tracks in the SFR–M diagram from SAM SFHs provide a better description of how compact SFGs evolve as a function of time, tracking more closely the observed slope of the main sequence and by remaining on it for 70% of their lifetime.
-
•
We find that some low-mass, compact SFGs (log(M/M⊙)) have younger ages and undergo active star formation for a shorter duration than more massive SFGs, suggesting that they arrive earlier onto the red sequence. Thus, we speculate that compact SFGs follow different evolutionary tracks on the UVJ diagram depending on their stellar mass. These tracks differ in the amount of dust extinction, whose amount vary according to the SFR: more massive galaxies increase their dust content gradually during a longer star-forming phase, thus reaching higher levels of extinction, whereas lower mass galaxies have shorter formation timescales and thus evolve (faster) on a lower extinction track.
-
•
Both sets of SFHs are able to reproduce the number density of compact quiescent galaxies at from compact SFGs quenching on timescales of Myr. In models, these quenching times are the result of a rapid assembly, Myr, whereas SAM SFHs predict a gradual assembly followed by an abrupt decay, shorter than the duration of the star-forming main sequence phase ( Gyr).
3. To analyze the proposed evolutionary sequence from extended to compact SFGs, we study the formation mechanisms of compact SFGs in theoretical models of galaxy formation.
-
•
The recent SAMs of Porter et al. (2013a) suggest that compact SFGs form only in strongly dissipational processes, such as major mergers or disk instabilities (DIs). However, DIs are more frequent (60% vs. 40%) and form the majority of the most compact remnants.
-
•
Compact SFGs formed in DIs are among the smallest SFGs of a given stellar mass before the contraction, and, after the DI, they experience a contraction in by a factor of 2.
-
•
We verify these SAM predictions by using the high-resolution hydrodynamic simulations of Ceverino et al. (2012) where we find 3 representative examples of compact SFGs formed in DIs. These galaxies experience a similar size shrinkage while changing their morphology from clumpy disk to centrally concentrated spheroid. This contraction is also in good agreement with recent predictions from Dekel & Burkert (2013) and Zolotov et al. (2013) for the of effect DIs.
Acknowledgments
We thank David Elbaz for very useful discussions. Support for Program number HST-GO-12060 was provided by NASA through a grant from the Space Telescope Science Institute, which is operated by the Association of Universities for Research in Astronomy, Incorporated, under NASA contract NAS5-26555. GB acknowledges support from NSF grant AST-08-08133. PGP-G acknowledges support from grant AYA2012-31277-E. This work has made use of the Rainbow Cosmological Surveys Database, which is operated by the Universidad Complutense de Madrid (UCM), partnered with the University of California Observatories at Santa Cruz (UCO/Lick,UCSC).
| ID | R.A. | DEC | -REF | X-ray | SFR | Mass | reff | U-V | V-J | Reg | G141 | ||||
|---|---|---|---|---|---|---|---|---|---|---|---|---|---|---|---|
| (1) | (2) | (3) | (4) | (5) | (6) | (7) | (8) | (9) | (10) | (11) | (12) | (13) | (14) | (15) | (16) |
| 21937 | 53.00658860 | -27.72416860 | 2.726 | 9 | 62 | - | - | 17 | 10.21 | 0.29 | 0.68 | 0.56 | 3 | A | |
| 14781 | 53.03332780 | -27.78257480 | 2.619 | 5 | 81 | 2206 | - | 192 | 10.60 | 1.00 | 1.14 | 1.49 | 4 | A([Oii]) | |
| 23382 | 53.16229880 | -27.71213490 | 2.433 | 1,2 | 534 | 80 | - | 2175 | 84 | 11.27 | 1.77 | 1.73 | 1.16 | 2 | A |
| 21662 | 53.05885220 | -27.72632930 | 2.180 | - | - | 155 | 1838 | - | 341 | 11.22 | 2.70 | 1.56 | 1.69 | 5 | B |
| 22069 | 53.10207860 | -27.72256120 | 2.610 | - | - | - | - | - | 3 | 10.45 | 0.33 | 1.53 | 0.54 | 1 | B |
| 22539 | 53.18736680 | -27.71918680 | 2.315 | 1,3 | - | - | - | - | 10 | 10.88 | 0.43 | 1.34 | 0.38 | 1 | A |
| 23896 | 53.10081420 | -27.71598590 | 2.303 | 1,2 | 326 | 49 | - | - | 32 | 10.87 | 1.40 | 1.19 | 0.96 | 4 | A |
| 25998 | 53.13757210 | -27.70010390 | 2.453 | 1,2 | - | 140 | 3359 | - | 365 | 10.90 | 0.95 | 1.27 | 1.18 | 4 | A |
| 26056 | 53.06325870 | -27.69964260 | 2.402 | 1,9 | 215 | 109 | - | - | 97 | 10.75 | 1.13 | 1.16 | 1.25 | 4 | B |
| 25879 | 53.03444580 | -27.69821010 | 2.474 | 8 | 37 | - | - | 19 | 10.54 | 0.47 | 1.10 | 1.10 | 4 | B | |
| 19298 | 53.01265220 | -27.74724370 | 2.573 | 9 | 93 | 12 | - | - | 25 | 10.76 | 0.49 | 1.28 | 0.67 | 1 | B |
| 20659 | 53.18283880 | -27.73491130 | 2.432 | 1,2,4 | - | 72 | - | - | 94 | 10.98 | 0.52 | 1.05 | 0.87 | 4 | A |
| 9834 | 53.14882690 | -27.82112070 | 2.576 | 7 | 588 | 5731 | 20669 | 391 | 11.06 | 2.43 | 1.42 | 1.16 | 4 | B | |
| 4150 | 53.05557910 | -27.87400810 | 2.560 | 3 | - | 78 | - | - | 160 | 11.28 | 2.57 | 1.58 | 0.92 | 2 | - |
| 9290 | 53.18622010 | -27.82519980 | 2.030 | - | - | - | - | - | 6 | 10.51 | 0.54 | 1.27 | 0.49 | 1 | A |
| 1883 | 53.16977920 | -27.90078740 | 2.673 | 4 | - | 33 | - | - | 86 | 10.37 | 0.83 | 0.67 | 0.65 | 3 | C |
| 2644 | 53.16450380 | -27.89038860 | 2.123 | 4 | 544 | 323 | - | - | 62 | 10.83 | 0.82 | 0.66 | 0.47 | 3 | A |
| 536 | 53.08917740 | -27.93046510 | 2.611 | 7 | 294 | 31 | - | - | 38 | 10.32 | 0.41 | 0.79 | 0.78 | 3 | B |
| 580 | 53.08732350 | -27.92954880 | 2.680 | - | 290 | 47 | - | - | 22 | 11.03 | 0.82 | 1.44 | 0.59 | 1 | C |
| 18475 | 53.10810690 | -27.75397980 | 2.728 | 1,6 | 359 | - | - | - | 20 | 10.44 | 0.33 | 1.28 | 0.60 | 1 | C |
| 3643 | 53.07600440 | -27.87816150 | 2.793 | 8 | 254 | - | - | - | 13 | 10.32 | 0.33 | 0.71 | 0.63 | 3 | B |
| 20790 | 53.17444810 | -27.73329980 | 2.576 | 2 | 564 | 7 | - | - | 93 | 10.20 | 0.38 | 0.76 | 0.91 | 3 | B |
| 1086 | 53.13717980 | -27.91583650 | 2.570 | - | - | - | - | - | 4 | 10.37 | 0.42 | 1.46 | 0.54 | 1 | B |
| 19143 | 53.02794410 | -27.74866340 | 2.300 | - | 123 | - | - | - | 12 | 10.57 | 1.16 | 1.35 | 1.07 | 4 | B |
| 26659 | 53.08446670 | -27.70418600 | 2.510 | - | - | - | - | - | 8 | 10.71 | 1.53 | 1.48 | 0.64 | 1 | B |
| 11701 | 53.09402810 | -27.80412630 | 2.560 | - | 147 | 792 | - | 442 | 11.16 | 1.27 | 1.66 | 1.67 | 5 | B | |
| 15614 | 53.14889600 | -27.77750460 | 2.070 | - | - | 64 | 1193 | - | 35 | 10.20 | 0.32 | 1.14 | 1.32 | 4 | A([Oiii]) |
| 26231 | 53.06500180 | -27.70001300 | 2.500 | - | - | - | - | - | 12 | 10.24 | 0.45 | 1.22 | 0.47 | 1 | B |
| 26211 | 53.06595180 | -27.70185220 | 2.110 | - | - | 153 | 1738 | - | 135 | 10.81 | 1.12 | 1.69 | 1.09 | 2 | C |
| 25952 | 53.12113620 | -27.69807510 | 1.970 | 1 | - | 91 | - | - | 57 | 10.63 | 0.74 | 1.13 | 0.85 | 4 | A |
| 3280 | 53.06061510 | -27.88237230 | 2.150 | - | - | 228 | 2724 | 7101 | 167 | 10.82 | 0.61 | 1.29 | 1.13 | 4 | - |
| 26612 | 53.07743450 | -27.70465270 | 2.080 | - | - | 40 | - | - | 30 | 10.76 | 0.75 | 1.31 | 1.60 | 4 | B |
| 22603 | 53.10701590 | -27.71822560 | 2.291 | 1,5 | 554 | 2323 | 7729 | 554 | 11.10 | 2.65 | 1.54 | 1.47 | 4 | B | |
| 15432 | 53.14614830 | -27.77988200 | 2.640 | - | 482 | 48 | - | - | 65 | 10.85 | 1.16 | 1.47 | 1.16 | 4 | B |
| 10973 | 53.18582930 | -27.80996560 | 2.583 | 4 | 593 | 47 | - | - | 316 | 10.76 | 0.39 | 0.99 | 1.27 | 4 | B |
| 7670 | 53.14817910 | -27.83916220 | 2.150 | - | - | 110 | 1755 | 7616 | 115 | 11.22 | 2.87 | 1.53 | 1.81 | 5 | C |
| 24367 | 53.14392700 | -27.67773850 | 2.420 | - | 475 | 78 | 1290 | - | 207 | 11.20 | 2.67 | 1.56 | 1.74 | 5 | B |
| 18562 | 53.02739130 | -27.75388610 | 2.040 | - | - | 67 | - | - | 34 | 11.28 | 2.97 | 1.91 | 1.64 | 5 | B |
| 14876 | 53.11879020 | -27.78281820 | 2.309 | 1,2 | - | 207 | 7068 | 28531 | 365 | 10.79 | 1.83 | 1.26 | 1.42 | 4 | B |
| 22883 | 53.14216250 | -27.70742850 | 2.150 | - | - | 176 | - | - | 75 | 10.82 | 1.77 | 1.77 | 1.02 | 2 | B |
| 22200 | 53.05424860 | -27.72164870 | 2.307 | 1 | - | 174 | 1549 | 8467 | 197 | 11.06 | 1.89 | 1.64 | 1.68 | 5 | B |
| 21901 | 53.12859620 | -27.72429960 | 2.020 | - | - | 91 | 1278 | - | 47 | 11.28 | 2.77 | 1.80 | 1.70 | 5 | B([Oiii]) |
| 26788 | 53.09951770 | -27.70616110 | 2.260 | - | - | 179 | 1094 | - | 117 | 11.08 | 2.17 | 1.37 | 1.52 | 4 | B([Oiii]) |
| 7579 | 53.14454840 | -27.83969560 | 2.050 | - | - | 128 | - | - | 96 | 11.14 | 2.64 | 1.51 | 1.46 | 4 | B |
| 15377 | 53.02228390 | -27.77890030 | 2.650 | - | 178 | 1531 | - | 108 | 11.10 | 1.79 | 1.63 | 1.22 | 2 | - |
Note. —
(1) General ID in Guo et al. (2013).
(2,3) R.A and Declination J2000.
(4) Photometric or spectroscopic redshift.
(5) Spectroscopic redshift from different references: 1) Barro, in prep (Keck MOSFIRE), 2) Kurk et al. (2013) [GMASS-2578,2443,2467,1989,2043], 3) Kriek et al. (2008), 4) Ballestra et al. (2010), 5) Silverman et al. 2010, 6) Wuyts et al. (2009), 7) Vanzella et al. (2008), 8) Stern et al in prep., 9) Szokoly et al. (2004).
(6) X-ray ID in Xue et al. (2011). The superscript index indicate degree of contamination on the SED from AGN emission based on the comparison to SED-fits that include AGN templates (See § 3.5). +: Severe. -: Mild.
(7,8,9) Far-IR fluxes in Spitzer/MIPS 24 m and Herschel/PACS 100 m and SPIRE 250 m.
(10) Total star formation rate (SFRUV+IR [M⊙yr-1]), see § 2.2.
(11) Stellar mass (log(M/M⊙)) determined from SED fitting using Bruzual & Charlot (2003), see § 2.2.
(12) Circularized, effective (half-light) radius (kpc) measured with GALFIT, see § 2.2.
(13,14) Rest-frame colors estimated from the best-fit stellar template using EAZY.
(15) Location of the galaxy in the regions of the diagram indicated in Figure 2.
(16) Qualitative flag for the G141 spectra: A) Highest signal-to-noise spectra, showing a continuum break and (occasionally) absorption lines, or a emission line ([Oii]or [Oiii]/H, indicated); B) Low signal-to-noise, absent continuum break, weak emission lines; C) Significant flux contamination or truncated spectrum.
Appendix A Testing AGN contamination in the SEDs
We fit the SEDs of the 21/45 X-ray detected compact SFGs galaxies with the AGN templates of Salvato et al. (2009, 2011) to identify a possible AGN contamination in the stellar SED. We find that 4 galaxies, best-fitted with Type I AGN templates, present strong continuum contamination from the non-stellar component and IRAC power-law slopes. Another 3 are fitted with composite Type 2/stellar templates suggesting that a minor AGN contamination could be possible. To test this effect we compare the stellar masses of the 21 galaxies derived from stellar templates with those of Santini et al. (2012) calculated using a combination of stellar and nuclear (Silva et al., 2004) components. In agreement with the previous analysis, we find a significant offset in the stellar masses (M⋆=0.3 dex) of the 4 aforementioned Type I AGNs, while for the other 3 galaxies the contamination is small, and the stellar masses differ by less than 0.1 dex. The left panel of Figure 14 illustrates the SED of a compact SFG with a significant (40%) AGN contribution to the SED. The right panel shows the SED of another X-ray detected compact SFG whose SED is well fitted by a pure stellar component. Based on the results of the SED fitting to hybrid stellar+AGN templates, we exclude the 4 strongly contaminated galaxies (indicated in Table 1) from the analysis in Sections 3 and 4.
Appendix B SFRIR+UV vs. SFR-model consistency
In the following we assess the agreement between SFRIR+UV and SFR-model for different SFHs. While SFRIR+UV is, arguably, the best SFR indicator for heavily obscured galaxies, SFR-model is tied to all other stellar properties (age, quenching time, etc.), and thus a fully consistent analysis of the galaxy properties requires a good match between both SFR indicators.


B.1. Constrained models
As shown in Wuyts et al. (2011a), the motivation for constraining the -folding time to be larger than Myr (i.e., rejecting quasi-instantaneous bursts) is to obtain a better agreement between SFRIR+UV and SFR-model. Otherwise, the SED fits tend to favor solutions with shorter formation timescales, which lead to SFR-model systematically lower than SFRIR+UV .
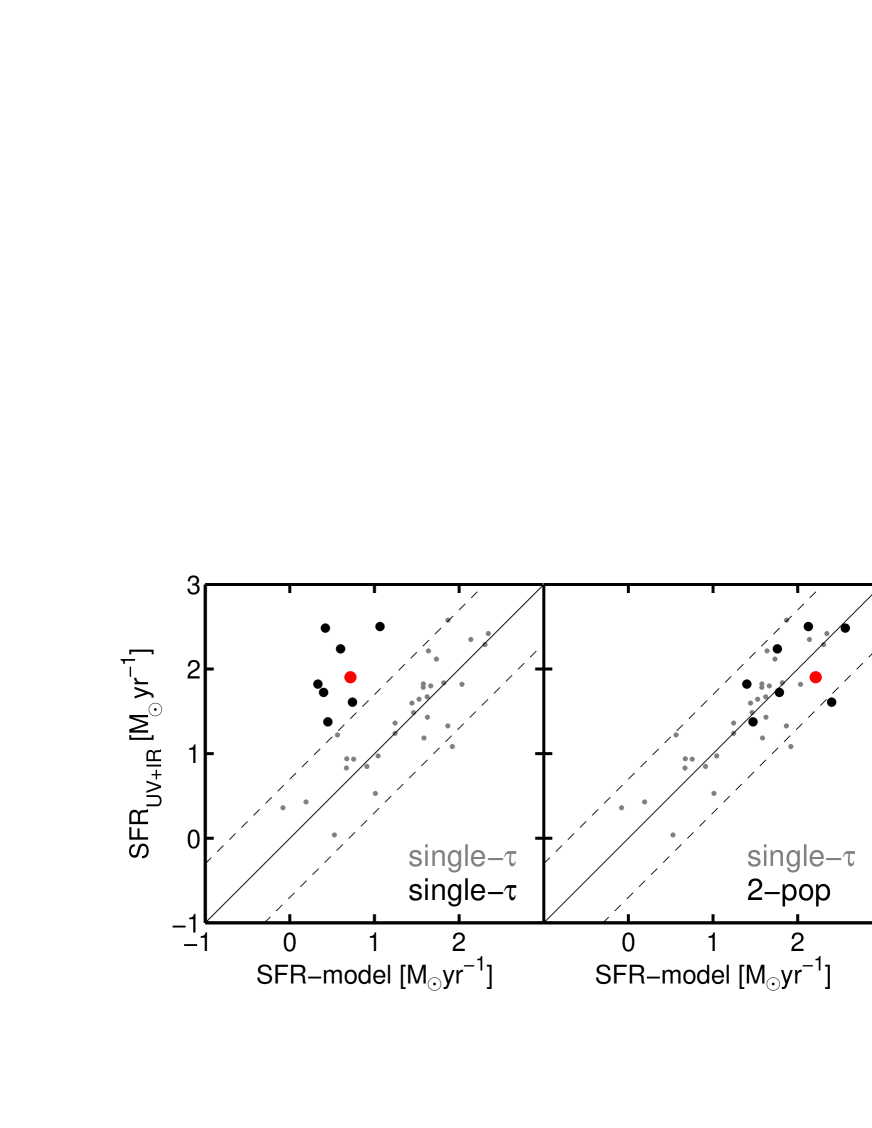
The left panel of Figure 15 shows the comparison of SFRIR+UV and SFR-model for compact SFGs based on constrained single models. Overall, the agreement is quite good, and the scatter is consistent with the typical uncertainties in SFRs ([SFR]0.39 dex; e.g., Daddi et al. 2007b). There are, however, a group of galaxies () which present significantly lower values of SFR-model compared to SFRIR+UV (SFR dex). These discrepancies have been reported in previous works, where the authors attributed to cases of high dust obscuration in which reddening saturates as extinction indicator (Santini et al. 2009; Reddy et al. 2010). In such cases, the Calzetti et al. (2000) attenuation law fails to provide a realistic approximation, and the additional reddening is compensated by the models aging the stellar populations, i.e., they are fitted with old stellar populations instead of young and dusty. We find the same systematic outliers if we use delayed models instead of single . These outliers are preferentially located in regions 2 (dusty + intermediate age) and 5 (highly obscured) of the UVJ diagram (Figure 1b).
The case of galaxies in region 5 (1.5) has been discussed in detail in Patel et al. (2012a), where the authors show that, in many cases, the high dust obscuration is largely driven by inclination effects. In agreement with this result, we find that compact SFGs in region 5 have small Sérsic indices and lower axis ratios, characteristic of edge-on disks (see § 3). The outliers in region 2 are mainly IR-detected galaxies located near the quiescent region of the UVJ diagram. Similar cases have been reported in other works (e.g., Brammer et al. 2011; Patel et al. 2012b), which suggest that the IR luminosity could be powered by either an obscured AGN, or the final stages of star formation in quenching galaxy. In our sample, 1 out of the 4 galaxies is an X-ray detected AGN, but neither that galaxy or any of the other 3 present present IRAC power-law SEDs or Spitzer/Herschel colors indicative of obscured AGNs activity. The outliers are always among the largest ( kpc), most massive compact SFGs, and their rest-frame UV emission appears to confined in a small central region. This could be signaling the fading of a nuclear burst, or perhaps that optical and IR emission are associated with physically distinct regions of the galaxy (e.g., an obscured surrounding component).
In order to reconcile the SFRIR+UV and SFR-model for the outliers, we first tried to use a different extinction law, namely Charlot & Fall (2000), which allows for a steeper (less gray) wavelength dependence than Calzetti, and thus increases the attenuation in the rest-frame UV. However, the best-fit ages obtained with approach were only marginally younger, and thus the values of SFR-model were still severely under-predicted. As an alternative approach to account for missing star formation, we modeled the SED of the outliers using two single models, that represent a intermediate-age, moderate extinction, underlying population, plus a young recent burst with younger age and higher obscuration (see e.g., Bell et al. 2003, Pérez-González et al. 2008a). In addition, we introduced the far-IR fluxes as a prior, by requiring that the absorbed UV-luminosity of the young burst matched the IR-emission from the heated dust within a factor of 2 (see e.g., da Cunha et al. 2008, 2010 for a similar approach). As shown in the central panel of Figure 15, the 2-population approach provides a better agreement between SFRIR+UV and SFR-model for the outliers, and therefore we adopted the best-fit stellar properties and SFRs estimated with this method for the analysis in § 5. Nevertheless, the most significant difference affected the SFR-model (SFR of up to 1.5 dex), whereas the masses and stellar ages (of the older component) changed by dex and dex, respectively.
The success of the 2-population approach to reconcile the apparent inconsistency between optical and far-IR SEDs could indicate that, at least for some galaxies, the SFHs are not as smooth as single models. In fact, in the hierarchical picture of galaxy formation, the SFHs are likely to be more stochastic due to discrete accretion events. The addition of a second population to the SFH provides a first order approximation to reflect at least the most recent of such events.
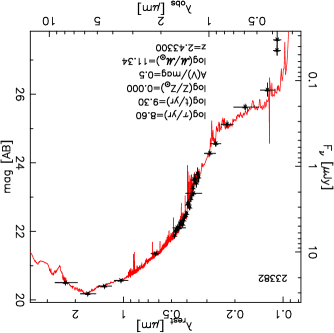
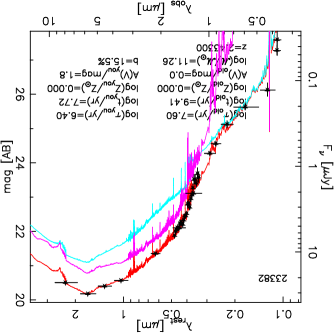
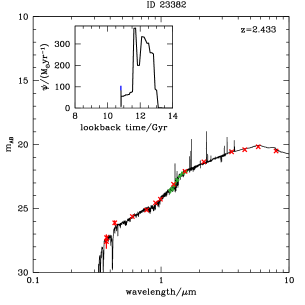
B.2. SAMs
Interestingly, using SAM SFHs, which include such stochastically, the agreement between SFRIR+UV and SFR-model is better than for single models. Although the overall scatter is slightly higher than in the single models ([SFR]0.43 dex), there are fewer systematic outliers (right panel of Figure 15). Attending to the SFHs of the outliers, we find that, in most cases (60%), the good agreement between SFRIR+UV and SFR-model is the result of a short burst of star formation in the last 10 Myr (right panel of Figure 16), similarly to the what we obtained using the 2 population approach. For the rest of the outliers, the values of SFR-model are higher because their overall SFHs present a longer duration of the actively star-forming phase and a slower decline of the SFR (i.e., a shallower slope) than the models (see e.g., Figure 7 or Figure 8). Consequently, the SFR remains high for a longer period of time.
References
- Ashby et al. (2013) Ashby, M. L. N., Willner, S. P., Fazio, G. G., et al. 2013, ApJ, 769, 80
- Baldry et al. (2004) Baldry, I. K., Glazebrook, K., Brinkmann, J., et al. 2004, ApJ, 600, 681
- Barro et al. (2013) Barro, G., Faber, S. M., Pérez-González, P. G., et al. 2013, ApJ, 765, 104
- Barro et al. (2011) Barro, G., Pérez-González, P. G., Gallego, J., et al. 2011, ApJS, 193, 30
- Bauer et al. (2011) Bauer, A. E., Conselice, C. J., Pérez-González, P. G., et al. 2011, MNRAS, 417, 289
- Bedregal et al. (2013) Bedregal, A. G., Scarlata, C., Henry, A. L., et al. 2013, ArXiv e-prints
- Bell et al. (2005) Bell, E. F., Papovich, C., Wolf, C., et al. 2005, ApJ, 625, 23
- Bell et al. (2012) Bell, E. F., van der Wel, A., Papovich, C., et al. 2012, ApJ, 753, 167
- Bezanson et al. (2013) Bezanson, R., van Dokkum, P., van de Sande, J., Franx, M., & Kriek, M. 2013, ApJ, 764, L8
- Bezanson et al. (2009) Bezanson, R., van Dokkum, P. G., Tal, T., et al. 2009, ApJ, 697, 1290
- Birnboim & Dekel (2003) Birnboim, Y. & Dekel, A. 2003, MNRAS, 345, 349
- Blain et al. (2002) Blain, A. W., Smail, I., Ivison, R. J., Kneib, J.-P., & Frayer, D. T. 2002, Phys. Rep., 369, 111
- Bournaud et al. (2011) Bournaud, F., Dekel, A., Teyssier, R., et al. 2011, ApJ, 741, L33
- Bournaud et al. (2007) Bournaud, F., Jog, C. J., & Combes, F. 2007, A&A, 476, 1179
- Bouwens et al. (2012) Bouwens, R. J., Illingworth, G. D., Oesch, P. A., et al. 2012, ApJ, 754, 83
- Brammer et al. (2008) Brammer, G. B., van Dokkum, P. G., & Coppi, P. 2008, ApJ, 686, 1503
- Brammer et al. (2012) Brammer, G. B., van Dokkum, P. G., Franx, M., et al. 2012, ApJS, 200, 13
- Brammer et al. (2011) Brammer, G. B., Whitaker, K. E., van Dokkum, P. G., et al. 2011, ApJ, 739, 24
- Bruce et al. (2012) Bruce, V. A., Dunlop, J. S., Cirasuolo, M., et al. 2012, ArXiv e-prints
- Bruzual & Charlot (2003) Bruzual, G. & Charlot, S. 2003, MNRAS, 344, 1000
- Buitrago et al. (2008) Buitrago, F., Trujillo, I., Conselice, C. J., et al. 2008, ArXiv e-prints
- Cacciato et al. (2012) Cacciato, M., Dekel, A., & Genel, S. 2012, MNRAS, 421, 818
- Calzetti et al. (2000) Calzetti, D., Armus, L., Bohlin, R. C., et al. 2000, ApJ, 533, 682
- Caputi (2013) Caputi, K. I. 2013, ApJ, 768, 103
- Carollo et al. (2013) Carollo, C. M., Bschorr, T. J., Renzini, A., et al. 2013, ApJ, 773, 112
- Cassata et al. (2011) Cassata, P., Giavalisco, M., Guo, Y., et al. 2011, ApJ, 743, 96
- Cassata et al. (2013) Cassata, P., Giavalisco, M., Williams, C. C., et al. 2013, ApJ, 775, 106
- Ceverino et al. (2010) Ceverino, D., Dekel, A., & Bournaud, F. 2010, MNRAS, 404, 2151
- Ceverino et al. (2012) Ceverino, D., Dekel, A., Mandelker, N., et al. 2012, MNRAS, 420, 3490
- Ceverino & Klypin (2009) Ceverino, D. & Klypin, A. 2009, ApJ, 695, 292
- Ceverino et al. (2013) Ceverino, D., Klypin, A., Klimek, E., et al. 2013, ArXiv e-prints
- Chabrier (2003) Chabrier, G. 2003, PASP, 115, 763
- Chang et al. (2013) Chang, Y.-Y., van der Wel, A., Rix, H.-W., et al. 2013, ArXiv e-prints
- Charlot & Fall (2000) Charlot, S. & Fall, S. M. 2000, ApJ, 539, 718
- Chary & Elbaz (2001) Chary, R. & Elbaz, D. 2001, ApJ, 556, 562
- Cheung et al. (2012) Cheung, E., Faber, S. M., Koo, D. C., et al. 2012, ArXiv e-prints
- Cisternas et al. (2011) Cisternas, M., Jahnke, K., Inskip, K. J., et al. 2011, ApJ, 726, 57
- Curtis-Lake et al. (2012) Curtis-Lake, E., McLure, R. J., Pearce, H. J., et al. 2012, MNRAS, 422, 1425
- da Cunha et al. (2008) da Cunha, E., Charlot, S., & Elbaz, D. 2008, MNRAS, 388, 1595
- da Cunha et al. (2010) da Cunha, E., Charmandaris, V., Díaz-Santos, T., et al. 2010, A&A, 523, A78
- Daddi et al. (2007a) Daddi, E., Alexander, D. M., Dickinson, M., et al. 2007a, ApJ, 670, 173
- Daddi et al. (2007b) Daddi, E., Dickinson, M., Morrison, G., et al. 2007b, ApJ, 670, 156
- Daddi et al. (2010) Daddi, E., Elbaz, D., Walter, F., et al. 2010, ApJ, 714, L118
- Daddi et al. (2005) Daddi, E., Renzini, A., Pirzkal, N., et al. 2005, ApJ, 626, 680
- Dahlen et al. (2013) Dahlen, T., Mobasher, B., Faber, S. M., et al. 2013, ApJ, 775, 93
- Davies et al. (2007) Davies, R. I., Müller Sánchez, F., Genzel, R., et al. 2007, ApJ, 671, 1388
- De Lucia & Blaizot (2007) De Lucia, G. & Blaizot, J. 2007, MNRAS, 375, 2
- Dekel & Birnboim (2006) Dekel, A. & Birnboim, Y. 2006, MNRAS, 368, 2
- Dekel et al. (2009a) Dekel, A., Birnboim, Y., Engel, G., et al. 2009a, Nature, 457, 451
- Dekel & Burkert (2013) Dekel, A. & Burkert, A. 2013, ArXiv e-prints
- Dekel et al. (2009b) Dekel, A., Sari, R., & Ceverino, D. 2009b, ApJ, 703, 785
- Dekel et al. (2013) Dekel, A., Zolotov, A., Tweed, D., et al. 2013, MNRAS, 435, 999
- Diamond-Stanic et al. (2012) Diamond-Stanic, A. M., Moustakas, J., Tremonti, C. A., et al. 2012, ApJ, 755, L26
- Djorgovski & Davis (1987) Djorgovski, S. & Davis, M. 1987, ApJ, 313, 59
- Donley et al. (2008) Donley, J. L., Rieke, G. H., Pérez-González, P. G., & Barro, G. 2008, ApJ, 687, 111
- Donley et al. (2007) Donley, J. L., Rieke, G. H., Pérez-González, P. G., Rigby, J. R., & Alonso-Herrero, A. 2007, ApJ, 660, 167
- Elbaz et al. (2007) Elbaz, D., Daddi, E., Le Borgne, D., et al. 2007, A&A, 468, 33
- Elbaz et al. (2011) Elbaz, D., Dickinson, M., Hwang, H. S., et al. 2011, A&A, 533, A119
- Elmegreen et al. (2008) Elmegreen, B. G., Bournaud, F., & Elmegreen, D. M. 2008, ApJ, 688, 67
- Elmegreen & Elmegreen (2005a) Elmegreen, B. G. & Elmegreen, D. M. 2005a, ApJ, 627, 632
- Elmegreen & Elmegreen (2005b) —. 2005b, ApJ, 627, 632
- Elmegreen et al. (2007) Elmegreen, D. M., Elmegreen, B. G., Ravindranath, S., & Coe, D. A. 2007, ApJ, 658, 763
- Fang et al. (2013) Fang, J. J., Faber, S. M., Koo, D. C., & Dekel, A. 2013, ApJ, 776, 63
- Finlator et al. (2007) Finlator, K., Davé, R., & Oppenheimer, B. D. 2007, MNRAS, 376, 1861
- Finlator et al. (2011) Finlator, K., Oppenheimer, B. D., & Davé, R. 2011, MNRAS, 410, 1703
- Fontana et al. (2009) Fontana, A., Santini, P., Grazian, A., et al. 2009, A&A, 501, 15
- Förster Schreiber et al. (2009) Förster Schreiber, N. M., Genzel, R., Bouché, N., et al. 2009, ApJ, 706, 1364
- Fumagalli et al. (2013) Fumagalli, M., Labbe, I., Patel, S. G., et al. 2013, ArXiv e-prints
- Fumagalli et al. (2012) Fumagalli, M., Patel, S. G., Franx, M., et al. 2012, ApJ, 757, L22
- Galametz et al. (2013) Galametz, A., Grazian, A., Fontana, A., et al. 2013, ApJS, 206, 10
- Genzel et al. (2008) Genzel, R., Burkert, A., Bouché, N., et al. 2008, ApJ, 687, 59
- Gobat et al. (2012) Gobat, R., Strazzullo, V., Daddi, E., et al. 2012, ApJ, 759, L44
- Gonzalez et al. (2012) Gonzalez, V., Bouwens, R., llingworth, G., et al. 2012, ArXiv e-prints
- Grogin et al. (2011) Grogin, N. A., Kocevski, D. D., Faber, S. M., et al. 2011, ApJS, 197, 35
- Guo et al. (2011) Guo, Y., Giavalisco, M., Cassata, P., et al. 2011, ApJ, 735, 18
- Guo et al. (2012) Guo, Y., Giavalisco, M., Ferguson, H. C., Cassata, P., & Koekemoer, A. M. 2012, ApJ, 757, 120
- Hopkins et al. (2006) Hopkins, P. F., Hernquist, L., Cox, T. J., et al. 2006, ApJS, 163, 1
- Hopkins et al. (2008) Hopkins, P. F., Hernquist, L., Cox, T. J., & Kereš, D. 2008, ApJS, 175, 356
- Ilbert et al. (2010) Ilbert, O., Salvato, M., Le Floc’h, E., et al. 2010, ApJ, 709, 644
- Karim et al. (2011) Karim, A., Schinnerer, E., Martínez-Sansigre, A., et al. 2011, ApJ, 730, 61
- Kartaltepe et al. (2012) Kartaltepe, J. S., Dickinson, M., Alexander, D. M., et al. 2012, ApJ, 757, 23
- Kauffmann et al. (2003) Kauffmann, G., Heckman, T. M., White, S. D. M., et al. 2003, MNRAS, 341, 54
- Kaviraj et al. (2013a) Kaviraj, S., Cohen, S., Ellis, R. S., et al. 2013a, MNRAS, 428, 925
- Kaviraj et al. (2012) —. 2012, ArXiv e-prints
- Kaviraj et al. (2013b) Kaviraj, S., Cohen, S., Windhorst, R. A., et al. 2013b, MNRAS, 429, L40
- Kennicutt (1998) Kennicutt, Jr., R. C. 1998, ARA&A, 36, 189
- Kereš et al. (2005) Kereš, D., Katz, N., Weinberg, D. H., & Davé, R. 2005, MNRAS, 363, 2
- Kirkpatrick et al. (2013) Kirkpatrick, A., Pope, A., Charmandaris, V., et al. 2013, ApJ, 763, 123
- Koekemoer et al. (2011) Koekemoer, A. M., Faber, S. M., Ferguson, H. C., et al. 2011, ApJS, 197, 36
- Kravtsov et al. (1997) Kravtsov, A. V., Klypin, A. A., & Khokhlov, A. M. 1997, ApJS, 111, 73
- Kriek et al. (2009a) Kriek, M., van Dokkum, P. G., Franx, M., Illingworth, G. D., & Magee, D. K. 2009a, ApJ, 705, L71
- Kriek et al. (2009b) Kriek, M., van Dokkum, P. G., Labbé, I., et al. 2009b, ApJ, 700, 221
- Kriek et al. (2011) Kriek, M., van Dokkum, P. G., Whitaker, K. E., et al. 2011, ApJ, 743, 168
- Krist (1995) Krist, J. 1995, in Astronomical Society of the Pacific Conference Series, Vol. 77, Astronomical Data Analysis Software and Systems IV, ed. R. A. Shaw, H. E. Payne, & J. J. E. Hayes, 349
- Krogager et al. (2013) Krogager, J.-K., Zirm, A. W., Toft, S., Man, A., & Brammer, G. 2013, ArXiv e-prints
- Kümmel et al. (2009) Kümmel, M., Walsh, J. R., Pirzkal, N., Kuntschner, H., & Pasquali, A. 2009, PASP, 121, 59
- Lacy et al. (2004) Lacy, M., Storrie-Lombardi, L. J., Sajina, A., et al. 2004, ApJS, 154, 166
- Laidler et al. (2006) Laidler, V. G., Grogin, N., Clubb, K., et al. 2006, in Astronomical Society of the Pacific Conference Series, Vol. 351, Astronomical Data Analysis Software and Systems XV, ed. C. Gabriel, C. Arviset, D. Ponz, & S. Enrique, 228
- Lee & Yi (2013) Lee, J. & Yi, S. K. 2013, ApJ, 766, 38
- Lee et al. (2009) Lee, S.-K., Idzi, R., Ferguson, H. C., et al. 2009, ApJS, 184, 100
- Magdis et al. (2012) Magdis, G. E., Daddi, E., Béthermin, M., et al. 2012, ApJ, 760, 6
- Magnelli et al. (2013) Magnelli, B., Popesso, P., Berta, S., et al. 2013, A&A, 553, A132
- Maraston et al. (2010) Maraston, C., Pforr, J., Renzini, A., et al. 2010, MNRAS, 407, 830
- McIntosh et al. (2013) McIntosh, D. H., Wagner, C., Cooper, A., et al. 2013, ArXiv e-prints
- Mullaney et al. (2012) Mullaney, J. R., Daddi, E., Béthermin, M., et al. 2012, ApJ, 753, L30
- Muzzin et al. (2013) Muzzin, A., Marchesini, D., Stefanon, M., et al. 2013, ArXiv e-prints
- Naab et al. (2009) Naab, T., Johansson, P. H., & Ostriker, J. P. 2009, ApJ, 699, L178
- Naab et al. (2007) Naab, T., Johansson, P. H., Ostriker, J. P., & Efstathiou, G. 2007, ApJ, 658, 710
- Newman et al. (2013a) Newman, A. B., Ellis, R. S., Andreon, S., et al. 2013a, ArXiv e-prints
- Newman et al. (2012) Newman, A. B., Ellis, R. S., Bundy, K., & Treu, T. 2012, ApJ, 746, 162
- Newman et al. (2013b) Newman, S. F., Buschkamp, P., Genzel, R., et al. 2013b, ArXiv e-prints
- Noeske et al. (2007) Noeske, K. G., Weiner, B. J., Faber, S. M., et al. 2007, ApJ, 660, L43
- Oser et al. (2010) Oser, L., Ostriker, J. P., Naab, T., Johansson, P. H., & Burkert, A. 2010, ApJ, 725, 2312
- Pacifici et al. (2012) Pacifici, C., Charlot, S., Blaizot, J., & Brinchmann, J. 2012, MNRAS, 421, 2002
- Pacifici et al. (2013) Pacifici, C., Kassin, S. A., Weiner, B., Charlot, S., & Gardner, J. P. 2013, ApJ, 762, L15
- Papovich et al. (2011) Papovich, C., Finkelstein, S. L., Ferguson, H. C., Lotz, J. M., & Giavalisco, M. 2011, MNRAS, 412, 1123
- Papovich et al. (2007) Papovich, C., Rudnick, G., Le Floc’h, E., et al. 2007, ApJ, 668, 45
- Patel et al. (2012a) Patel, S. G., Holden, B. P., Kelson, D. D., et al. 2012a, ApJ, 748, L27
- Patel et al. (2012b) Patel, S. G., van Dokkum, P. G., Franx, M., et al. 2012b, ArXiv e-prints
- Peng et al. (2002) Peng, C. Y., Ho, L. C., Impey, C. D., & Rix, H.-W. 2002, AJ, 124, 266
- Pérez-González et al. (2013) Pérez-González, P. G., Cava, A., Barro, G., et al. 2013, ApJ, 762, 46
- Pérez-González et al. (2010) Pérez-González, P. G., Egami, E., Rex, M., et al. 2010, A&A, 518, L15
- Pérez-González et al. (2008a) Pérez-González, P. G., Rieke, G. H., Villar, V., et al. 2008a, ApJ, 675, 234
- Pérez-González et al. (2008b) Pérez-González, P. G., Trujillo, I., Barro, G., et al. 2008b, ApJ, 687, 50
- Pforr et al. (2012) Pforr, J., Maraston, C., & Tonini, C. 2012, MNRAS, 422, 3285
- Poggianti et al. (2013) Poggianti, B. M., Moretti, A., Calvi, R., et al. 2013, ApJ, 777, 125
- Reddy et al. (2010) Reddy, N. A., Erb, D. K., Pettini, M., Steidel, C. C., & Shapley, A. E. 2010, ApJ, 712, 1070
- Robertson et al. (2006) Robertson, B., Bullock, J. S., Cox, T. J., et al. 2006, ApJ, 645, 986
- Rodighiero et al. (2010) Rodighiero, G., Cimatti, A., Gruppioni, C., et al. 2010, A&A, 518, L25
- Rodighiero et al. (2011) Rodighiero, G., Daddi, E., Baronchelli, I., et al. 2011, ApJ, 739, L40
- Salim et al. (2009) Salim, S., Dickinson, M., Michael Rich, R., et al. 2009, ApJ, 700, 161
- Salvato et al. (2009) Salvato, M., Hasinger, G., Ilbert, O., et al. 2009, ApJ, 690, 1250
- Salvato et al. (2011) Salvato, M., Ilbert, O., Hasinger, G., et al. 2011, ApJ, 742, 61
- Santini et al. (2009) Santini, P., Fontana, A., Grazian, A., et al. 2009, A&A, 504, 751
- Santini et al. (2012) Santini, P., Rosario, D. J., Shao, L., et al. 2012, A&A, 540, A109
- Saracco et al. (2010) Saracco, P., Longhetti, M., & Gargiulo, A. 2010, MNRAS, 408, L21
- Schaerer et al. (2011) Schaerer, D., de Barros, S., & Stark, D. P. 2011, A&A, 536, A72
- Shen et al. (2003) Shen, S., Mo, H. J., White, S. D. M., et al. 2003, MNRAS, 343, 978
- Silva et al. (2004) Silva, L., Maiolino, R., & Granato, G. L. 2004, MNRAS, 355, 973
- Smail et al. (1997) Smail, I., Ivison, R. J., & Blain, A. W. 1997, ApJ, 490, L5
- Somerville et al. (2012) Somerville, R. S., Gilmore, R. C., Primack, J. R., & Domínguez, A. 2012, MNRAS, 423, 1992
- Somerville et al. (2008) Somerville, R. S., Hopkins, P. F., Cox, T. J., Robertson, B. E., & Hernquist, L. 2008, MNRAS, 391, 481
- Springel & Hernquist (2005) Springel, V. & Hernquist, L. 2005, ApJ, 622, L9
- Springel et al. (2005) Springel, V., White, S. D. M., Jenkins, A., et al. 2005, Nature, 435, 629
- Stark et al. (2009) Stark, D. P., Ellis, R. S., Bunker, A., et al. 2009, ApJ, 697, 1493
- Stefanon et al. (2013) Stefanon, M., Marchesini, D., Rudnick, G. H., Brammer, G. B., & Whitaker, K. E. 2013, ApJ, 768, 92
- Stern et al. (2005) Stern, D., Eisenhardt, P., Gorjian, V., et al. 2005, ApJ, 631, 163
- Szomoru et al. (2011) Szomoru, D., Franx, M., Bouwens, R. J., et al. 2011, ApJ, 735, L22
- Szomoru et al. (2012) Szomoru, D., Franx, M., & van Dokkum, P. G. 2012, ApJ, 749, 121
- Targett et al. (2013) Targett, T. A., Dunlop, J. S., Cirasuolo, M., et al. 2013, MNRAS, 432, 2012
- Thomas et al. (2005) Thomas, D., Maraston, C., Bender, R., & Mendes de Oliveira, C. 2005, ApJ, 621, 673
- Toft et al. (2007) Toft, S., van Dokkum, P., Franx, M., et al. 2007, ApJ, 671, 285
- Tomczak et al. (2013) Tomczak, A. R., Quadri, R. F., Tran, K.-V. H., et al. 2013, ArXiv e-prints
- Toomre (1964) Toomre, A. 1964, ApJ, 139, 1217
- Tremonti et al. (2007) Tremonti, C. A., Moustakas, J., & Diamond-Stanic, A. M. 2007, ApJ, 663, L77
- Trujillo et al. (2007) Trujillo, I., Conselice, C. J., Bundy, K., et al. 2007, MNRAS, 382, 109
- Trump et al. (2013) Trump, J. R., Konidaris, N. P., Barro, G., et al. 2013, ApJ, 763, L6
- Trump et al. (2011) Trump, J. R., Weiner, B. J., Scarlata, C., et al. 2011, ApJ, 743, 144
- van der Wel et al. (2012) van der Wel, A., Bell, E. F., Häussler, B., et al. 2012, ApJS, 203, 24
- van der Wel et al. (2011) van der Wel, A., Rix, H.-W., Wuyts, S., et al. 2011, ApJ, 730, 38
- van Dokkum & Brammer (2010) van Dokkum, P. G. & Brammer, G. 2010, ApJ, 718, L73
- van Dokkum et al. (2008) van Dokkum, P. G., Franx, M., Kriek, M., et al. 2008, ApJ, 677, L5
- Wang et al. (2012) Wang, T., Huang, J.-S., Faber, S. M., et al. 2012, ApJ, 752, 134
- Whitaker et al. (2012a) Whitaker, K. E., Kriek, M., van Dokkum, P. G., et al. 2012a, ApJ, 745, 179
- Whitaker et al. (2011) Whitaker, K. E., Labbé, I., van Dokkum, P. G., et al. 2011, ApJ, 735, 86
- Whitaker et al. (2012b) Whitaker, K. E., van Dokkum, P. G., Brammer, G., & Franx, M. 2012b, ApJ, 754, L29
- Whitaker et al. (2013) Whitaker, K. E., van Dokkum, P. G., Brammer, G., et al. 2013, ArXiv e-prints
- Wild et al. (2010) Wild, V., Heckman, T., & Charlot, S. 2010, MNRAS, 405, 933
- Williams et al. (2013) Williams, C. C., Giavalisco, M., Cassata, P., et al. 2013, ArXiv e-prints
- Williams et al. (2011) Williams, R. J., Quadri, R. F., & Franx, M. 2011, ApJ, 738, L25
- Williams et al. (2010) Williams, R. J., Quadri, R. F., Franx, M., et al. 2010, ApJ, 713, 738
- Windhorst et al. (2011) Windhorst, R. A., Cohen, S. H., Hathi, N. P., et al. 2011, ApJS, 193, 27
- Wuyts et al. (2010) Wuyts, S., Cox, T. J., Hayward, C. C., et al. 2010, ApJ, 722, 1666
- Wuyts et al. (2012) Wuyts, S., Förster Schreiber, N. M., Genzel, R., et al. 2012, ApJ, 753, 114
- Wuyts et al. (2011a) Wuyts, S., Förster Schreiber, N. M., Lutz, D., et al. 2011a, ApJ, 738, 106
- Wuyts et al. (2011b) Wuyts, S., Förster Schreiber, N. M., van der Wel, A., et al. 2011b, ApJ, 742, 96
- Wuyts et al. (2007) Wuyts, S., Labbé, I., Franx, M., et al. 2007, ApJ, 655, 51
- Xue et al. (2011) Xue, Y. Q., Luo, B., Brandt, W. N., et al. 2011, ApJS, 195, 10
- Zahid et al. (2013) Zahid, H. J., Torrey, P., Kudritzki, R., et al. 2013, ArXiv e-prints