Long division unites - long union divides, a model for social network evolution
Abstract
A remarkable phenomenon in the time evolution of many networks such as cultural, political, national and economic systems, is the recurrent transition between the states of union and division of nodes. In this work, we propose a phenomenological modeling, inspired by the maxim ”long union divides and long division unites”, in order to investigate the evolutionary characters of these networks composed of the entities whose behaviors are dominated by these two events. The nodes are endowed with quantities such as identity, ingredient, richness (power), openness (connections), age, distance, interaction etc. which determine collectively the evolution in a probabilistic way. Depending on a tunable parameter, the time evolution of this model is mainly an alternative domination of union or division state, with a possible state of final union dominated by one single node.
pacs:
89.65.-s; 89.75.Da; 05.45.TpThis work is a network modeling of the social systems composed of a large number of entities in interaction whose existence is dominated by two major events: union and division. Union means unification of two or more nodes (of the network) into one. Division is the inverse process: one node splits into several ones. Union and division is one of the most visible social, economic, cultural and political phenomena in the course of the development of a large number of composite systems. Different countries, political or economic groups can be unified into one country or group. There are also plenty of examples of division of these unities. The recurrent character of this phenomenon is well summarized in the maxim “long union divides, long division unites”, consequence of the interplay of a pair of opposite tendencies in many evolutionary systems.
Union and division are veritable complex processes in which many factors are responsible of the consequences. A good example of this complexity is the cultural landscape of the world with the long history of birth, death and mutation of cultures through interaction (communication, influence etc.), unification and splitting of cultures which are in addition under very complicated and uncertain influence of demographic, genetic, economic, political, scientific and technological systems as well as of many accidental elements such as natural disasters, wars, environmental changes and so on. It is for this reason that the most suitable description of the stochastic evolution of this kind of systems is probabilistic modeling taking into account as many as possible the involved factors and interaction mechanisms.
We present here a phenomenological modeling of networks in which union and division of nodes are two dominating events determined in a probabilistic way by the nature and some general features of the nodes. One of the aims is to see what would be the destiny and the evolution characters of a network composed of nodes endowed with some general attributes allowing and influencing unification and division under given conditions, without enter into the fundamental principles, interactions and true mechanisms of the dynamics of the systems. The definition of network in this work has been inspired by the previous works on cultural networks cc -CPL1 where a culture is represented by a vector whose components are quantified by a limited number of values characterizing cultural features. The vectorial representation of the nodes certainly applies to many other systems. For example, in an economic network formed by companies (nodes), each company has several essential features such as richness or capital, size, activity domain, age, diversity, openness and so on. In a political network composed of parties and groups, each political group has its own characteristic features, the same in the worldwide networks formed by the countries, so on and so forth.
The phenomenological model of union and division has been used recently in a dual modeling of political opinion networksJul in which union and division are two dominating events happening in the subnetwork of political parties. In present work, we are interested in knowing the behavior of a network dominated by the interplay of union/division which occurs as a function of the natures and features of the nodes. In doing this, we have in mind some questions about, for example, whether or not it is possible for all nodes of a given network under reasonable conditions to merge into one, or what will be the equilibrium or stationary state in which the number of nodes is relatively unchangeable, and what are the necessary conditions if any for these evolutionary behaviors. We think that these questions are currently of interest because the globalization of economy, culture and politics becomes a more and more hot topic and raises different opinions in the worldghc ; rf ; CPL2 . We hope that this modeling of social systems, in spite of its simplification of the real world where every network is more or less open to the influence of others, can be helpful for the understanding of some aspects of the complex world around us and constitutes a starting point for further work with more realistic models.
Again, we would like to emphasize that in this probabilistic model, the mechanism of union and division is not imposed deterministically to the evolution. At each step of evolution, union or division may or may not happen, depending on the probability of occurrence (union, division or nothing) calculated according to the natures and features of the nodes.
Each node represents one social entity such as country, culture, political party, company etc. A link between two nodes represents the interaction between two entities. In the same way one characterizes, for example, a country or a culture by using the features such as language, religion, art, custom, political regime and economy, a quantity named ”identity” is introduced to characterize the nodes. Each node is randomly given an identity which is represented by a position in a dimensional space: () with where is the number of characteristic features we considered. In the simulation, we set . The identity distance between two nodes and is given by:
| (1) |
where . This distance represents the difference between nodes; similar nodes have small distance.
A quantity ”richness” is introduced to characterize the level and power of development and/or future cultural, economic and ideological production and growth. For a culture, this may be the size and the power of of its content (religion, art, language, literature, economy, education, sciences and technology etc.), the population of its carriers and so on. For a country, it can represent economic, political, cultural, military powers, life condition as well as the population etc. Larger value of richness represents higher level of development and power. We suppose that the richness is globally an increasing function of time. This is reasonable from the statistical point of view. In the present model, the time evolution of richness for a given node is given as follows:
| (2) |
where is its ingredient and its age. The ingredient of a node is introduced to characterize the diversity of a node. It is defined as the number of previous nodes that have merged into it.
The degree or number of connections of a node is a very important evolutionary feature. It characterizes the communication state, the openness, the ability and will of giving/receiving information, of the node. Nodes with larger degree have more chance to evolve than smaller degree and isolated nodes. The age of a node is the time period from its birth to the present time.
The two main processes of the time evolution are merging and splitting. If two nodes are connected, they can merge into one new node with probability proportional to the sum of their degrees, to the difference of their richnesses and inversely proportional to the identity distance , that is
| (3) |
where is the normalization constant, is the index of the randomly selected node and the index of its neighbor. is normalized over all the neighbors of node . In general, more the two linked nodes are open, more likely they are close to each other through the direct and indirect communications (links), and more likely they merge into one. After merging, a new node is born as a composite one characterized by the ”ingredient” . The total ingredient is then equal to the initial size of network and is conserved. The age of the new composite node is one. Its richness is supposed to be the sum of the richnesses of the two merged nodes:
| (4) |
implying a higher level of development and power of the composite nodes. We take the average value of two merged identities as that of the composite node. It is computed as follows:
| (5) |
The degree of the composite node is given by
| (6) |
where is the number of common neighbors of node and . In other words, the evolution of the network after merging is that all of the neighbors of merged node and will connect with the new composite node .
In our model, a randomly selected composite node with ingredient can split into new nodes with a probability given by:
| (7) |
is normalized by . We call this kind of splitting complete splitting. This splitting probability implies that: 1) composite nodes with larger ingredient are more likely to split; 2) older nodes are more likely to split than younger ones; 3) more communication and openness (larger ) facilitates the splitting; 4) nodes with higher level of development and power (richness) are less likely to split.
Notice that in Eq.(7) is an important tunable parameter for the dynamics. It implies that even an isolated composite nodes () can have a non zero chance to split if . This kind of single isolated nodes are quite frequent to the end of a union-dominating period (see Section 3 below) when the whole network is reduced to only one or two very big (large ingredient and richness) nodes. If , the evolution of the network possibly ends up with a single powerful node. This would be the definitive disappearance of the network and an eternal union. This point may be a philosophy-laden subject. Here we suppose that any single composite node should have a tendency of splitting driven by the opposite aspects of the different ingredients already unified in it, or by some intrinsic division forces. Hence we fixed in this work. But a future study of the evolution with different values of may be interesting since there may be an interplay between the splitting tendency of large , and and the union tendency of large richness according to Eq.(7).
After splitting, new nodes will inherit the richness from the split node. We suppose that the richness of each new node is the same as that of the split node. The identity of the new nodes has the same dimensional number and range as the split node, with randomly given feature values. The age of all new nodes is equal to one. In addition, the evolution of the network after splitting is that these new nodes are randomly connected with each other and with the neighbors of the split node with a constant probability .
It is worth noticing two conditions of time evolution in our simulation: 1) at a given time step, a composite node which has just been formed or a new node which has just split from a composite node must not be considered as candidate for another merging or splitting; 2) during the random selection of the nodes, if the chosen node has , the only possible event is merging. But if the chosen node is a composite one, merging and splitting are both possible. The decision is random with 0.5 probability for each possible event.
The initial condition of the simulation is a large number of nodes randomly connected with a constant probability . The nodes remaining unconnected will be selected randomly at each time step and connected to other nodes according to the principle of preferential attachment BA . When , the age of each node is , each node has a richness with ingredient .
Next, we will show some numerical results. The time evolution shows first of all a quasi-periodic behavior, an alternative domination of union and division state. For example, at the end of the first cycle, the number of nodes changes from the initial size to . This is defined as one cycle. Due to the non zero probability of splitting, the single node at the end of a cycle will sooner or later split. A new cycle begins. It is found that the network behaviors are similar in each cycle. The time evolution of different quantities we studied is described below.
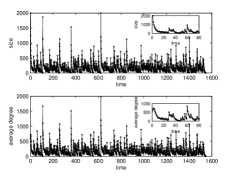
The time evolution of the network size (the number of nodes in network) and the average degree (the average number of each node’s neighbors) are shown in Fig.(1). The top picture shows dramatic variation in the size. We find the largest size at and , i.e., at the beginning of the first and second cycle, respectively. The smallest size occurs for and when these two cycles end. The merging and splitting processes are responsible for the oscillatory behavior of size evolution. In the bottom picture of Fig.(1), the average degree evolution is similar to that of size evolution. This is because the size and the total degree of the network both increase or decrease during the division- or union-dominating period. Examples of the periodic transition between union and division states do not lack in historical facts: the union and division of nations, dynasties, and economic or financial groups, etc.
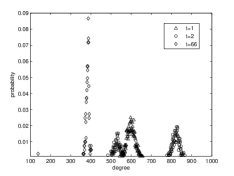
In Fig.(2), the degree distributions are given at (triangle), (circle) and (diamond). We see that the initial distribution () is a Poisson distribution with very sharp peak due to the random connections in the initial situation. At , after merging (no splitting happens at as no composite node exists), the distribution of one peak splits into two peaks: one is composed of the composite nodes with larger degree (the number of connection is increased from the merged nodes’ neighbors), another peak with smaller degree is composed of the composite nodes and the neighbors of merged nodes. The discontinuity of these two distributions means that the nodes are separated into two distinguished classes. In the later evolution, the merging in the group with big degree nodes causes the shift of the distribution to the smaller degree region. The shift is faster for the larger degree peak than for the smaller degree peak. The reason is that, according to the merging probability, the nodes with larger degree have larger merging probability than those with smaller degree all things being equal else. As a consequence, the two peaks merge into one at with a very sharp distribution. Hence during the whole evolution, when the dominated process is merging, the degree distribution undergoes a shift from large degree to small degree region. Inversely, when the dominated process is splitting, the shift is in opposite direction.
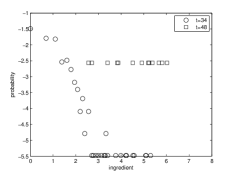
The ingredient distribution is shown in Fig.(3) with double-log scaling. Due to the merging, the ingredient of the composite node becomes larger than one and increases with time. There is no obvious regularity in its distribution at the first stages of the evolution, since the ingredient values are small. At , the distribution is close to a power law with fat tail marked by circle points, which implies that most of nodes have small ingredient, and few nodes have very large ingredient. Before , the merging is the dominating process resulting in the decreasing of nodes with small ingredient and the increasing of nodes with large ingredient. When , the power law distribution evolves into a uniform one marked by square points, different ingredients have the same probability to appear. In the following period, the splitting of the nodes with large ingredient is dominating and results in the increasing of nodes with small ingredient. The uniform distribution gradually evolves into power law distribution again. This transition of ingredient distribution between the power law and the uniform one is repeated continuously.
In Fig.(4) the lifetime (duration of existence of the nodes) distribution of this model is compared with two empirical ones we have established from the data of different kingdoms and dynasties in China china and in Europe european . The distributions are exponential (straight line in log-linear plot). The slopes of the straight lines are: (China), (European), and (our model). The agreement between the numerical result and the real data allows to determine the time scale of the model when it is applied to this kind of systems. For example, we find that the average lifetime of the model, the dynasties in China and in Europe are 2.1 steps, 14.3 years, and 19.4 years, respectively. This suggests that one time step in our model is equivalent to 6.8 years in the evolution of the dynasties of China, and 9.2 years in that of the European dynasties.

In summary, we proposed a phenomenological model of evolution of social networks with the aim of investigating the behavior and the fate of the networks whose nodes evolve with these two dominating events. This work revealed interesting evolutionary features, some of them being not expected before the simulation. For example, we expected stationary or equilibrium state of evolution with more than one nodes and constant values of certain quantities such as network size, degree etc. But this state seems impossible in present model. The evolution either terminates in a final union with the disappearance of the network and a single node, or never ceases a nonequilibrium and periodic evolution with fluctuating oscillation of network size and other quantities. The main features of the model can be summarized as follows:
1) The degree distribution is Poisson distribution at the beginning of the evolution. After this, there is a transition between a single continuous distribution and a discontinuous one with two peaks which means a separation of the nodes into two classes of connection state (openness) with large and small degree, respectively. 2) The ingredient distribution undergoes a periodic transition between power law distribution and uniform one. 3) The lifetime distribution is in exponential form. A mapping of time scale from our modeling to real systems could be made for the kingdoms and dynasties in China and Europe by comparing the numerical distribution to empirical data of lifetime we collected.
Besides the mechanisms of evolution reported in this paper, we also tried many others in order to compare their results. For example, we considered the age of links defined as the elapsed time from the born of a connection to its disappearance. We also considered simpler probability of merging proportional to the sum or the difference of two nodes’ degrees. The probability of splitting was also simplified to a simple proportion to the age of node. The results of the simulation with these different mechanisms are close to what we reported here with similar periodic fluctuating evolution of the network.
At last, we want to emphasis that the applicability of this model is limited with the social network where the local interaction is dominated in the evolution. It is not suitable for networks companied with global interaction or noise (i.e. random influences, which lead to the feature of nodes or dynamical evolution changes with a small probability). So further improvement of the model is possible in these networks. For instance, the merging of any pair of nodes or the splitting of any node may take place randomly with a small probability by some external influences.
References
- (1) Castellano C, Fortunato S and Loreto V, 2009 Rev. Mod. Phys. 81 591 %DOI:10.1103/RevModPhys.81.591
- (2) Axelrod R, 1997 J. Conflict Res, 41 203 %DOI:10.1177/0022002797041002001
- (3) Kuperman M N, 2006 Phys. Rev. E, 73 046139
- (4) Lanchier N, 2010 arXiv:1004.0365v1
- (5) Klemm K, Eguiluz V M, Toral R and Miguel M S, 2003 Physica A, 327 1 %DOI:10.1016/S0378-4371(03)00428-X
- (6) Klemm K, Eguiluz V M, Toral R and Miguel M S, 2003 Phys. Rev. E, 67 026120
- (7) Klemm K, Eguiluz V M, Toral R and Miguel M S, 2003 Phys. Rev. E, 67 045101
- (8) Klemm K, Eguiluz V M, Toral R and Miguel M S, 2005 J. Economic Dynamics Contral, 29 321 %DOI:10.1016/j.jedc.2003.08.005
- (9) Centola D, Avella J C G, Eguiluz V M and Miguel M S, 2007 J. Conflict Res, 51 905 %DOI:10.1177/0022002707307632
- (10) Toral R and Tessone C J, 2007 Communications in Computational Physics, 2 177 %DOI:http://www.arxiv.org/abs/physics/0607252
- (11) Evans T S and Plato A D K, 2007 Phys. Rev. E, 75 056101
- (12) Avella J C G, Eguiluz V M, Miguel M S, Cosenza M G and Klemm K, 2007 Journal of artificial societies and social simulation, 10 9 %DOI:http://jasss.soc.surrey.ac.uk/10/3/9.html
- (13) Avella J C G, Eguiluz V M, Cosenza M G, Klemm K, Herrera J L and Miguel M S, 2006 Phys. Rev. E 73 046119
- (14) Castellano C, Marsili M and Vespignani A , 2000 Phys. Rev. Lett 85, 3536
- (15) Lazaro C G, Lafuerza L F, Floria L M and Moreno Y, 2009 Phys. Rev. E 80 046123
- (16) Vilone D, Vespignani A and Castellano C, 2002 Eur. Phys. J. B 30 399
- (17) Sun K, Mao X M and Ou Y Q, 2002 Chinese Physics B, 11 1280
- (18) Wang R and Wang Q A, A dual model for opinion networks, 2011 Phys. Rev. E, 84 006100
- (19) Cornwell G H and Stoddard E W, 2001 Global Multiculturalism: Comparative Perspectives on Ethnicity, Race, and Nation, Rowman & Littlefield Publishers
- (20) Falk R, 1999 Predatory Globalization: A Critique, Princeton University, Polity Press %DOI:10.1177/146499340100100112
- (21) Chang Y F and Cai X, 2007 Chinese Physics Letters, 24 2430
- (22) Barabasi A L and Albert R, 1999 Science, 286 509
- (23) http://baike.baidu.com/view/224457.htm
- (24) http://zhidao.baidu.com/question/10662233.html