philippe.andre@cea.fr
Reconstructing the density and temperature structure of prestellar cores from Herschel data: A case study for B68 and L1689B
Utilizing multi-wavelength dust emission maps acquired with Herschel, we reconstruct local volume density and dust temperature profiles for the prestellar cores B68 and L1689B using inverse-Abel transform based technique. We present intrinsic radial dust temperature profiles of starless cores directly from dust continuum emission maps disentangling the effect of temperature variations along the line of sight which was previously limited to the radiative transfer calculations. The reconstructed dust temperature profiles show a significant drop in core center, a flat inner part, and a rising outward trend until the background cloud temperature is reached. The central beam-averaged dust temperatures obtained for B68 and L1689B are 9.3 K and 9.8 K, respectively, which are lower than the temperatures of 11.3 K and 11.6 K obtained from direct SED fitting. The best mass estimates derived by integrating the volume density profiles of B68 and L1689B are 1.6 and 11 , respectively. Comparing our results for B68 with the near-infrared extinction studies, we find that the dust opacity law adopted by the HGBS project, cm2 g-1, agrees to within 50% with the dust extinction constraints.
Key Words.:
ISM: individual objects (Barnard 68, L1689B) – ISM: clouds – ISM: structure – Stars: formation1 Introduction
Recent submillimeter observations with the Herschel Space Observatory (Pilbratt et al., 2010) and particularly the results obtained as part of the Gould Belt Survey (HGBS; André et al., 2010) have significantly improved our global understanding of the early stages of low-mass star formation. It is now becoming clear that the formation of prestellar cores is intimately related to the ubiquitous filamentary structure present in the cold interstellar medium (ISM) (Arzoumanian et al., 2011). One of the main objectives of the HGBS is to measure the prestellar core mass function (CMF) in nearby cloud complexes and to clarify the relationship between the CMF and the stellar initial mass function (IMF) on one hand and the link with the structure of the ISM on the other hand (cf. Könyves et al., 2010; André et al., 2010, for preliminary results).
An accurate determination of the prestellar CMF requires reliable estimates of core masses. In the context of the HGBS project, core masses are derived from dust continuum emission maps obtained with Herschel between 160 m and 500 m. Dust emission is almost always optically thin at these wavelengths and can thus act as a surrogate tracer of the total (gas dust) mass along the line of sight (LOS). This requires an assumption about the dust opacity in the submillimeter regime and reliable estimates of the dust temperature, . Herschel multi-wavelength data can be used to estimate through single-temperature greybody fits to the observed spectral energy distributions (SEDs) (cf. Könyves et al., 2010). A complication, however, is that such fits only provide the average temperature along the LOS and do not account for temperature gradients within the target sources. This is potentially a very significant problem when studying self-gravitating starless (or protostellar) cores with stratified density structures heated by an external or internal radiation field. The central temperatures of cold, starless cores, and sometimes their mass-averaged temperatures, can be overestimated due to the relatively strong emission from the screen of warmer dust in the outer layers of the cores, biasing core mass estimates to lower values (cf. Malinen et al., 2011). Likewise, temperature variations along the LOS may hamper the derivation of reliable density profiles for prestellar cores (e.g., Kirk et al., 2005; Ysard et al., 2012) using submillimeter emission maps (e.g., Kirk et al., 2005; Ysard et al., 2012). Radiative transfer calculations (e.g., Evans et al., 2001; Stamatellos et al., 2007) have been performed to predict the dust temperature profiles of starless cores whose outer surfaces are exposed to heating by the local interstellar radiation field (ISRF). These calculations generally find a significant drop in at the center of starless cores, but the actual magnitude of this temperature drop remained poorly constrained observationally before the advent of Herschel (see Ward-Thompson et al., 2002 for early results with ISO, however).
Here, we use Herschel observations to quantify the dust temperature gradient within two well-studied starless cores, B68 and L1689B. We introduce a simple yet powerful inversion technique based on the Abel integral transform to simultaneously reconstruct the 3D density and dust temperature profiles of dense cores using as inputs Herschel maps in four bands between 160 m and 500 m (also see Marsh et al., 2014 for an independent approach of solving similar problem). The basic goal of the present paper is to demonstrate the performance of the Abel inversion technique. We apply our algorithm to B68 and L1689B and compare the results with previous infrared extinction/absorption studies, which allows us to validate the dust opacity assumption made in earlier HGBS papers. We also test our technique on synthetic core models with known density and temperature profiles. While the method assumes spherically symmetric cores, we show that it yields satisfactory results for prolate or oblate ellipsoidal cores with realistic aspect ratios .
2 Herschel Observations of B68 and L1689B
As a part of the HGBS key project, two fields in the Pipe and Ophiuchus molecular cloud complexes containing B68 and L1689B, of areas and and observed for an integration time of 2.6 and 10.2 hours, respectively. These target fields were mapped111A more detailed description about the observations and data reductions are also available in the HGBS website: http://gouldbelt-herschel.cea.fr/archives. in two orthogonal scan directions at a scanning speed of 60″ s-1 in parallel mode, acquiring data simultaneously in five bands with the SPIRE (Griffin et al., 2010) and PACS (Poglitsch et al., 2010) bolometer cameras. The data were reduced using HIPE version 7.0. The SPIRE data were processed with modified pipeline scripts. Observations during the turnaround of the telescope were included, and a destriper module with a zero-order polynomial baseline was applied. The default ’naïve’ mapper was used to produce the final map. For the PACS data, we applied the standard HIPE data reduction pipeline up to level 1, with improved calibration. Further processing of the data, such as subtraction of (thermal and non-thermal) low-frequency noise and map projection was performed with Scanamorphos v11 (Roussel, 2012). Note that the Scanamorphos map-maker avoids any high-pass filtering which is crucial for preserving extended emission.
3 Description of the Abel inversion method
Consider a spherically symmetric core with radial density profile, , embedded in a uniform background and isotropic ISRF. Assuming optically thin dust emission, the specific intensity of the core when observed at impact parameter, , may be expressed as:
| (1) |
where and represent the background emission and instrumental noise, respectively, is the Planck function for the dust temperature at radius from core center, and is the frequency-dependent dust opacity222 Note the dust-to-gas fraction of 1% is implicitly included in our definition of the dust opacity (see also Sect. 3.1) so that represents the radial gas density of the object., here assumed to be uniform throughout the core. Given the symmetry of the problem, we can use the inverse Abel transform (e.g. Bracewell, 1986) to obtain the integrand of Eq. (1) at each observed frequency :
| (2) |
From Eq. 2, we see that the physical parameters of interest, and , only depend on the first derivatives of the radial intensity profiles. With a pre-defined assumption about the dust opacity law , one may thus estimate at each radius by fitting a single-temperature modified blackbody to the SED obtained from evaluating the right-hand side of Eq. (2) at each observed band between 160 m and 500 m (see Sect. 3.1 for further details). The density profile, , can be derived simultaneously from the normalization of the fit at each radius.
For simplicity, Eq. (1) above neglects the convolution with the telescope beam. However, simulations confirm that beam smearing has little effect in the case of well-resolved cores (see Appendix B). In the case of starless cores such as B68 and L1689B with a flat inner density profile inside a radius , or angular radius , we find that the beam effect can be parameterized by the ratio (where is the half-power beam width), and that for , as is the case for B68 and L1689B, the reconstructed column density profile agrees with the intrinsic profile within 20% (in the absence of noise). More generally, simulations indicate that, in the absence of noise, the reconstructed temperature and column density profiles essentially coincide with the corresponding intrinsic profiles convolved to the effective beam resolution (see Appendix B). Importantly, our Abel inversion technique does not depend on the subtraction of a flat background level as the derivative of a constant background333 If the background is not flat, the input data can be pre-processed by subtracting e.g., a linear plane. does not contribute to the integral of Eq. (2). The reconstruction is, however, quite sensitive to noise fluctuations in the outer parts of the core.
3.1 SED fitting and profile reconstruction
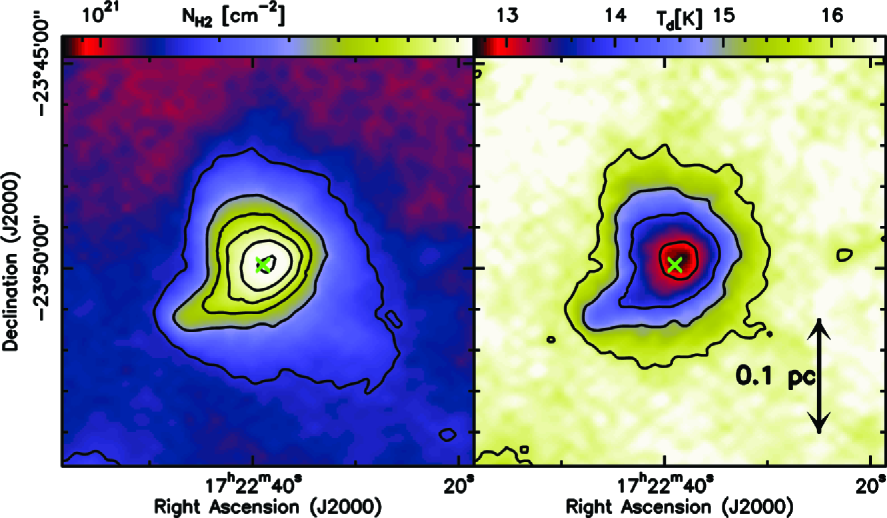
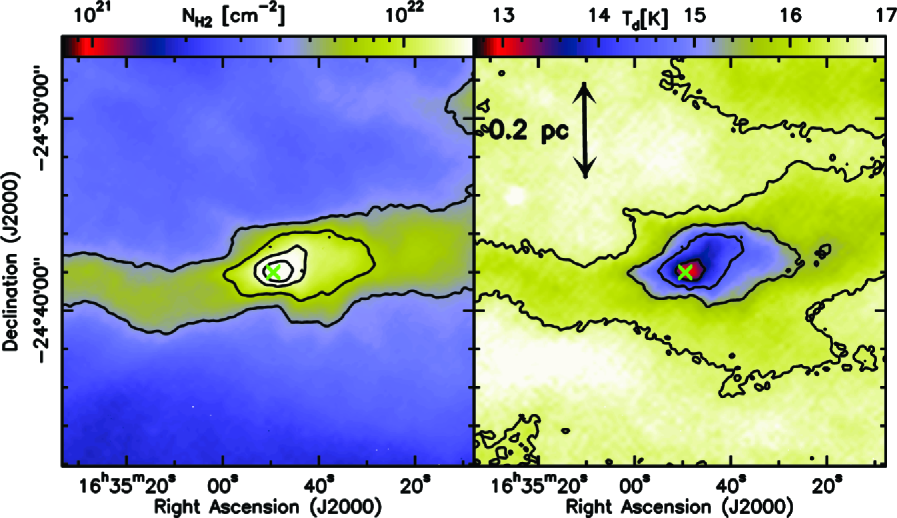
Column density and corresponding LOS-averaged dust temperature maps are shown in Fig. 1 and Fig. 3 for B68 and L1689B, respectively. They were obtained by fitting modified blackbody functions to the Herschel SEDs longward of 160 m on a pixel-by-pixel basis as in earlier HGBS papers (Könyves et al., 2010; see also Hill et al., 2011 for HOBYS). While fitting the SEDs, we weighted each data point by the corresponding calibration errors at SPIRE (%) and PACS (%) wavelengths. Appropriate zero-level offsets were added to each image (see Table 1), obtained by correlating the Herschel data with the Planck and IRAS data of the same fields (see Bernard et al., 2010). The same dust opacity law as in earlier HGBS (see also Motte et al., 2010 for the HOBYS key program) papers is adopted in the present paper (similar to Hildebrand, 1983): cm2 per g (of gas dust), with a dust emissivity index of . Our dust opacity value at the normalizing wavelength is also close to the Ossenkopf & Henning (1994) opacity model for dust grains with thin ice mantles. A mean molecular weight is assumed444Note that this differs from the first HGBS papers (e.g. André et al., 2010; Könyves et al., 2010; Arzoumanian et al., 2011) where was assumed and column density was expressed in units of mean free particles per cm2. to express column density in units of molecules per cm2. Using our adopted dust opacity law, we find that even the central LOSs for B68 and L1689B with 5 cm-2 has small optical depths 0.08 at 160 m, confirming that the core emission is optically thin longward of 160 m.
The same assumptions have been adopted for the modified blackbody fits required at each radius by the Abel inversion technique. A single-temperature description of the SEDs is suitable in this case because we are sampling local density and dust temperature at a given radius . Prior to SED fitting, the Herschel data are convolved to a common resolution of either 363 (i.e., HPBW resolution of SPIRE at 500 m) or 249 (i.e., HPBW resolution of SPIRE at 350 m, when the 500 m data are not used). At each wavelength, a circularly-averaged intensity profile about core center is first derived from the Herschel data, and the derivative of this average profile is then numerically evaluated and integrated over the kernel shown in the right-hand side of Eq. (2). The central position of the core is obtained from fitting a 2D-Gaussian model to the column density map (see the cross symbols in Fig. 1 and Fig. 3 for B68 and L1689B, respectively). The integration is performed up to an outer radius corresponding to 2–2.5 times the diameter of the core as estimated from the 2D-Gaussian fit to the column density map. In practice, the integral on the right-hand side of Eq. (2) converges rapidly and does not depend much on the precise value of the integration outer radius so long as it encompasses the entire core – see Appendix A and Fig. 5.
3.2 Assessment of uncertainties
The errors bars on the reconstructed profiles at each radius can be estimated from the standard deviations of the density and temperature profiles obtained by repeating the Abel reconstruction along different angular directions around the source (i.e., averaging the data separately over a series of angular sectors instead of circularly-averaging the data). In the case of the reconstructed profiles of B68 and L1689B shown in Fig. 2 and Fig. 4, sixteen equally-spaced angular sectors were used to derive the error bars. The errors we report on the best estimates of the (column) density and temperature at core center correspond to the standard error in the mean, , where is the number of independently measured sectors.
The uncertainty in the normalization of the dust opacity law directly affects the column density estimates but not the temperature estimates, whereas the uncertainty in the emissivity index influences both the dust temperature and the column density estimates in an anti-correlated fashion. When is varied from 2 to 1.5, for instance, the dust temperature increases by 10% and the column density decreases by 40%. The uncertainty in the central position of the core also introduces errors on the derived parameters. To assess the magnitude of this effect in the case of B68, we varied the central position within a radius of 6″, and found that the resulting central dust temperature and central column density had standard deviations of 0.3 K, and 0.04 cm-2, respectively. Besides, departures from spherical symmetry due to, e.g., asymmetries in the density distribution (cf. L1689B in Fig. 3) or an anisotropic background radiation field (cf. Nielbock et al., 2012) may break the symmetry of the quantity in Eqs. (1) and (2), introducing additional errors. The latter are in principle included in the error bars estimated from the fluctuations of the radial profiles reconstructed along various angular directions. Moreover, we show in Appendix B that cores with moderate departures from spherical symmetry (such as prolate or oblate ellipsoidal cores with aspect ratios ) can be reconstructed with reasonable accuracy.
For both B68 and L1689B, the net measurement errors in the derived central and values are estimated to be 0.5 K and cm-2, respectively, excluding the systematic uncertainties associated with our assumptions on the dust opacity and the calibration errors. In Appendix B.1 we show that the calibration errors lead to an additional uncertainty of 12% on column density and 5% on temperature estimates.
| Target | 160 m | 250 m | 350 m | 500 m |
|---|---|---|---|---|
| B68 | 91.2 | 77.0 | 41.6 | 16.6 |
| L1689B | 89.3 | 136.3 | 64.4 | 26.6 |
4 Detailed results for B68 and L1689B
4.1 B68 core
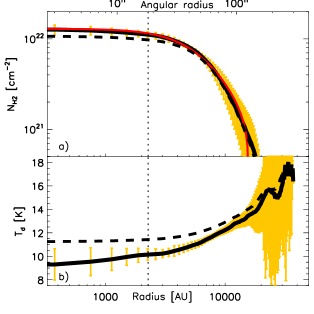
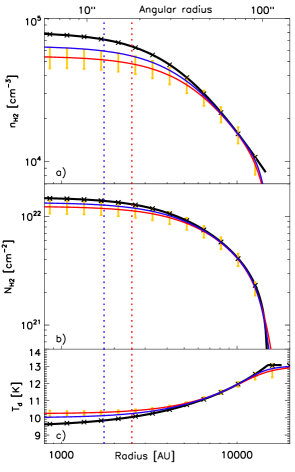
B68 is a well studied isolated bok globule in the Pipe nebula cloud complex (e.g. Alves et al., 2001; Nielbock et al., 2012). We adopt a distance of 125 pc (de Geus et al., 1989) for the present study. Figure 2 shows the reconstructed column density and temperature profiles obtained from our Herschel observations of B68 with the Abel inversion method described in Sect. 3.
In Fig. 2b, the Abel-inverted radial dust temperature profile (solid curve) is compared with the LOS-averaged SED temperature profile (dashed curve). While both temperature profiles exhibit similar features, with a broad minimum around the core center, a positive gradient outside the flat inner plateau of the column density profile, and similar values ( 16.52 K) at large radii, the minimum Abel-reconstructed temperature at core center is K lower than the minimum SED temperature observed through the central LOS. Accordingly, the central column density derived with the Abel inversion method (1.3 0.1 cm-2) is 30% higher than the LOS-averaged column density of 1.0 cm-2 derived from standard SED fitting for the central LOS. The difference between the Abel-reconstructed and the LOS-averaged column density becomes negligible in the outer parts of the core. This is indicative of stronger temperature variations along the central LOS compared to the outer LOSs.
Recently, Nielbock et al. (2012) constrained the dust temperature and volume density profiles of B68 using an iterative approach based on 3D radiative transfer modeling of multi-wavelength dust continuum data including Herschel observations obtained as a part of the EPoS (Launhardt et al., 2013) key project. They employed a 3-dimensional grid of Plummer-like (Plummer, 1911) density profiles and obtained initial guesses of the parameters from LOS-averaged SED fits. Altogether their model was tuned with eight free parameters, yielding a central dust temperature of = 8.2 K. The primary reason for the dispersion in the central dust temperature in Nielbock et al. (2012) is the uncertainty of a factor of on the dust opacity in the infrared regime. Although we obtain a higher central dust temperature, =9.3 K, with our Abel-inversion method, our results agree with the Nielbock et al. analysis within the range of the quoted uncertainties.
Based on extinction measurements (Alves et al., 2001), the column density profile of B68 closely resembles that of a Bonnor-Ebert (BE) (e.g., Bonnor, 1956) isothermal sphere with a flattened inner region. The overplotted red curve in Fig. 2 shows the best-fit BE model to the reconstructed column density profile. The best-fit BE parameters along with the physical properties that follow directly from the fit such as the radius of the flat inner plateau, , the density contrast, , and the external pressure, , are summarized in Table 2. They are consistent with the BE parameters found by Alves et al. (2001).
The column density profile obtained by integrating the Abel-inverted volume density profile is shown in Fig. 2. This can be directly compared with the near-infrared extinction results Alves et al. (2001) because extinction traces material independently of temperature. For this comparison, we adopted a standard conversion factor, / of 9.4 cm-2 mag-1 (Bohlin et al., 1978), to translate column density to equivalent visual extinction at low column densities (i.e., ). For higher column densities, we used the conversion /= 6.9 cm-2 mag-1 given by Draine (2003), and later on adopted by Evans et al. (2009), consistent with an extinction curve with a total-to-selective extinction, /, appropriate in higher density regions.
Using the Bohlin conversion factor, we obtain an of 3.2 mag at a radius of 104 AU, agreeing within 60% with the value of 5 mag reported by Alves et al. (2001) at the same radius. Furthermore, if we correct our estimate for the weak empirical trend between submillimeter dust opacity and column density, 0.28, inferred by Roy et al. (2013) in the regime and interpreted as evidence of dust grain evolution, then we find a corrected column density , equivalent to a corrected mag, in excellent (10%) agreement with Alves et al. (2001) at 104 AU.
Using the Draine conversion factor, we derive an of 192 mag through the center of the B68 core compared to the of 30 mag obtained from extinction by Alves et al. (2001), corresponding to a 60% agreement. However, the effective angular resolution of the Alves et al. extinction map was about 10″, approximately four times higher than the beam resolution (363) of SPIRE at 500 m. For better comparison, we performed a similar Abel reconstruction analysis at the beam resolution (249) of the SPIRE 350-m observations, ignoring the 500 m data. In this case, the central Abel-reconstructed column density corresponds to mag, which agrees within 50% with the results of Alves et al. (2001). (The central dust temperature derived at 350-m resolution coincides within the uncertainties with the 500-m resolution estimate.)
Likewise, the total mass of 1.60.07 derived by integrating the Abel-reconstructed density profile of B68 within the outer radius of 1.4 AU agrees within 30% with the mass of 2.1 obtained by Alves et al. (2001) from extinction data. For comparison, the mass derived from fitting a modified blackbody to the integrated flux densities is 1.40.05 . The latter does not account for temperature variations along the LOS, and thus slightly underestimates the intrinsic total mass of the core. However, we stress that, for a moderate density core such as B68, the global SED temperature (12.5 0.1 K here) is close to the mass-averaged dust temperature and the SED mass agrees within with the Abel-reconstructed mass.
Using the above results on the density and temperature structure we can check the energy balance of the B68 core. Assuming optically thin submillimeter emission, a total output luminosity of 0.350.04 is obtained by integrating the quantity over the volume of the core. A very similar output luminosity (0.410.05 ) is estimated by integrating the observed SED over wavelengths. These output estimates should be compared to the input luminosity of 0.40 provided to the core by the local ISRF (Mathis et al., 1983; with 1), calculated from the total ISRF flux density absorbed555The ISRF energy is mostly absorbed at short wavelengths (0.095 m to 100 m). In calculating the absorbed energy we adopted the dust absorption model of Draine (2003) with =3.1. by a spherical object with the same density profile and outer radius as B68 using Eq. 4 of Lehtinen et al. (1998). Note that the above three luminosity values agree with one another.
| Source | 666 and denote central density and density at the outer surface of the BE sphere, respectively | cs777 Isothermal sound speed | 888Flat inner radius, defined as | ||||
| profile | (km s-1) | (K cm-3) | (AU) | (AU) | (cm | ||
| B68 | 7.00.1 | 17 | 0.17 | 3.9 | 4.4 | 1.5 | 8.3 |
| L1689B-C | 16.60.7 | 145 | 0.27 | 2.9 | 4.5 | 3.7 | 20 |
| L1689B-NS | 13.50.3 | 88 | 0.24 | 3.2 | 4.4 | 2.9 | 17 |
| L1689B-EW | 16.21.7 | 137 | 0.26 | 2.2 | 4.7 | 3.8 | 16.5 |
4.2 L1689B
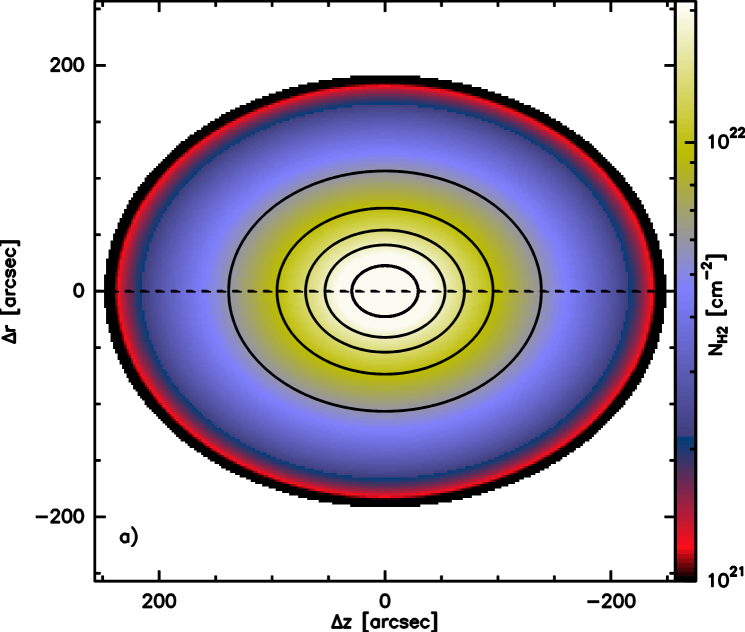
Compared to B68, L1689B is a slightly denser and more centrally condensed core (e.g. André et al., 1996; Bacmann et al., 2000), located in the Ophiuchus complex at a distance of pc. The Herschel images reveal that it is embedded within a larger-scale filamentary structure (see Fig. 3). Given the elongated morphology observed in the plane of the sky and the mean apparent aspect ratio of the core, the hypothesis of spherical symmetry underlying Eq. (1) is not strictly verified.
In order to assess the validity of our Abel-inversion scheme in this case, we therefore performed test reconstructions for prolate and oblate ellipsoidal model cores with similar aspect ratios. These tests suggest that small departures from spherical symmetry have little impact on the reconstruction results (see Appendix B).
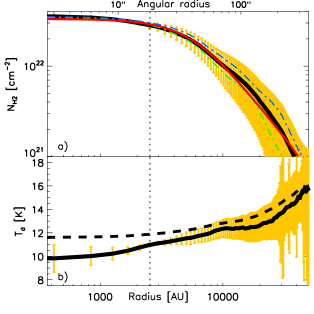
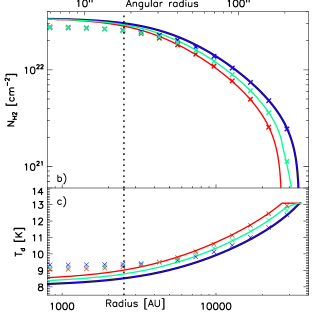
The upper panel of Fig. 4 shows the results of three distinct reconstructions of the column density profile of L1689B, obtained by applying the Abel inversion method to a) the circularly-averaged intensity profiles (thick solid curve), b) the intensity profiles observed in sectors oriented East-West (EW), i.e., approximately along the apparent major axis of the core (blue dash-dotted curve), and c) the intensity profiles observed in sectors oriented North-South (NS), i.e., approximately along the apparent minor axis of the core (green dash-dotted curve). While the three column density profiles agree with each other within the central plateau region, the EW profile lies 30% above the NS profile at large radii AU, and the circularly-averaged profile is intermediate between the other two. For reference and comparison with B68, a BE model was fitted to each of the three column density profiles and the results of these fits are given in Table 2 (for the sake of clarity, only the model fit to the circularly-averaged intensity profiles is shown in Fig. 4, as a red solid curve). All three fits yield a consistent value for the radius of the flat inner plateau, 100 AU (corresponding to ). The average reconstructed column density within is 3.50.1 cm-2, in good (30%) agreement with the H2 column density averaged over the flat inner part of the core of 4.5–4.7 cm-2 found by Bacmann et al. (2000) based on their ISOCAM mid-infrared absorption study (see their Table 2).
Our best estimate of the total core mass obtained from Abel reconstructing the circularly-averaged intensity profiles is 112 . The tests we performed for ellipsoidal synthetic cores (cf. Appendix B) indicate that the relative error in this mass introduced by the departure from spherical symmetry is less than 4% for an intrinsic aspect ratio of . Our mass estimate is in excellent agreement with the total mass reported by Bacmann et al. (2000). The SED mass derived from fitting a modified blackbody to the integrated flux densities is 7.80.2 , i.e., about 30% lower than our best mass estimate. The corresponding global SED temperature of the core is 12.50.2 K.
The central dust temperature obtained for L1689B using the Abel transform technique is 9.8 K (see lower panel of Fig. 4). This value is higher than the very low central dust temperature of 7.5 K advocated by Evans et al. (2001) based on radiative transfer calculations assuming a standard ISRF (). At least part of this discrepancy can be explained by the fact that the effective external radiation field for L1689B is about one order of magnitude stronger than the standard ISRF, due to the presence of early-type stars in the immediate vicinity of the Ophiuchus cloud (cf. Liseau et al., 1999).
5 Conclusions
The results on B68 and L1689B discussed in Sect. 4, along with the tests on model cores presented in Appendix B, demonstrate that the Abel transform technique can successfully produce meaningful radial density and dust temperature profiles for spatially resolved prestellar cores. The most rewarding result is the reconstruction of a radial dust temperature profile directly from Herschel dust continuum imaging data, independently of any radiative transfer model. The Abel inversion technique (Sect. 3) is very general, insensitive to background subtraction to first order, and can perform equally well for externally-heated (isotropically) starless cores or internally-heated protostellar cores. While in principle the technique assumes spherically symmetric cores, tests performed on ellipsoidal cores suggest that satisfactory results are obtained even when the hypothesis of spherical symmetry is not strictly valid (such as in the L1689B case – cf. Fig. 3). A similar Abel-transform scheme may also be employed to reconstruct the intrinsic beam-averaged density and temperature profiles of (approximately) cylindrically symmetric filaments from the observed radial intensity profiles averaged along the filament main axes.
For both B68 and L1689B we find a characteristic dip in the dust temperature profile, with minimum beam-averaged values of 9.3 K and 9.8 K at core center, respectively. The temperature profile smoothly merges with the background cloud temperature at the outer core radii.
The Abel transform technique yields central beam-averaged H2 densities of and for B68 and L1689B, respectively, corresponding to central column densities of 1.3 0.1 cm-2 and 3.6 0.1 cm-2 after integration of the reconstructed volume density profiles along the LOS. These central column density estimates are approximately 15% larger than the values obtained from direct SED fitting. Comparison of our results with the independent near-IR extinction measurement of the B68 column density profile by Alves et al. (2001) suggests that the dust opacity law adopted by the HGBS consortium, with per g (of gas dust) at m and , is accurate to better than (and possibly overestimated by) 50% in the 160–500 m range for sources of (column) densities comparable to B68 and L1689B. Our adopted opacity value is within 20% of the value 999 Suutarinen et al., 2013 quote =0.08 cm2 g-1 with =2 and argue that this value is underestimated by 40% inside the core due to temperature variations along the LOS. obtained by Suutarinen et al. (2013) for the dust inside a core of similar column density to the ones considered here. Assuming that the weak trend between submillimeter dust opacity and column density (0.28) found by Roy et al. (2013) at also holds at higher , we argue that the HGBS dust opacity law may remain valid to within 50% accuracy in the whole range of H2 column densities between and .
Since the Abel transformation technique can help us correct the effect of LOS temperature variations on the derivation of total masses, we conclude that the data of the HGBS project hold the promise of delivering core masses to better than a factor of 1.5 to 2 accuracy, at least for spatially-resolved cores.
Acknowledgements.
This work has benefited from the support of CNES and the European Research Council under the European Union’s Seventh Framework Programme (Fp7/2007-2013 – ERC Grant Agreement no. 291294). P.P acknowledges funding by the Fundação para a Ciência e a Tecnologia (Portugal). SPIRE has been developed by a consortium of institutes led by Cardiff Univ. (UK) and including Univ. Lethbridge (Canada); NAOC (China); CEA, LAM (France); IFSI, Univ. Padua (Italy); IAC (Spain); Stockholm Observatory (Sweden); Imperial College London, RAL, UCL-MSSL, UKATC, Univ. Sussex (UK); Caltech, JPL, NHSC, Univ. Colorado (USA). This development has been supported by national funding agencies: CSA (Canada); NAOC (China); CEA, CNES, CNRS (France); ASI (Italy); MCINN (Spain); SNSB (Sweden); STFC (UK); and NASA (USA). PACS has been developed by a consortium of institutes led by MPE (Germany) and including UVIE (Austria); KUL, CSL, IMEC (Belgium); CEA, OAMP (France); MPIA (Germany); IFSI, OAP/AOT, OAA/CAISMI, LENS, SISSA (Italy); IAC (Spain). This development has been supported by the funding agencies BMVIT (Austria), ESA-PRODEX (Belgium), CEA/CNES (France), DLR (Germany), ASI (Italy), and CICT/MCT (Spain).References
- Alves et al. (2001) Alves, J. F., Lada, C. J., & Lada, E. A. 2001, Nature, 409, 159
- André et al. (2003) André, P., Bouwman, J., Belloche, A., & Hennebelle, P. 2003, in SFChem 2002: Chemistry as a Diagnostic of Star Formation, ed. C. L. Curry & M. Fich, 127
- André et al. (2010) André, P., Men’shchikov, A., Bontemps, S., et al. 2010, A&A, 518, L102
- André et al. (1996) André, P., Ward-Thompson, D., & Motte, F. 1996, A&A, 314, 625
- Arzoumanian et al. (2011) Arzoumanian, D., André, P., Didelon, P., et al. 2011, A&A, 529, L6
- Bacmann et al. (2000) Bacmann, A., André, P., Puget, J.-L., et al. 2000, A&A, 361, 555
- Bernard et al. (2010) Bernard, J.-P., Paradis, D., Marshall, D. J., et al. 2010, A&A, 518, L88
- Bohlin et al. (1978) Bohlin, R. C., Savage, B. D., & Drake, J. F. 1978, ApJ, 224, 132
- Bonnor (1956) Bonnor, W. B. 1956, MNRAS, 116, 351
- Bouwman et al. (2001) Bouwman, J., Meeus, G., de Koter, A., et al. 2001, A&A, 375, 950
- Bracewell (1986) Bracewell, R. N. 1986, The Fourier Transform and its applications (2nd ed.; New York: McGraw-Hill)
- de Geus et al. (1989) de Geus, E. J., de Zeeuw, P. T., & Lub, J. 1989, A&A, 216, 44
- Draine (2003) Draine, B. T. 2003, ARA&A, 41, 241
- Evans et al. (2009) Evans, II, N. J., Dunham, M. M., Jørgensen, J. K., et al. 2009, ApJS, 181, 321
- Evans et al. (2001) Evans, II, N. J., Rawlings, J. M. C., Shirley, Y. L., & Mundy, L. G. 2001, ApJ, 557, 193
- Griffin et al. (2010) Griffin, M. J., Abergel, A., Abreu, A., et al. 2010, A&A, 518, L3
- Hildebrand (1983) Hildebrand, R. H. 1983, QJRAS, 24, 267
- Hill et al. (2011) Hill, T., Motte, F., Didelon, P., et al. 2011, A&A, 533, A94
- Kirk et al. (2005) Kirk, J. M., Ward-Thompson, D., & André, P. 2005, MNRAS, 360, 1506
- Könyves et al. (2010) Könyves, V., André, P., Men’shchikov, A., et al. 2010, A&A, 518, L106
- Launhardt et al. (2013) Launhardt, R., Stutz, A. M., Schmiedeke, A., et al. 2013, ArXiv e-prints
- Lehtinen et al. (1998) Lehtinen, K., Lemke, D., Mattila, K., & Haikala, L. K. 1998, A&A, 333, 702
- Liseau et al. (1999) Liseau, R., White, G. J., Larsson, B., et al. 1999, A&A, 344, 342
- Malinen et al. (2011) Malinen, J., Juvela, M., Collins, D. C., Lunttila, T., & Padoan, P. 2011, A&A, 530, A101
- Marsh et al. (2014) Marsh, K. A., Griffin, M. J., André, P., et al. 2014, MNRAS, submitted
- Mathis et al. (1983) Mathis, J. S., Mezger, P. G., & Panagia, N. 1983, A&A, 128, 212
- Men’shchikov et al. (2012) Men’shchikov, A., André, P., Didelon, P., et al. 2012, A&A, 542, A81
- Motte et al. (2010) Motte, F., Zavagno, A., Bontemps, S., et al. 2010, A&A, 518, L77
- Nielbock et al. (2012) Nielbock, M., Launhardt, R., Steinacker, J., et al. 2012, A&A, 547, A11
- Ossenkopf & Henning (1994) Ossenkopf, V. & Henning, T. 1994, A&A, 291, 943
- Pilbratt et al. (2010) Pilbratt, G. L., Riedinger, J. R., Passvogel, T., et al. 2010, A&A, 518, L1
- Plummer (1911) Plummer, H. C. 1911, MNRAS, 71, 460
- Poglitsch et al. (2010) Poglitsch, A., Waelkens, C., Geis, N., et al. 2010, A&A, 518, L2
- Roussel (2012) Roussel, H. 2012, astro-ph:1205.2576
- Roy et al. (2013) Roy, A., Martin, P. G., Polychroni, D., et al. 2013, ApJ, 763, 55
- Stamatellos et al. (2007) Stamatellos, D., Whitworth, A. P., & Ward-Thompson, D. 2007, MNRAS, 379, 1390
- Suutarinen et al. (2013) Suutarinen, A., Haikala, L. K., Harju, J., et al. 2013, astro-ph:1306.3156
- Ward-Thompson et al. (2002) Ward-Thompson, D., André, P., & Kirk, J. M. 2002, MNRAS, 329, 257
- Ysard et al. (2012) Ysard, N., Juvela, M., Demyk, K., et al. 2012, A&A, 542, A21
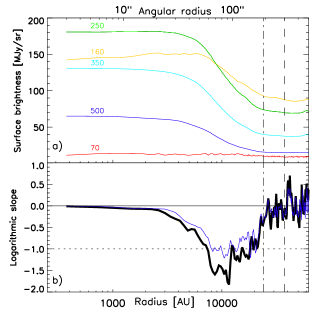
Appendix A Surface brightness profiles and outer radius of B68
The top panel of Fig. 5 shows the circularly-averaged intensity profiles of the B68 core at SPIRE and PACS wavelengths which were used to construct the column density and temperature profiles shown in Fig. 2. The bottom panel of Fig. 5 shows the logarithmic slope of the column density profile (black line), defined as (dimensionless), as a function of radius. The measured logarithmic slope is near core center due to flat inner density profile and the finite resolution of the observations. The logarithmic slope profile reaches a minimum value at AU, and goes back to at the outer boundary where the core merges with the slowly-varying background. For comparison, a spherical core with outer density profile would have at large radii. In the same plot we show the logarithmic slope of the 500 m surface brightness profile (blue line) which has a shallower slope due to the additional effect of the positive outward temperature gradient. Inspection of the intensity and slope profiles shown in Fig. 5 allowed us to select an appropriate upper integration radius in the right-hand side of Eq. (2) when reconstructing the density and temperature structure of B68 (see Sect. 3). Since beyond a radius AU, larger radii do not contribute to the integral of Eq. (2). In practice, we adopted an upper integration radius AU for B68, as shown by the dashed vertical line in Fig. 5. The reconstruction results, however, are insensitive to the precise choice of as long as AU. The adjacent dot-dashed vertical line shows the effective radius of AU (or ) derived by the getsources source-finding algorithm for the ‘footprint’ of B68. The getsources algorithm (Men’shchikov et al., 2012) is the source extraction method used by the HGBS consortium to produce the first-generation catalogs of dense cores found by Herschel in the regions covered by the HGBS survey. The footprint of a core corresponds to the area just outside of which getsources estimates the local background emission and over which it integrates the background-subtracted emission to derive the total flux densities of the core. In the case of B68, the results automatically derived by getsources are in excellent agreement with those obtained through a detailed radial profile analysis (cf. Fig. 5).
Appendix B Tests of the Abel inversion method using simple models
B.1 Spherically symmetric core model
In order to test the performance level of our Abel inversion scheme and quantify the robustness of the reconstruction, we applied the algorithm described in Sect. 3 to synthetic images corresponding to model starless cores of known density and temperature distributions. First, we considered a spherically-symmetric core model with a Plummer-type density distribution for ,
| (3) |
parameterized by physical parameters approximately similar to the derived properties of B68 (see Sect. 4.1): central H2 number density cm-3; flat inner radius AU, and outer radius AU. The surface density profile of such a model core has an analytical form:
| (4) |
where represents the impact parameter from core center in the plane of the sky, and = is the H2 column density profile. The intrinsic density profile of the model is shown as a black solid curve in Fig. 6a, and the corresponding column density profile as a black solid curve in Fig. 6b. The synthetic dust temperature profile is shown as a black solid curve in Fig. 6c and was obtained for a solar-neighborhood ISRF () using an analytic approximation formula reproducing a grid of spherically symmetric models performed with the dust radiative transfer code MODUST (Bouwman et al. 2013, in preparation – see Bouwman et al., 2001 and André et al., 2003).
A set of synthetic emission maps was created by line-of-sight integration of this model core at all wavelengths assuming optically thin dust emission (see Eq. 1) and the same dust opacity law as given in Sect. 3.1. The density and temperature profiles of the model core were then reconstructed as described in Sect. 3 from the circularly-averaged radial intensity profiles of the model emission. The cross symbols overlaid on the model density, column density, and temperature profiles in Figs. 6a,b,c show the Abel-reconstructed profiles that would be obtained with “infinite” angular resolution (and in the absence of noise). It can be seen in Fig. 6 that, in this case, the reconstruction is perfect, demonstrating the validity of our Abel-inversion code. The overplotted red curves in Figs. 6a,b,c show the reconstructed volume density, column density, and temperature profiles resulting from the Abel-inversion method after convolution of the model images to a common resolution of 363 corresponding to the Herschel resolution at 500 m. Likewise, the overplotted blue curves in Figs. 6a,b,c show the results obtained at a resolution of 249, using the synthetic data convolved to the Herschel resolution at 350-m and ignoring the 500-m data. It can be seen that the profiles reconstructed at the Herschel resolution remain in excellent (1%) agreement with the intrinsic profiles in the outer part of the core. Although the reconstruction becomes somewhat inaccurate below the Herschel resolution limit (marked by vertical dotted lines in Figs. 6), the reconstructed column density and temperature profiles still agree with the corresponding intrinsic profiles to within 20% and 9%, respectively, at 500-m resolution. The accuracy of the results at small radii improves to 11% and 5% when the reconstruction is performed at 350-m resolution (although in the presence of noise with real data, the statistical measurement uncertainties are somewhat larger at 350-m resolution). At both resolutions, the Abel-reconstructed temperature and column density profiles coincide within 1% with the corresponding intrinsic profiles convolved with the effective beam resolution. The reconstructed central temperature and column density thus provide excellent estimates of the beam-averaged central temperature and column density in the model. The total mass estimated by integrating the reconstructed column density profile agrees with the model mass to better than 0.1% even at 500-m resolution.
We also assessed the contribution of background fluctuations and calibration errors to the uncertainties in the derived parameters (and ). To do so, we considered 500 realizations of synthetic skies including a random Gaussian noise component101010The level of noise fluctuations () was chosen so that the peak signal-to-noise value at each wavelength was consistent with the corresponding B68 surface brightness image., , and a random multiplicative calibration factor, ():
| (5) |
where, is a Gaussian random number with mean zero and standard deviation of 10% and 15% at SPIRE and PACS wavelengths, respectively. (We assumed 100% correlated calibration errors at SPIRE wavelengths and an independent calibration error in the PACS 160 m band.) The net uncertainties in , , and were estimated to be 15%, 12%, and 5%, respectively. The resulting 1- errors in the derived parameters are displayed in Fig.6.
B.2 Ellipsoidal core model
As real cores such as L1689B are often elongated and thus not strictly spherically symmetric (see Sect. 4.2), we also tested the reliability of our Abel inversion scheme using a simple non-spherical model with an ellipsoidal Plummer-like density distribution for and , with cylindrical symmetry about the axis (assumed to lie in the plane of the sky):
| (6) |
where and are the radii of the flat inner core region perpendicular and parallel to the axis of symmetry (see Fig. 7a), respectively. We considered both the prolate ( ) and the oblate ( ) configuration, but are primarily describing the prolate case here as it is more likely for cores embedded within filaments such as L1689B (see Fig. 3). The synthetic temperature distribution was also assumed to be cylindrically symmetric about the axis and was constructed using the same grid of MODUST radiative transfer models as in Sect. B.1. The synthetic temperature profiles along both the axis and the radial () direction are shown in Fig. 7. For direct comparison with L1689B (see Fig. 3 and Fig. 7a), we adopted physical parameters approximately consistent with the observed characteristics of the L1689B core (see Sect. 4.2): central H2 number density cm-3; aspect ratio ; flat inner radius along the minor axis AU; outer radius along the minor axis AU.
Because of the lack of spherical symmetry we applied our Abel reconstruction scheme to three sets of intensity profiles: 1) the profiles measured along the major axis of the model (intrinsic profiles shown as blue curves and results as blue crosses in Fig. 7); 2) the profiles measured along the minor axis of the model (intrinsic profiles shown as red curves and results as red crosses in Fig. 7); and 3) circularly-averaged intensity profiles (intrinsic profiles shown as green curves and results as green crosses in Fig. 7). Here, again, it can be seen that the reconstruction results are very satisfactory (2% agreement) beyond the beam radius (marked by the vertical dotted line in Fig. 7). The reconstruction performed perpendicular to the axis of symmetry, i.e., along the minor axis for a prolate core, is more accurate (1%) than the reconstruction performed along the axis of symmetry (4%). In particular, the best estimate of the central dust temperature is obtained from the reconstruction performed along the minor axis. The reconstruction along the major axis nevertheless provides better estimates of the column density and temperature at large radii along the major axis. The central column density reconstructed at 500 m resolution slightly underestimates, but still agrees to within 20% with, the true column density at core center. The best estimate of the total core mass, obtained by using the results of the reconstruction performed on the circularly-averaged intensity profiles, agrees to better than 4% with the model core mass. Even for a more elongated core model with an aspect ratio of 2 (instead of 1.3), the reconstructed core mass still agrees with the model mass to within 5%.
We also performed similar simulations for an oblate core model observed edge-on. The accuracy of the reconstruction results was found to be essentially the same as for the prolate case. Again, the reconstruction performed perpendicular to the axis of symmetry, i.e., along the major axis in this case, was found to be more accurate than the reconstruction performed along the axis of symmetry. The best estimate of the total core mass was again obtained from reconstructing the circularly-averaged intensity profiles.