Detector and Event Visualization
with SketchUp at the CMS Experiment
Abstract
We have created 3D models of the CMS detector and particle collision events in SketchUp, a 3D modelling program. SketchUp provides a Ruby API which we use to interface with the CMS Detector Description to create 3D models of the CMS detector. With the Ruby API, we also have created an interface to the JSON-based event format used for the iSpy event display to create 3D models of CMS events. These models have many applications related to 3D representation of the CMS detector and events. Figures produced based on these models were used in conference presentations, journal publications, technical design reports for the detector upgrades, art projects, outreach programs, and other presentations.
1 Introduction
The Compact Muon Solenoid (CMS) experiment [1] is one of two general-purpose experiments at the Large Hadron Collider (LHC) at CERN. From the data collected during LHC Run-I, which ended in early 2013, the CMS collaboration has published more than 250 papers describing searches for supersymmetry and exotic phenomena, measurements of QCD, electroweak, top, bottom, forward, and heavy-ion physics, as well as the discovery of the Higgs boson [2].
Event displays are valuable tools that find many uses in collider experiments. These uses include validation of detector geometries, development of event reconstruction algorithms, visual inspection of reconstructed events, and also production of high-quality visual images for public presentations. One approach to develop an event display is to build “from scratch” by using a 3D graphic library, such as OpenGL, and a graphical user interface (GUI) toolkit. In the CMS experiment, Fireworks [3], FROG [4], and iSpy [5, 6], all of which are actively used, were developed in this approach.
Here, we took an alternative approach; we created 3D models of the CMS detector and events in an already-existing 3D modelling application, widely used by architects, mechanical engineers, graphic designers, and other professionals: SketchUp [7]. This approach allows us to use many attractive features of SketchUp: it has a highly intuitive user interface and precise dimensions; it can export and import 2D images in various raster and vector formats; it can exchange 3D models with other applications in several common formats, e.g., 3DS and COLLADA; it can apply visual effects on models, such as shadows, fog, and different rendering styles.
2 Detector Geometry Rendering
We obtain the detector geometry from the CMS Detector Description [10]. The CMS Detector Description, written in XML, is the master source of the CMS detector geometry used in the CMS event reconstruction and the CMS detector simulation. It describes the CMS detector as a directed tree. Each vertex of the tree corresponds to a component with a size, shape, material, and density. Each edge connects from a component to its subcomponent; it specifies the position and angle of the subcomponent within the component.
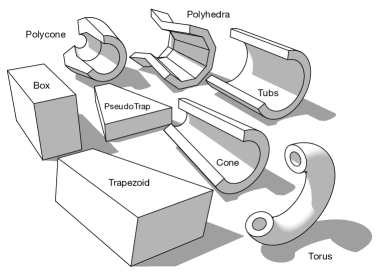
The Ruby scripts take the following steps to render the geometry. First, the Ruby scripts parse the XML files and recognize the directed tree of the detector geometry. Second, they build each component as a solid with the given size and shape. Figure 1 shows the shapes and the names of implemented solids. Then, for each edge from the leaves of the tree to the root, the scripts place the tail component in the head component as a subcomponent at the given position and angle.
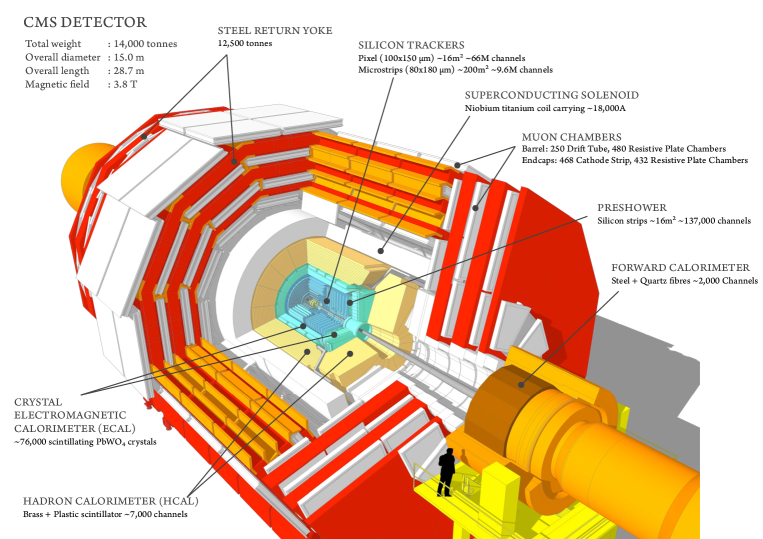
Figure 2 is one of the CMS detector cutaway images often used in public presentations. The 3D model in this figure was rendered in SketchUp. This figure was used in the CMS official website [11], posters created for CERN Open Days [12], and the Higgs boson discovery summary published in Science [13].
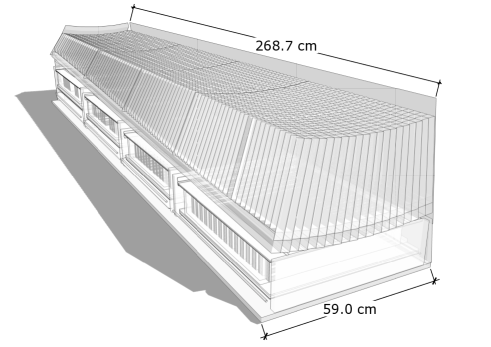
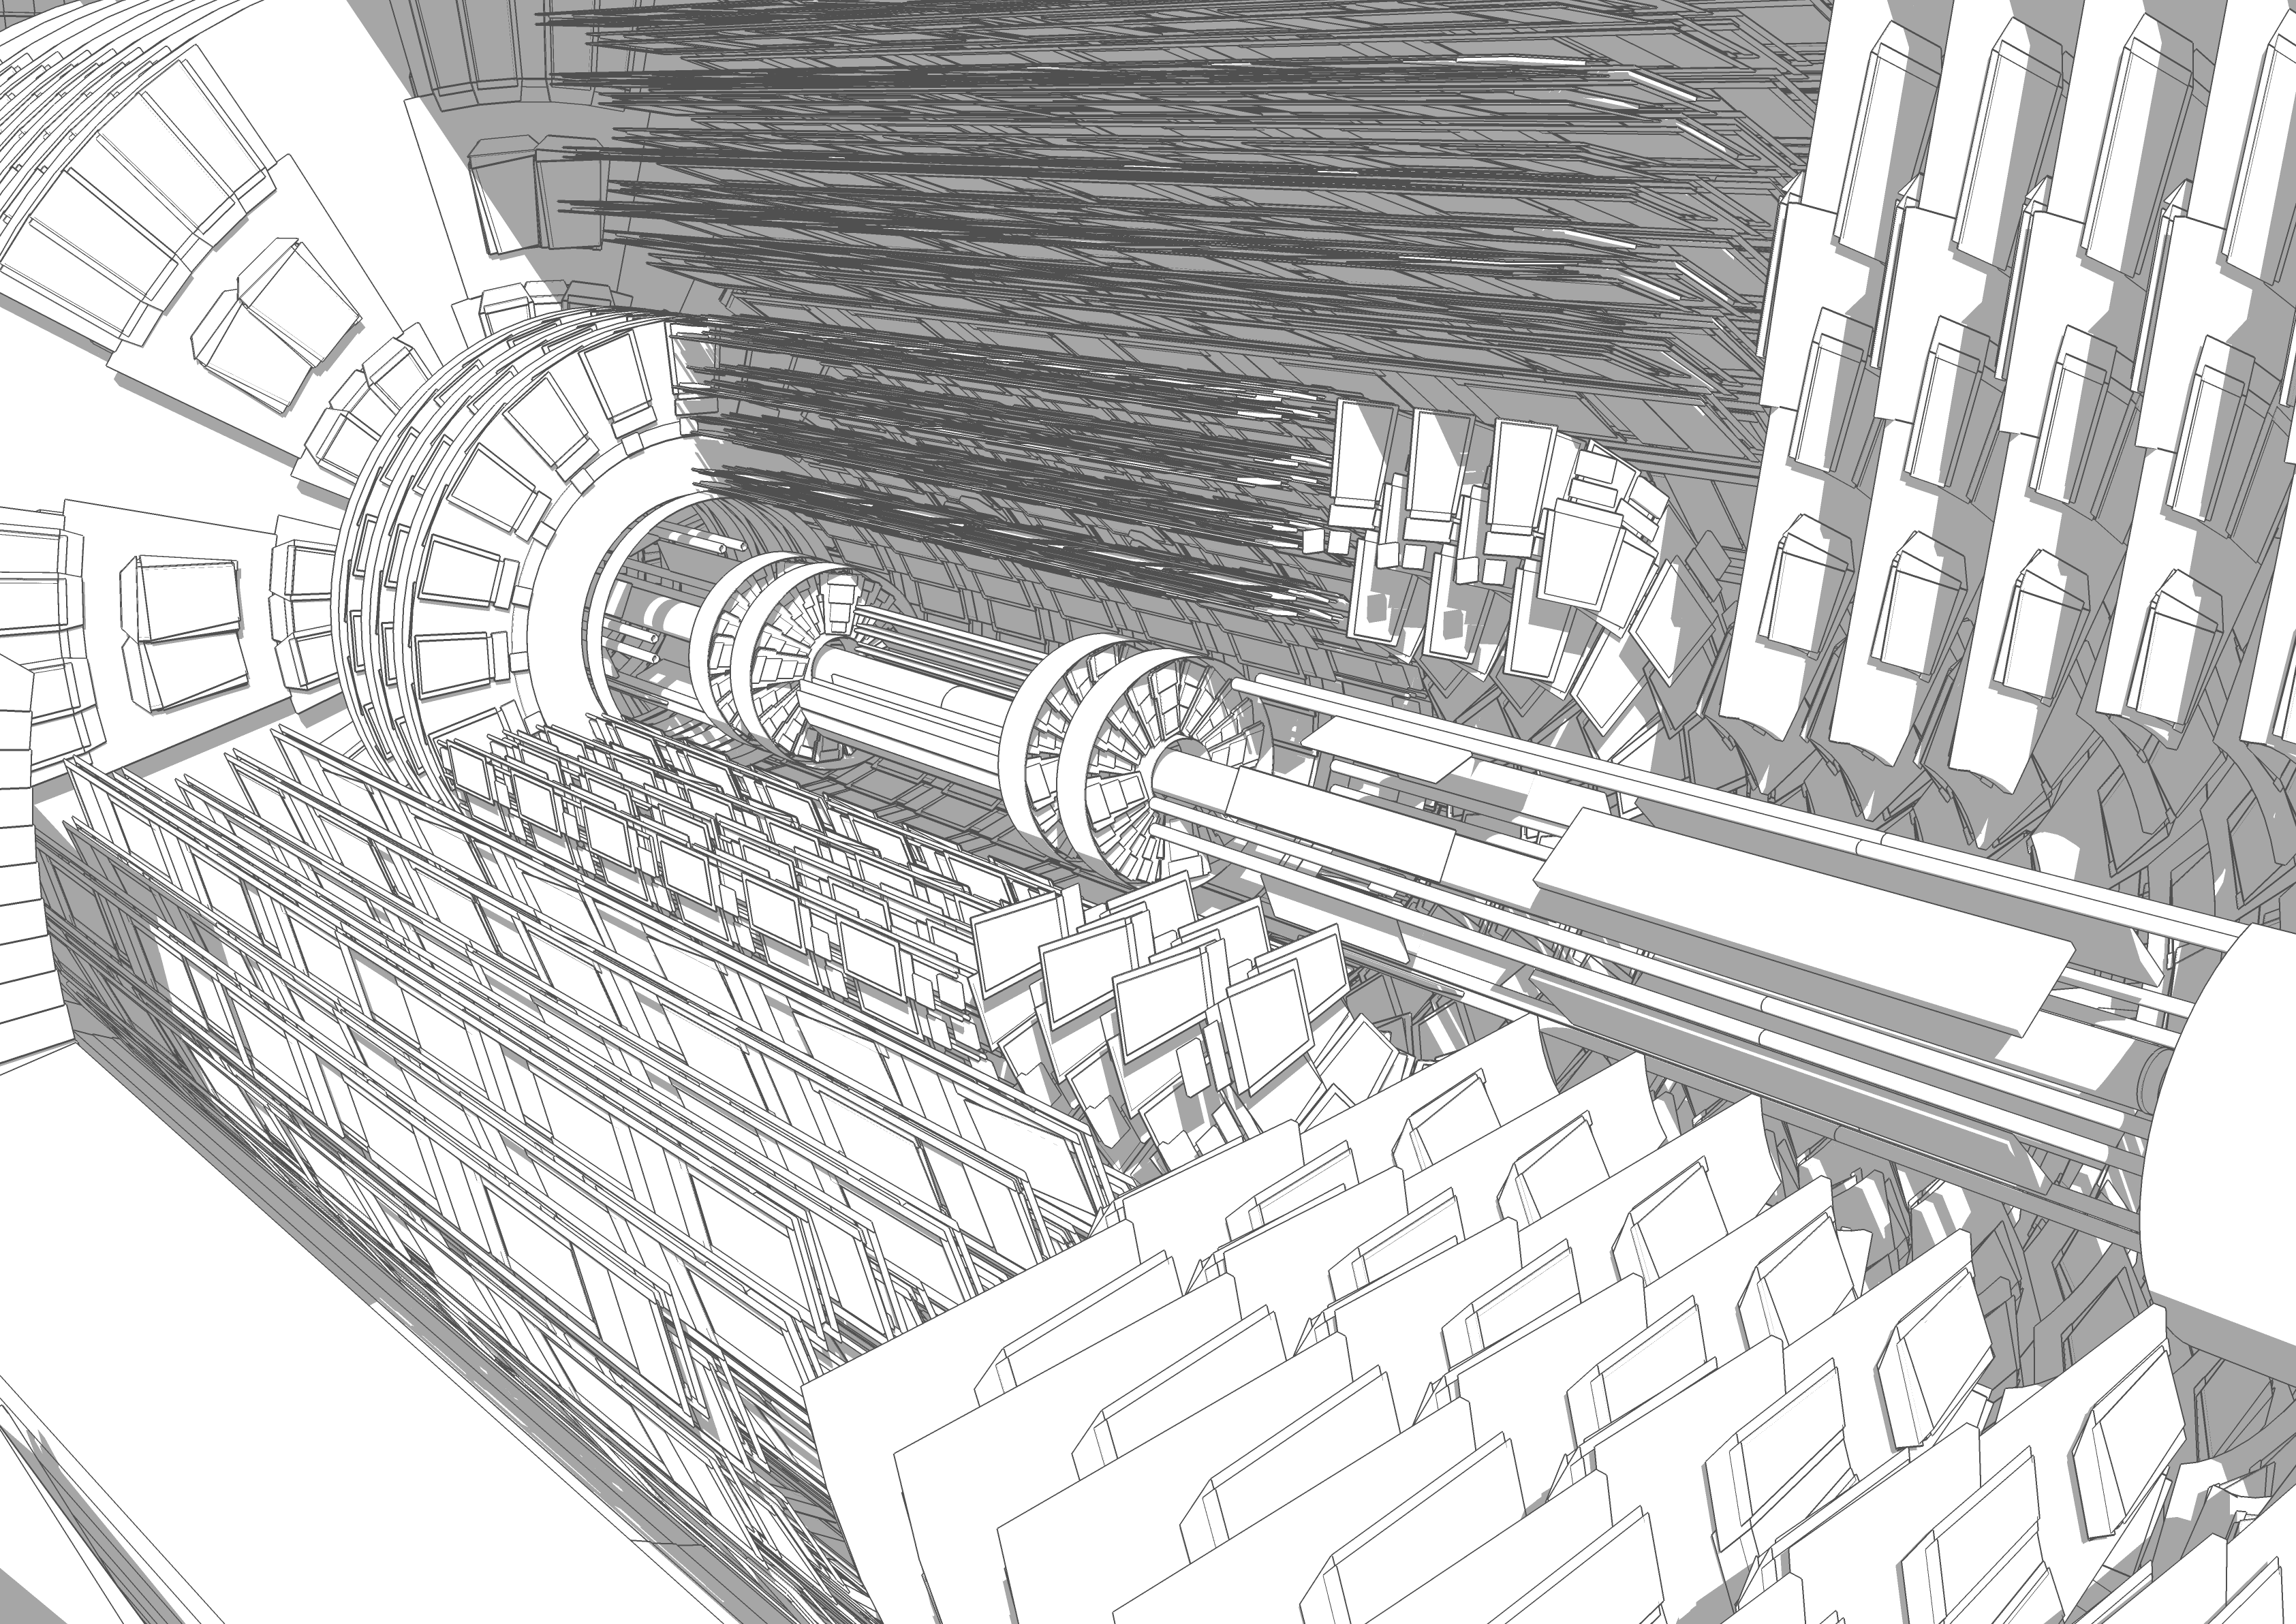
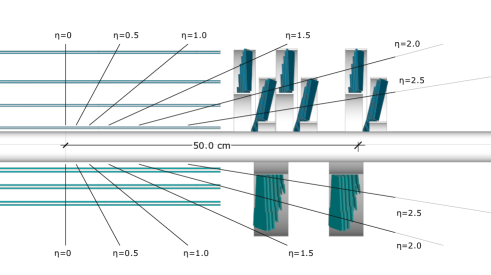
The level of detail in which to render the detector can be adjusted by choosing subcomponents to include in the model. For example, Figure 3 shows a module of the barrel electromagnetic calorimeter (EB), in which the geometry of each lead-tungstate () crystal is drawn. Figure 4 includes detailed geometry of the innermost subsystems, the silicon strip and pixel trackers. This figure is part of the exhibition “ZOOOM” [14], displayed at Point 5, a CERN site in Cessy France, where the CMS detector is installed.
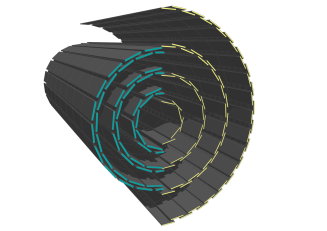
The CMS detector will be continuously upgraded. The geometries for the detector upgrades, which are also described in the CMS Detector Description [15], can be rendered in SketchUp as well. In Figure 5, one half of each model has the initial geometry of the CMS pixel tracker and the other half has the geometry for its Phase 1 upgrade. These two images were used to illustrate the difference between before and after the upgrade in many public documents, including the CMS Technical Design Report for the Pixel Detector Upgrade [16].
3 Event Rendering
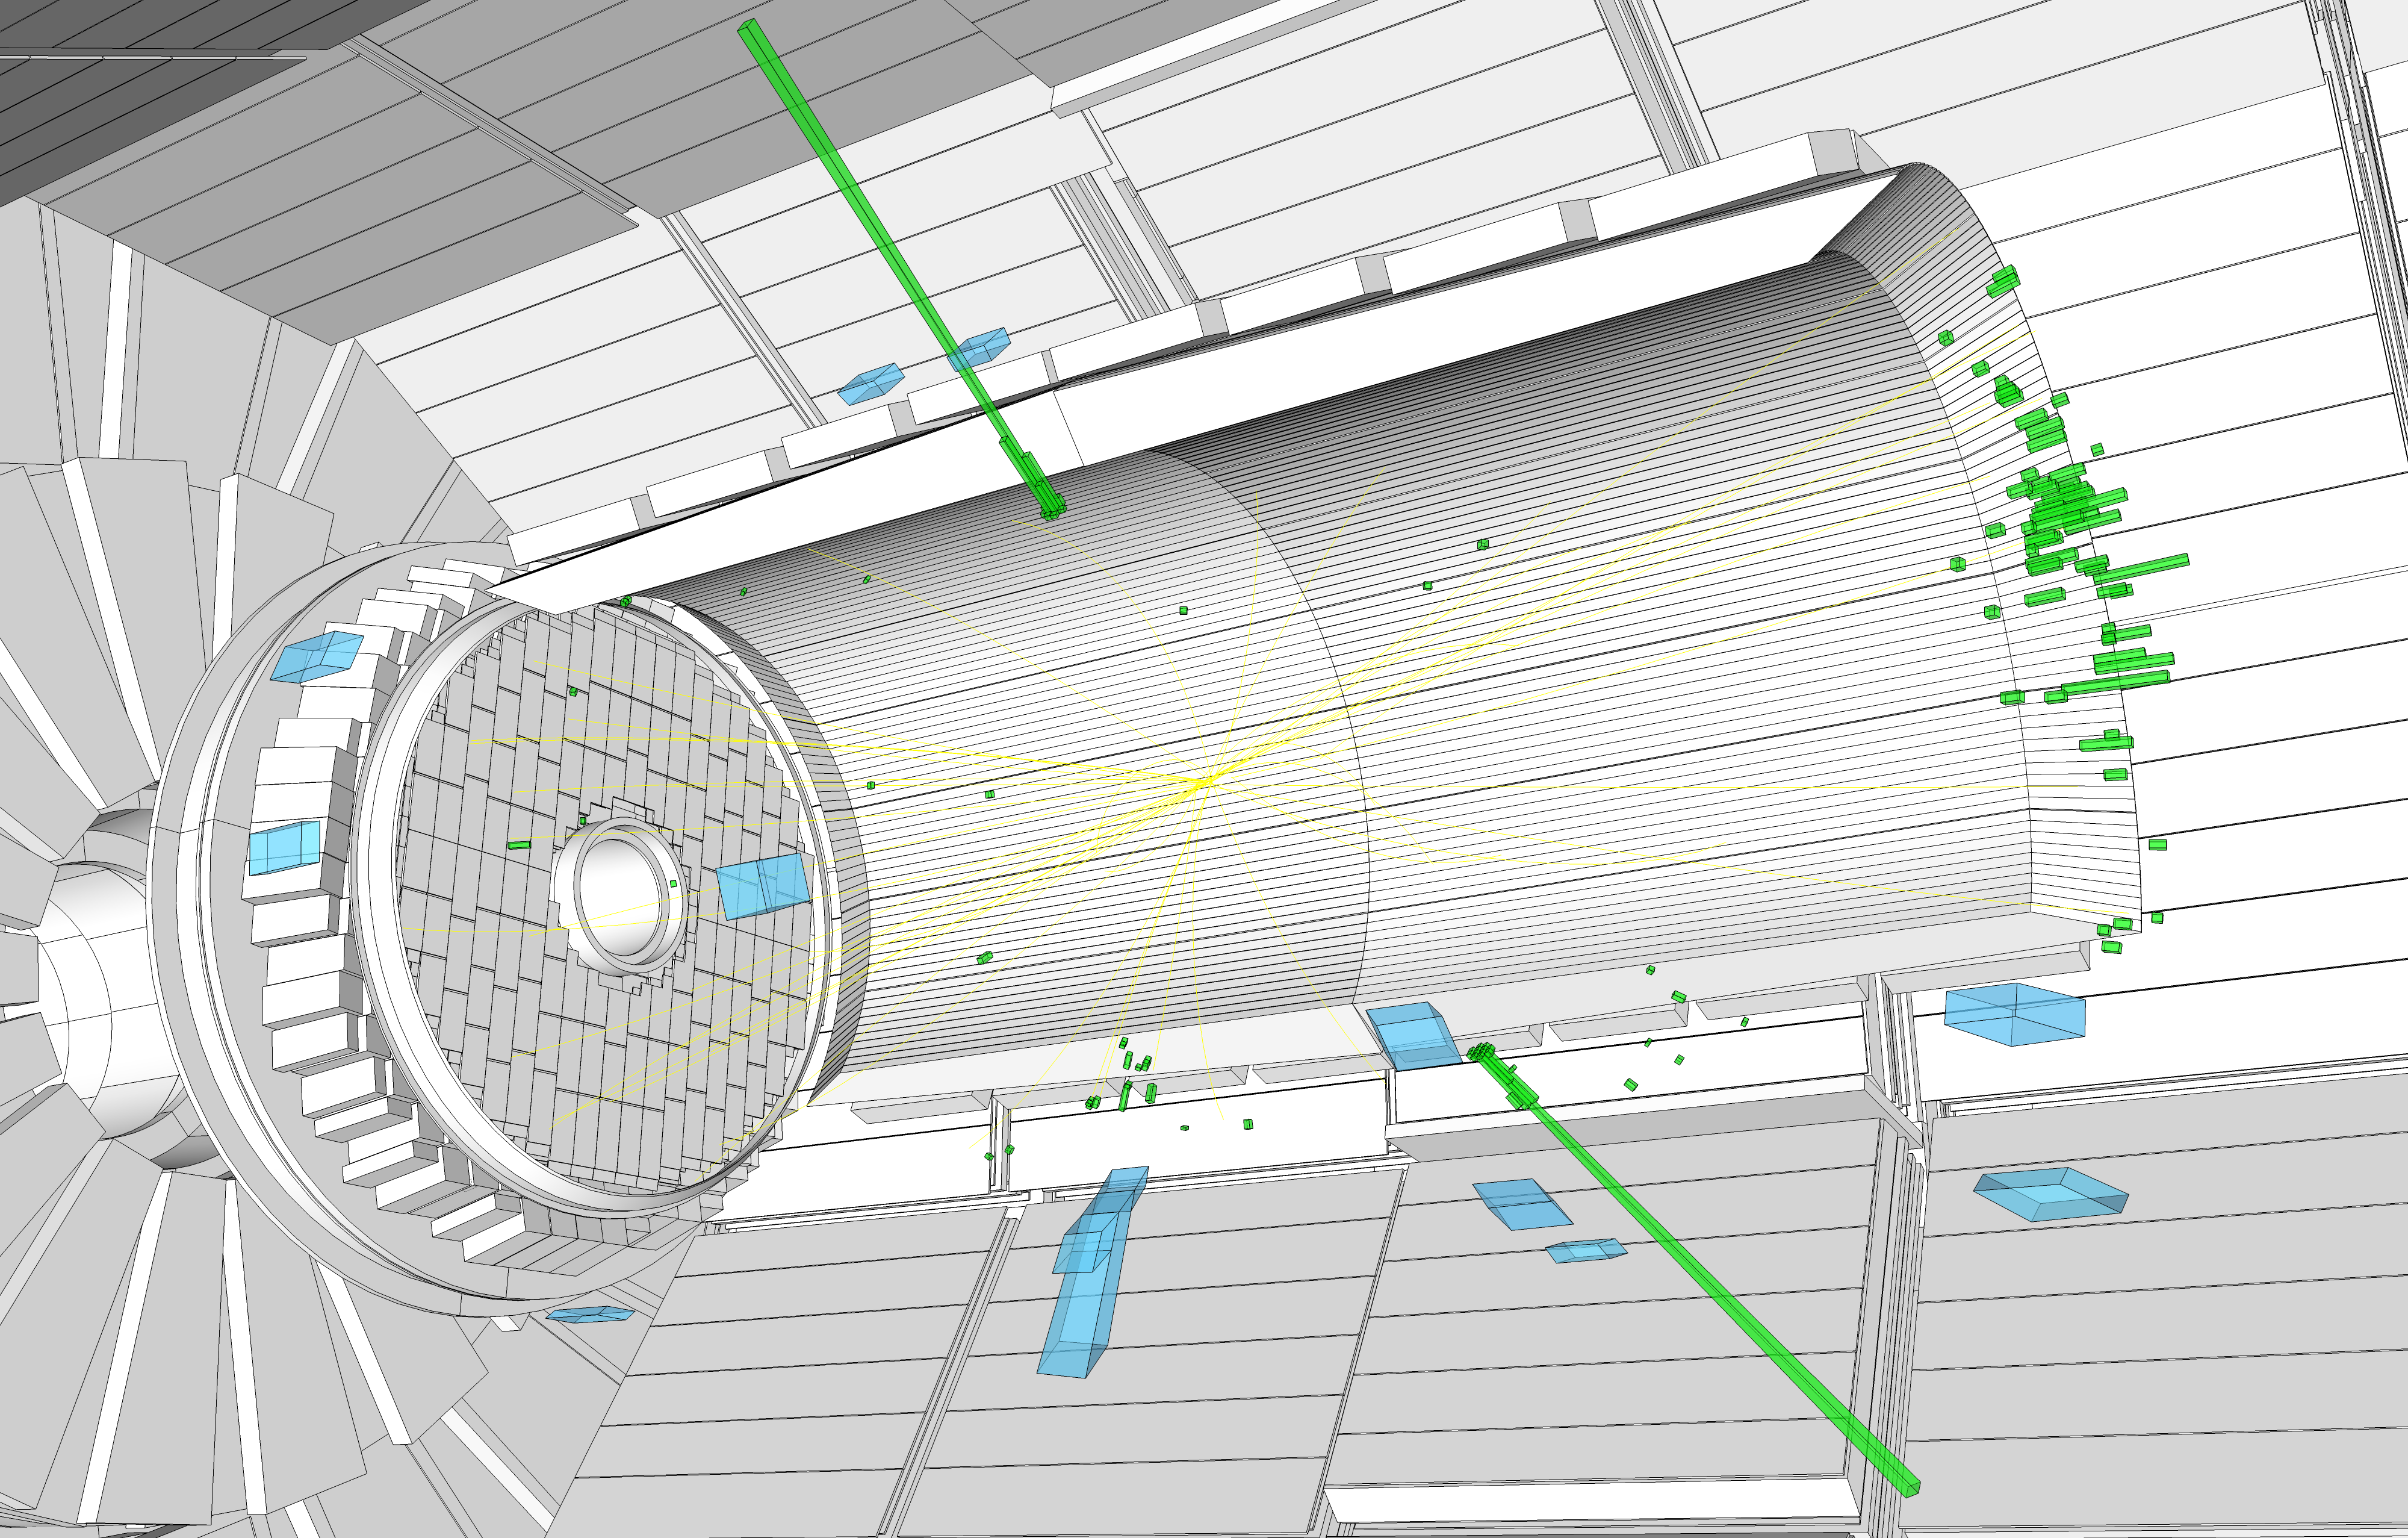
The event input is the ig format [5] developed for the iSpy event display [6]. The content includes information necessary for 2D and 3D rendering of event data such as kinematical properties of reconstructed particles and positions and energies of calorimetric deposits. The ig format is simply a zip archive containing event files in JSON (JavaScript Object Notation) format; a JavaScript object instance can be easily converted to a Ruby hash. The SketchUp Ruby API can therefore easily be used to render the events. In the larger project, a Ruby module named ig2rb parses an unzipped ig file and renders a subset of objects. Tracks and electrons are rendered as cubic bézier splines, energy deposits in the electromagnetic and hadronic calorimeters as scaled rectangles with six faces, muons as polylines, and hit muon chambers as rectangular boxes. An example image of a candidate Higgs boson decaying into two photons can be seen in Figure 6. Versions using other color sets and styles can be found at the CERN Document Server [17].
4 Summary
We have developed a set of Ruby scripts to create 3D computer models of the CMS detector and CMS events in SketchUp via its Ruby API. These scripts are available at its GitHub repository. The 3D models allow us to produce high quality images and exportable 3D models of the CMS detector and events, which are used in a variety of public presentations. In addition, these models can be used to validate geometries for CMS detector upgrades. Furthermore, several art projects, exhibitions, outreach programs using these models are being planned. We plan to continue to develop the scripts to extend the range of supported reconstructed objects, detector subsystems, and input formats and to improve the user interfaces for both interactive and batch uses.
Acknowledgments
We thank Michael Case and Ianna Osborne for explaining to us the technical implementation details of the CMS Detector Descriptions. We have received valuable feedback and support from Erik Gottschalk, Lucas Taylor, Michael Hoch, David Barney, Achintya Rao, Harry Cheung, Teruki Kamon, Elizabeth Sexton-Kennedy, and other members of the CMS collaboration. This work was partially supported by the U.S. Department of Energy and National Science Foundation.
References
References
- [1] CMS Collaboration, “The CMS experiment at the CERN LHC,” 2008 JINST 3 S08004
- [2] CMS Collaboration, “Observation of a new boson at a mass of 125 GeV with the CMS experiment at the LHC,” Phys. Lett. B716 (2012) 30
- [3] D. Kovalskyi et al., “Fireworks: A physics event display for CMS,” 2010 J. Phys. Conf. Ser. 219 032014
- [4] L. Quertenmont and V. Roberfroid, “FROG: The Fast & Realistic OPENGL Displayer,” arXiv:0901.2718
- [5] G. Alverson et al., “iSpy: a powerful and lightweight event display,” 2012 J. Phys. Conf. Ser. 396 022002
- [6] iSpy website, http://cern.ch/ispy
- [7] SketchUp official website, http://www.sketchup.com
- [8] SketchUp Ruby API, http://www.sketchup.com/intl/en/developer
- [9] GitHub Repo SketchUpCMS, http://github.com/SketchUpCMS/SketchUpCMS
- [10] M. Case et al., “CMS Detector Description: New Development,” Proceedings for CHEP 2004
- [11] CMS official website, “CMS detector design,” http://cms.web.cern.ch/news/cms-detector-design
- [12] CERN Opendays, 28-29 Sep. 2013, http://opendays2013.web.cern.ch
- [13] CMS Collaboration, “A New Boson with a Mass of 125 GeV Observed with the CMS Experiment at the Large Hadron Collider,” 2012 Science 338 1569
- [14] “ZOOOM: CMS visualized in 3D,” http://cms.web.cern.ch/news/zooom-cms-visualised-3d
- [15] I. Osborne et al., “CMS geometry through 2020,” CHEP 2013
- [16] CMS Collaboration, “CMS Technical Design Report for the Pixel Detector Upgrade,” CERN-LHCC-2012-016, CMS-TDR-011
- [17] http://cds.cern.ch/record/1598895