The Sloan Digital Sky Survey quasar catalog: tenth data release
We present the Data Release 10 Quasar (DR10Q) catalog from the Baryon Oscillation Spectroscopic Survey (BOSS) of the Sloan Digital Sky Survey III. The catalog includes all BOSS objects that were targeted as quasar candidates during the first 2.5 years of the survey and that are confirmed as quasars via visual inspection of the spectra, have luminosities [z=2] 20.5 (in a CDM cosmology with = 70 km s-1 Mpc-1, = 0.3, and = 0.7), and either display at least one emission line with a full width at half maximum (FWHM) larger than 500 km s-1 or, if not, have interesting/complex absorption features. The catalog also includes known quasars (mostly from SDSS-I and II) that were reobserved by BOSS. The catalog contains 166,583 quasars (74,454 are new discoveries since SDSS-DR9) detected over 6,373 deg2 with robust identification and redshift measured by a combination of principal component eigenspectra. The number of quasars with (117,668) is 5 times greater than the number of quasars known prior to BOSS. Redshifts and FWHMs are provided for the strongest emission lines (C iv, C iii, Mg ii). The catalog identifies 16,461 broad absorption line quasars and gives their characteristics. For each object, the catalog presents five-band (u, g, r, i, z) CCD-based photometry with typical accuracy of 0.03 mag and information on the optical morphology and selection method. The catalog also contains X-ray, ultraviolet, near-infrared, and radio emission properties of the quasars, when available, from other large-area surveys. The calibrated digital spectra cover the wavelength region 3,600-10,500 Å at a spectral resolution in the range 1,300 2,500; the spectra can be retrieved from the SDSS Catalog Archive Server. We also provide a supplemental list of an additional 2,376 quasars that have been identified among the galaxy targets of the SDSS-III/BOSS.
Key Words.:
Keywords: catalogs, surveys, quasars: general1 Introduction
Quasars have become a key ingredient in our understanding of cosmology and galaxy evolution ever since their discovery (Schmidt, 1963).
With the advent of large and dedicated surveys such as the Sloan Digital Sky Survey (SDSS; York et al., 2000) and the 2dF Quasar Redshift Survey (2QZ; Croom et al., 2001), the number of known quasars has rapidly increased.
The first two stages of the SDSS discovered and spectroscopically confirmed more than 105,000 quasars (Schneider et al., 2010), mainly at low redshift ().
The Baryonic Oscillation Spectroscopic Survey (BOSS; Dawson et al., 2013), the main dark time survey of the third stage of the SDSS (SDSS-III; Eisenstein et al., 2011), aims to measure the expansion rate of the Universe using the clustering of luminous red galaxies at (Anderson et al., 2012) and the clustering of the intergalactic medium (IGM) at (Busca et al., 2013; Slosar et al., 2013).
To make such a measurement, the BOSS quasar target selection (Ross et al., 2012) is designed to reach a sky density of quasars of at least 15 .
The first two years of observation of SDSS-III/BOSS were released as part of the ninth data release (Ahn et al., 2012) whose associated quasar catalog (DR9Q; Pâris et al., 2012) contained 87,822 unique quasars, 61,931 having , over an area of 3,275 .
This paper presents the SDSS-DR10 quasar catalog, denoted DR10Q, which compiles all the spectroscopically-confirmed quasars identified during the first three years of BOSS operations and released as part of the SDSS tenth data release (Ahn et al., 2013). This catalog contains quasars targeted by the main quasar target selection (Ross et al., 2012), the BOSS ancillary programs (Dawson et al., 2013) and serendipitous discoveries in the galaxy targets. It contains 166,583 unique quasars, including 117,668 with , over an area of 6,373 . In this paper, we summarize the procedures used to compile DR10Q and describe the changes relative to DR9Q (Pâris et al., 2012).
In Section 2, we summarize the target selection and observations.
We describe the construction of the DR10Q catalog in Section 3.
We summarize the general properties of the present sample in Section 4 and describe its detailed contents in Section 5. We conclude in Section 6.
In addition, we explain the programs used to target quasars (main selection and ancillary programs) in Appendix A and
the format of the file containing the results of the visual inspection of spectra
used to derive the DR10Q catalog in Appendix B.
This information is made available on the
SDSS public website http://www.sdss3.org/dr10/algorithms/qso_catalog.php.
In the following, we use a CDM cosmology with (Spergel et al., 2003). We call a quasar an object with a luminosity that either displays at least one emission line with FWHM500 or, if not, has specific absorption features that can be securely identified as quasars due to the Lyman- forest or BAL troughs. This definition is the same as in DR9Q (Pâris et al., 2012). In the following, all magnitudes are PSF magnitudes (Stoughton et al., 2002) and are corrected for Galactic extinction using the maps from Schlegel et al. (1998).
2 Observations
A surface density of 15 quasars per in the redshift range 2.15-3.5 is necessary to measure the BAO scale in the Lyman- forest at (McDonald & Eisenstein, 2007). SDSS-III/BOSS is a five-year program that aims at observing over 160,000 quasars over 10,000 in order to reach a precision of 4.5% on the angular diameter distance and 2.6% on the Hubble constant at (Eisenstein et al., 2011). The first detection of the baryon acoustic oscillation (BAO) signal in the clustering of the IGM was obtained from the spectra of the 60,000 high redshift quasars listed in the DR9Q catalog (Busca et al., 2013; Slosar et al., 2013).
2.1 Imaging data
Quasar target selection for BOSS is based on imaging released in SDSS-DR8 (Aihara et al., 2011); it is the same as in SDSS-I/II with an extension to the South Galactic Cap (SGC). These data were gathered using a dedicated 2.5 m wide-field telescope (Gunn et al., 2006) to collect light for a camera with 30 2k2k CCDs (Gunn et al., 1998) over five broad bands - ugriz (Fukugita et al., 1996); this camera has imaged 14,555 unique square degrees of the sky, including contiguous areas of 7,500 in the North Galactic Cap (NGC) and 3,100 in the SGC that comprise the uniform “Legacy” areas of the SDSS (Aihara et al., 2011). The imaging data were acquired on dark photometric nights of good seeing (Hogg et al., 2001). Objects were detected and their properties were measured (Lupton et al., 2001; Stoughton et al., 2002) and calibrated photometrically (Smith et al., 2002; Ivezić et al., 2004; Tucker et al., 2006; Padmanabhan et al., 2008), and astrometrically (Pier et al., 2003). The BOSS limiting magnitude for target selection is or .
2.2 Target selection
The measurement of clustering of the IGM is independent of the properties of background quasars, but does depend on the surface density of quasar lines of sight. Hence, the target selection for the quasars used for Lyman- forest cosmology does not have to be uniform, but should maximize the surface density of high-z quasars. However, there is also the desire to perform demographic measurements using a uniformly-selected quasar sample. Thus, a [composite] strategy that mixes a heterogeneous selection to maximize the surface density of quasars, with a uniform subsample has been adopted by SDSS-III/BOSS (Ross et al., 2012).
On average, 40 fibers per are allocated to the quasar project. Approximately half of these are selected through the target selection algorithm intended to create a uniform (“CORE”) sample. After testing during the first year of BOSS observations, the CORE selection was chosen to be the XDQSO method (Bovy et al., 2011) The other half of the fibers are dedicated to quasar candidates that are used to maximize the surface density [at the cost of homogeneity] of high-redshift quasars: the “BONUS” sample. Several different methods (a neural network combinator: Yèche et al. (2010); a Kernel Density Estimator, KDE: Richards et al. (2004, 2009); a likelihood method: Kirkpatrick et al. (2011), and the XDQSO method with lower likelihood than in the CORE sample) were implement to select the BONUS quasar targets. Where available, near-infrared data from UKIDSS (Lawrence et al., 2007), ultraviolet data from GALEX (Martin et al., 2005), along with deeper coadded imaging in overlapping SDSS runs (Aihara et al., 2011), were also incorporated to increase the high-z quasar yield (Bovy et al., 2012). Point sources that match the FIRST radio survey (July 2008 version; Becker et al., 1995) with (to filter out quasars) are always included in the quasar target selection.
Previously known quasars were also re-targeted111During the first two years of observations, we re-targeted known quasars only. We have extended the re-observation to known quasars since Year 3. to take advantage of the improved throughput of the SDSS spectrographs. The sample of previously known quasars were drawn from multiple sources. These include: SDSS-DR7 quasar catalog (Schneider et al., 2010); the 2dF QSO redshift survey (2QZ; Croom et al., 2004); the 2dF-SDSS LRG and QSO survey (2SLAQ; Croom et al., 2009); the AAT-UKIDSS-DSS (AUS) survey, and the MMT-BOSS pilot survey (Appendix C in Ross et al., 2012). Quasars observed at high spectral resolution by VLT/UVES and Keck/Hires were also included in the sample.
In addition to the main survey, about 5% of the SDSS-III/BOSS fibers are allocated to ancillary programs. They are described in the Appendix and Tables 6 and 7 of Dawson et al. (2013) and §4.2 of Ahn et al. (2013). The full list of ancillary programs (and their target selection bits) that target quasars and thus, are included in the present catalog, is provided in Appendix A.
2.3 Spectroscopy
Quasar targets selected by the various target selection algorithms are spectroscopically observed with the BOSS spectrographs whose spectral resolution varies from 1,300 at 3,600 Å to 2,500 at 10,000 Å (Smee et al., 2013). Spectroscopic observations are taken in a series of at least three 15-minute exposures. Additional exposures are taken until the squared signal-to-noise ratio per pixel, (S/N)2, reaches the survey-quality threshold for each CCD. These thresholds are at -band magnitude 21 for the red camera and at -band magnitude 22 for the blue camera (Galactic extinction-corrected magnitudes). The spectroscopic reduction pipeline for BOSS spectra is described in Bolton et al. (2012). SDSS-III uses plates with 1,000 spectra each, which can overlap (Dawson et al., 2013). A total of 1,515 plates were observed between December 2009 and July 2012, some plates were observed multiple times. In total, 166,583 unique quasars have been spectroscopically confirmed based on our visual inspection as we describe below. Fig. 1 shows the observed sky area. The total area covered by the SDSS-DR10 is 6,373 .

3 Construction of the DR10Q catalog
The SDSS-DR10 quasar catalog is built upon the visual inspection of the spectra of all the objects targeted as quasars by SDSS-III/BOSS and all the objects classified robustly as quasars by the SDSS pipeline (Bolton et al., 2012) among the galaxy targets.
3.1 Visual inspection process
The visual inspection process is fully described in Section 3 of Pâris et al. (2012); we briefly summarize the steps here.
The spectra of quasar candidates are reduced and the SDSS pipeline222The software used is called idlspec2d and is publicly available. The current version is v5_5_12. Details can be found at http://www.sdss3.org/dr10/software and in Bolton et al. (2012) provides a classification (QSO, STAR or GALAXY) and a redshift. Each spectrum is fit with a library of star templates, a PCA decomposition of galaxy spectra and a PCA decomposition of quasar spectra. Each class of templates is fit over a range of redshifts: galaxies from to , quasars from to , and stars from to (). The combination of redshift and template with the overall best fit (in terms of the lowest reduced chi-squared) is adopted as the pipeline classification and redshift measurement. The redshift is accompanied by a flag (ZWARNING); when it is zero, the pipeline has high confidence in its estimate. We use this output as a first estimate for the visual inspection.
Through a dedicated website, quasar candidates are separated between low-z quasars (), high-z quasars (), stars and “others” based on the initial SDSS pipeline classification. The spectra of the objects in each list are then visually inspected and each object is classified as QSO, Star, Galaxy if the identification and the redshift are certain, QSO_Z? if the object is clearly a quasar but the redshift is uncertain, QSO_? and Star_? if we have clues to the correct classification but are not certain, ? if we cannot certify the classification of an object at all and Bad when the signal-to-noise ratio is too low to identify the objects. The distinction between ? and Bad becomes quite subjective as the signal-to-noise ratio decreases.
In addition to the quasar candidates, we also visually inspected the spectra of some objects among the galaxy targets. While confirming the identification of all the quasar targets is important to understand and improve the various quasar target selection algorithms, objects are inspected among the galaxy targets to get back the maximum number of serendipitous quasars in the full SDSS-III/BOSS spectroscopic sample. Moreover, these objects usually have low signal-to-noise ratio, and thus, their identification is more difficult. For these reasons, the visual inspection strategy is slightly different for this class of objects, and we adopted a binary classification: either an object is a QSO or this is not a quasar.
3.2 Definition of the DR10Q parent sample
| Classification | # pipeline | # pipeline | # visual |
|---|---|---|---|
| with ZWARNING=0 | inspection | ||
| QSO | 188,705 | 162,857 | 166,583 |
| QSO with | (124,062) | (115,429) | (117,668) |
| QSO_? | - | - | 1,370 |
| QSO_Z? | - | - | 545 |
| Galaxy | 20,627 | 14,512 | 10,267 |
| Star | 112,397 | 83,429 | 133,557 |
| Star_? | - | - | 1,519 |
| Bad | - | - | 3,257 |
| ? | - | - | 1,082 |
| Missinga | - | - | 150 |
| Not a quasar (galaxy targets) | - | - | 3,398 |
| Total | 321,729 | 260,798 | 321,729 |
| a Quasars not visually inspected because of bad photometric information | |||
We selected quasar candidates among the objects targeted by the main quasar target selection (labelled as BOSS_TARGET1 in the SDSS database, Ross et al., 2012), the ancillary programs that target quasars (ANCILLARY_TARGET1 and ANCILLARY_TARGET2, see the Appendix of Dawson et al., 2013) and objects identified as QSO with z2 and ZWARNING=0 by the SDSS pipeline or identified as GALAXY with the subclass BROADLINE. This leads to a superset of 316,947 quasar targets (i.e. objects targeted for spectroscopy as quasars) and 4,782 possible serendipitous quasars from the galaxy targets for a total number of objects of 321,729. The spectra of 321,579 of these have been visually inspected, and 150 quasar targets are missing because of bad photometric information. 166,583 objects have been identified as QSO, 545 as QSO_Z?, 1,370 as QSO_?, 10,267 as Galaxy, 133,557 as Star, 1,519 as Star_?, 1,082 as ? and 3,257 as Bad. The result of the visual inspection is given in Table 1.
This quasar catalog lists all the firmly confirmed quasars (QSO and QSO_BAL, i.e. QSO showing broad absorption lines, only). About 10% of these quasars have been observed spectroscopically several times (Dawson et al., 2013). These repeat observations are often useful to confirm the nature of objects with low S/N spectra. However, we did not attempt to co-add these data mostly because they are often of quite different S/N.
Together with the quasar catalog, we provide the full result of the visual inspection (e.g. the identification of all visually scanned objects) with the whole superset from which we derived this catalog. We encode the identification using two parameters z_conf_person and class_person. The relation between these two parameters and the output from the visual inspection is given in Table 2. We refer the reader to Appendix B to find the detailed format of the fits file that contains the DR10Q superset.
Finally, in the course of various tests for the inclusion of galaxy targets in the visual inspection process, we gathered a sample of serendipitous quasars. The parent sample of these objects is not well defined as the visual inspection strategy for the galaxy targets has changed several times. Hence, we provide them in the form of a supplementary list that contains 2,376 quasars.
| z_conf_person | ||||
| 0 | 1 | 2 | 3 | |
| class_person | ||||
| 0 | Not inspected | ? | - | - |
| 1 | - | - | Star_? | Star |
| 2 | Not a quasar a | - | - | - |
| 3 | - | QSO_? | QSO_Z? | QSO |
| 4 | - | - | - | Galaxy |
| 30 | - | - | - | QSO_BAL |
| a Galaxy targets | ||||
4 Summary of sample
4.1 Broad view


The DR10Q catalog contains 166,583 unique quasars, including 117,668 with . This sample contains about twice as many quasars as the previous release (DR9Q). The first 2.5 years of operations of SDSS-III/BOSS cover an area of 6,373 , leading to a mean density of 16.3 quasars per square degree.
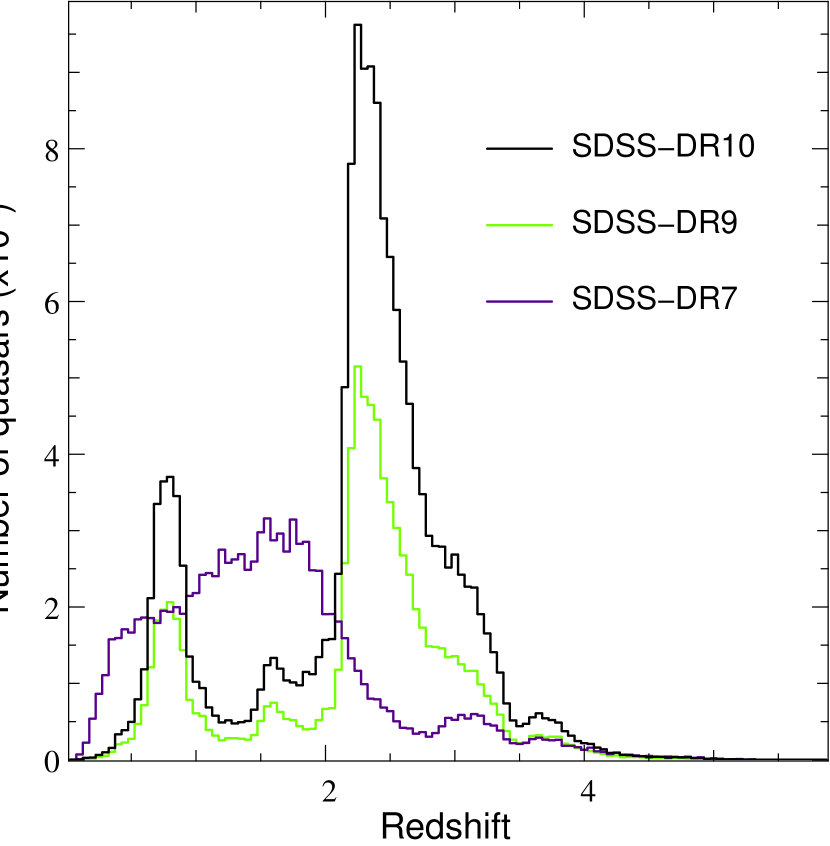
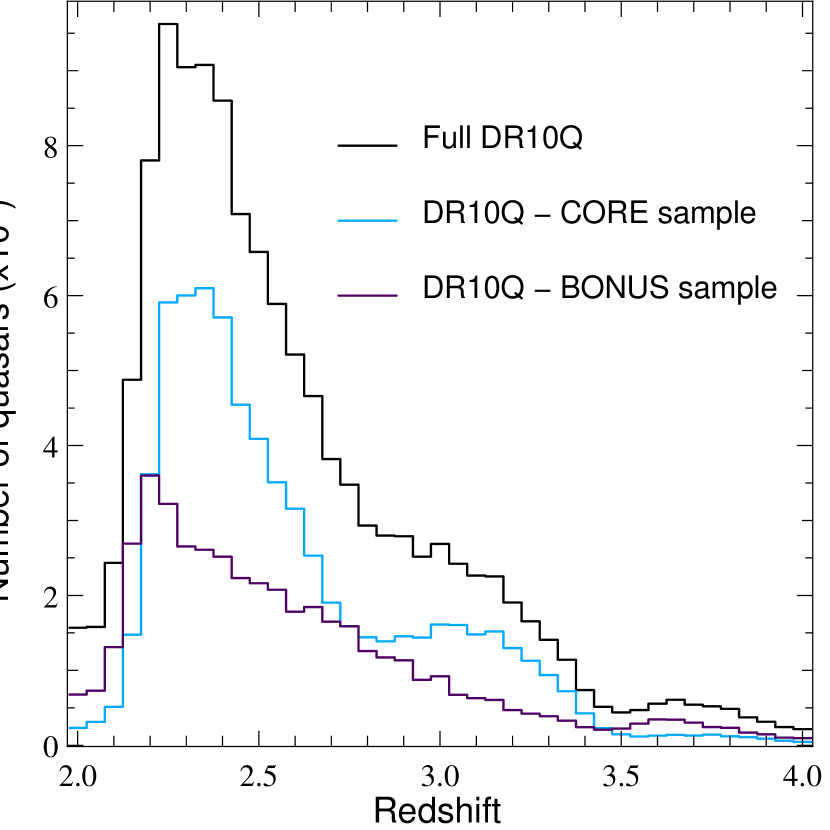
The quasars from this catalog have redshifts between 0.053 and 5.855. Their redshift distribution is shown in Fig. 2 (left panel). The peaks at and are due to known degeneracies in the SDSS color space. The SDSS-DR9 (green histogram) and SDSS-DR10 (black histogram) redshift distributions are scaled versions of one another. The right panel of Fig. 2 displays the same distribution but in the redshift range of interest for BOSS () together with the distributions from the CORE (uniformly selected sample; blue histogram) and the BONUS (purple histogram) samples. Typical spectra of SDSS-DR10 quasars are shown in Fig. 3. The broad statistical properties of this sample have not changed since DR9Q. We list below the differences between the two catalogs, and refer the reader to Pâris et al. (2012) for a detailed description of the unchanged content.
4.2 Differences between SDSS-DR9 and SDSS-DR10 quasar catalogs
4.2.1 Quasars that were in DR9Q but not in DR10Q and quasars that could have been in DR9Q but were not
The DR9Q catalog (Pâris et al., 2012) contained 87,822 unique quasars of which 86,952 are also part of the present catalog. Two plates (3698 and 5369) were accidentally included in DR9 (Ahn et al., 2012), although they did not fulfill the minimum S/N conditions (see Dawson et al., 2013). They have been downgraded to “bad plates”, and therefore not included in DR10 (Ahn et al., 2013). These plates have been re-drilled, and re-observed after the DR10 cut-off. Hence, 90 DR9 quasars have dropped out of the present catalog. The remaining 786 quasars that were part of DR9Q but not DR10Q were re-classified during various tests of the visual inspection process and are now part of the supplementary list as explained in Section 3.
In addition, the identification of 56 objects have changed between DR9Q and DR10Q. This modification is due to systematic checks performed in the past year on objects classified as QSO_? and ?. These checks are necessary especially since objects can be re-observed, often with better S/N and the data reduction pipeline constantly improves. We perform this re-inspection after the release of a new data reduction. A few mistakes have also been corrected, after feedback from users of the catalog.
4.2.2 Visual inspection redshift
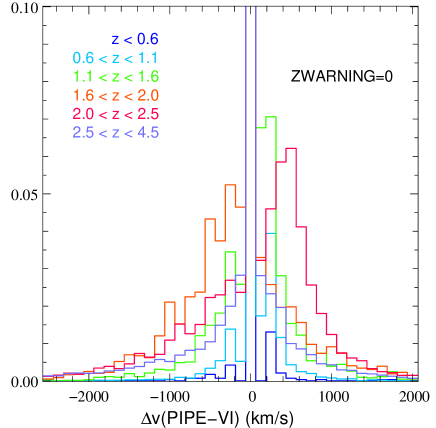
As part of the visual inspection, we use the SDSS pipeline redshift estimate (Z_PIPE) as a first guess, and we either confirm or correct for it when it is necessary. We use the maximum of the Mg ii emission line, when it is available in the spectrum, to set the visual inspection redshift (Z_VI). Fig. 6 shows the distribution of velocity differences between the pipeline and the visual inspection redshift estimates.
In the course of the checks mentioned above, some redshifts have been adjusted. In addition, in the DR9Q catalog (Pâris et al., 2012), the visual inspection redshifts have a 3 digit precision because it is not possible to reach higher precision by eye. The pipeline redshift estimate has a 5 digit precision. In DR9Q, the truncation of the visual redshift was performed even when the visual inspection simply confirms the pipeline redshift. This approach created a systematic and arbitrary mean blueshift of 50 of the visual redshift estimate relative to the pipeline estimate. In DR10Q we do not apply this truncation.
4.2.3 Emission Line fitting
We fit several emission lines (C iv, the C iii] complex and Mg ii) using a set of principal components. This fit provides a measurement of the line redshift, FWHM, blue and red HWHMs and their equivalent width. We apply the exact same procedure as in DR9Q (see Section 4 of Pâris et al., 2012).
However, the set of principal components used in DR9Q was unable to reproduce emission lines with FWHM smaller than 2,000 (Alexandroff et al., 2013), creating an arbitrary truncation of FWHM at this value. We corrected for this defect by incorporating quasars with C iv emission lines of FWHM smaller than 2,000 in the sample used to derive the set of principal components. This modification does not affect most of the measured emission line properties with a median difference for the measured C iv FWHM of between DR9Q and DR10Q. This change does not affect the quality of the PCA redshift estimate neither. Over the sample, where the Mg ii emission line is available in the SDSS-III/BOSS spectra, the median shift between the global PCA redshift estimate (Z_PCA) and the Mg ii redshift is less than 5 .
4.3 Uniform sample
As in DR9Q, we provide a uniform flag (row #26 of Table 4) in order to identify a homogeneously selected sample of quasars. Although the CORE sample has been designed to have a well understood, uniform, and reproducible selection function, its definition has varied over the first year of the survey. Thus, the nominal CORE quasars are not a uniformly-selected sample. Areas within which all the algorithms used in the quasar target selection are uniform are called “Chunks”. The definition of each of them can be found in Ross et al. (2012). After Chunk 12, CORE targets were selected with the XDQSO technique only (Bovy et al., 2011). These objects have uniform = 1. Quasars in our catalog with uniform = 2 are objects that would have been selected by XDQSO if it had been the CORE algorithm prior to Chunk 12. Objects with uniform = 2 are reasonably complete to what XDQSO would have selected, even prior to Chunk 12. But, as DR10Q only contains information about spectroscopically confirmed quasars, not about all targets, care must be taken to create a statistical sample from the uniform flag. See, e.g, the discussion regarding the creation of a statistical sample for clustering measurements in White et al. (2012). Quasars with uniform = 0 are not homogeneously selected CORE targets.
4.4 Broad Absorption Line quasars
Broad absorption lines, BALs, in quasar spectra are both visually and automatically identified and characterized as described in Section 5 of Pâris et al. (2012).
In total we identified 16,461 BAL quasars during the visual inspection of the DR10 quasar candidates. The visual inspection does not measure the width of troughs, but C iv troughs are also automatically identified and characterized in the spectra of quasars. This redshift is chosen so that the whole region between Si iv and C iv emission lines is covered by the BOSS spectrograph.
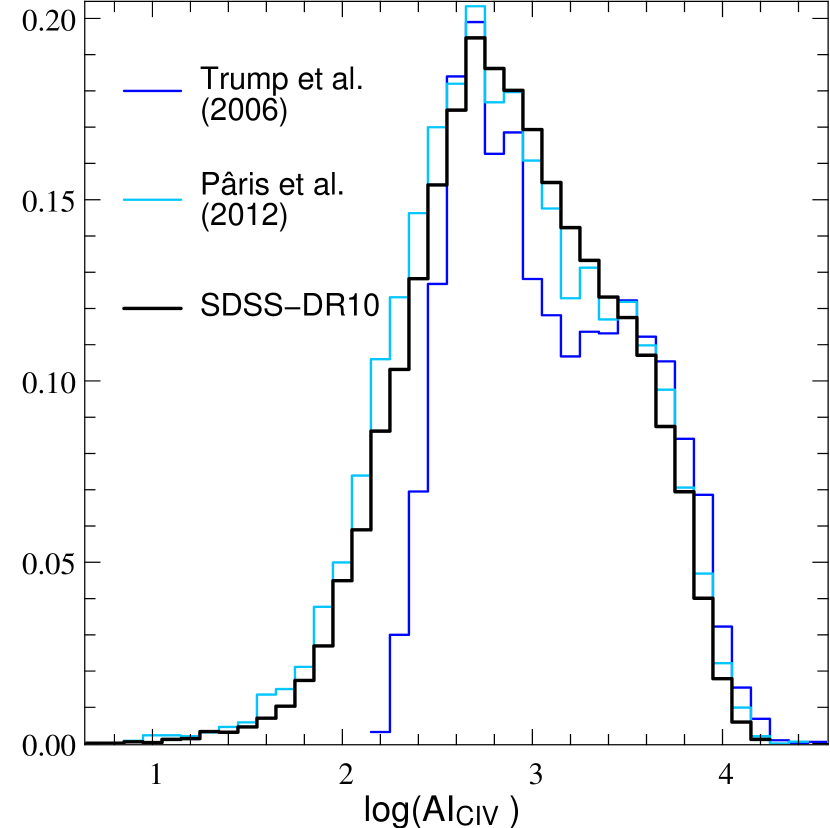
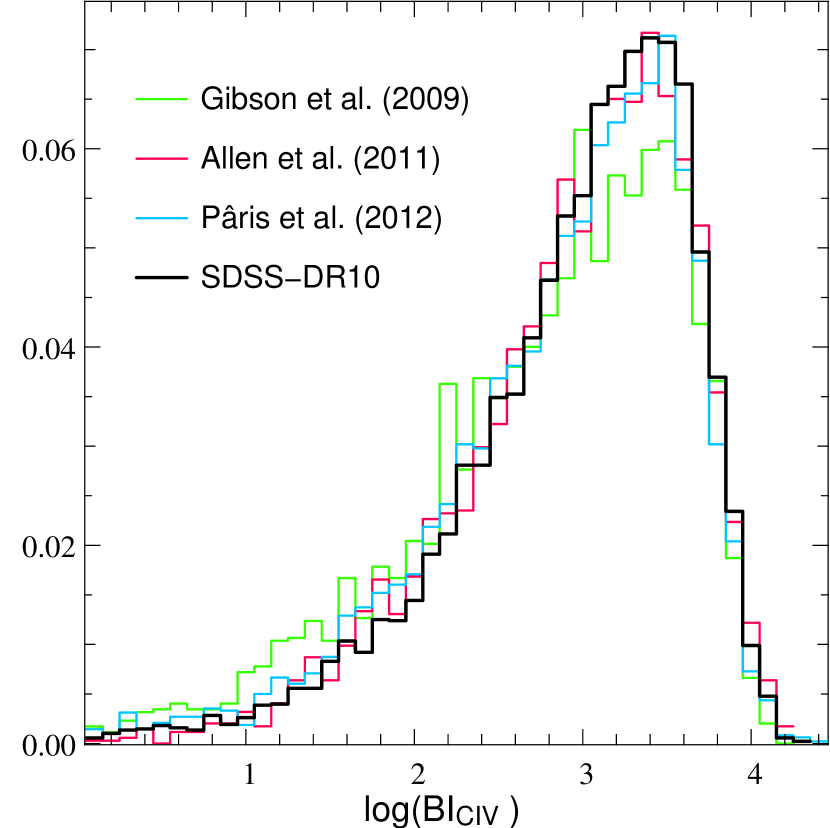
We provide the balnicity index (BI; Weymann et al., 1991) and the absorption index (AI; Hall et al., 2002) for these quasars. A total of 9,623 quasars with Z_VI1.57 have a positive BI value and 26,232 have . The systematic search is performed for C iv troughs only: some quasars flagged BAL by the visual inspection may have BI = 0 , either because the condition that troughs must be at least 2,000 wide is not fullfilled, or because the object was flagged because of absorption lines of some other ion (e.g. Mg ii, Si iv). The distribution of the two indices is shown in Fig. 7.
4.5 Multiwavelength matching
We cross-correlate the DR10Q catalog with several other surveys: the FIRST radio survey (Becker et al., 1995), the Galaxy Evolution Explorer (GALEX, Martin et al., 2005) survey in the UV, the Two Micron All Sky Survey (2MASS, Cutri et al., 2003; Skrutskie et al., 2006), the Wide-Field Infrared Survey (WISE, Wright et al., 2010) and the ROSAT All-Sky Survey (RASS; Voges et al., 1999, 2000). In addition, we now provide a match to the UKIRT Infrared Deep Sky Survey (UKIDSS; Lawrence et al., 2007) and the second XMM-Newton serendipitous source catalog (Watson et al., 2009).
4.5.1 FIRST
We match the DR10Q catalog to the FIRST radio survey (Becker et al., 1995) using a 2″matching radius as we did in DR9Q. We use the FIRST catalog released in February 2012, which contains an extension in the SGC which is not included in the July 2008 catalog that was used to match to DR9Q quasars. We report the flux peak density at 20 cm and the signal-to-noise ratio of the detection. If a quasar lies outside of the FIRST footprint, the reported flux density peak is set to .
The SDSS-III/BOSS quasar target selection (Ross et al., 2012) automatically includes the FIRST sources from the previous (July 2008) version of the FIRST catalog with . This additional color cut is set to avoid contamination by low-redshift quasars.
There are 6,682 matches to the FIRST catalog.
4.5.2 The Galaxy Evolution Explorer (GALEX)
As in DR9Q, GALEX (Martin et al., 2005) images are force photometered (from GALEX Data Release 5) at the SDSS-DR8 centroids (Aihara et al., 2011), such that low S/N point-spread function fluxes of objects not detected by GALEX is obtained, for both the FUV (1,350-1,750 Å) and NUV (1,750-2,750 Å) bands when available.
A total of 107,835 quasars are detected in the NUV band, 86,753 in the FUV band and 69,164 have non-zero fluxes in both bands.
4.5.3 The Two Micron All Sky Survey (2MASS)
We cross-correlate the DR10Q catalog with the All-Sky Data Release Point Source catalog (Skrutskie et al., 2006) using a matching radius of 2″. We report the Vega-based magnitudes in the J, H and K-bands and their error together with the signal-to-noise ratio of the detections. We also provide the value of the 2MASS flag rd_flg[1], which gives the meaning of the peculiar values of the magnitude and its error for each band333see http://www.ipac.caltech.edu/2mass/releases/allsky/doc/explsup.html for more details.
There are 2,824 matches in the catalog.
4.5.4 The Wide-Field Infrared Survey (WISE)
As we did for DR9Q, we match the BOSS DR10Q to the WISE All-Sky Source Catalog444http://irsa.ipac.caltech.edu/Missions/wise.html (Wright et al., 2010). Our procedure is the same as in DR9Q, with a matching radius of 2.0″providing a very low-level of false positive matches (see e.g. Fig. 4 of Krawczyk et al., 2013). We find 87,849 matches from the WISE All-Sky Source Catalog.
Here, we report the magnitudes, their associated errors, the S/N of the detection and reduced of the profile-fitting in the four WISE bands centered at wavelengths of 3.4, 4.6, 12 and 22 m. These magnitudes are in the Vega system, and are measured with profile-fitting photometry555see e.g. http://wise2.ipac.caltech.edu/docs/release/allsky/expsup/ sec2_2a.html and http://wise2.ipac.caltech.edu/docs/release/allsky/expsup/ sec4_4c.html#wpro.
However, we strongly caution the reader not to accept our catalog matches in blind faith. We report the WISE catalog Contamination and confusion flag, cc_flags, and as suggested on the WISE “Cautionary Notes” page 666http://wise2.ipac.caltech.edu/docs/release/allsky/expsup/sec1_4b.html #unreliab recommend using only thos matches with cc_flags = ’0000’ to exclude objects which are flagged as spurious detections of image artifacts in any band. However, our checks have found that even this criterion sometimes selects catalog objects that are obviously spurious in the WISE imaging.
4.5.5 UKIDSS
The UKIRT Infrared Deep Sky Survey (UKIDSS; Lawrence et al., 2007) has observed 7,500 in the near infrared. UKIDSS images are force photometered at the SDSS-DR8 centroids (Aihara et al., 2011). UKIDSS observations acquired before March 2011 were used; they have been released as UKIDSS DR1-DR9.
We provide the fluxes and their associated errors, expressed in , in the Y, J, H and K bands. The conversion to the Vega magnitudes, used in 2MASS, is given by the formula:
| (1) |
where X denotes the filter and the zero-point values are 2026, 1530, 1019 and 631 for the Y, J, H and K bands respectively.
A total of 66,649 quasars are detected in one of the four bands Y, J, H or K. 65,997 objects are detected in the Y band, 65,732 in the J band, 65,730 in H band, 66,130 in the K band and 64,181 objects have non-zero fluxes in the four bands. The UKIDSS limiting magnitude is (for the Large Area Survey) while the 2MASS limiting magnitude in the same band is . This difference in depth between the two surveys explains the very different numbers of matches with DR10Q.
4.5.6 ROSAT all sky survey
As in DR9Q, we cross-correlate DR10Q with the ROSAT all sky survey Faint (Voges et al., 2000) and Bright (Voges et al., 1999) source catalogues with a matching radius of 30”. Only the most reliable detections are included in our catalog: when the quality detection is flagged as potentially problematic, we do not include the match.
There are 57 matches with the Bright Source Catalog and 586 with the Faint Source Catalog.
4.5.7 XMM-Newton
We cross-correlate the DR10Q catalog with the second XMM-Newton Serendipitous Source Catalog (Third Data Release, 2XMMi-DR3; Watson et al., 2009) using a standard 5” matching radius. The 2XMMi-DR3 catalog has observed 512 , with possible multiple observations of a given sky area.
We report the soft (0.5–2 keV) and hard (2–10 keV) fluxes, expressed in and the corresponding X-ray luminosities, expressed in . The latter are computed from the flux in each band using the visual inspection redshift (Z_VI) and .
A total of 506 of the sources have been observed more than once. In these cases, the observation with the longest exposure time has been used to compute the fluxes.
The XMM-Newton telescope has a set of three X-ray CCD cameras (MOS1, MOS2 and PN). The European Photon Imaging Camera (EPIC-PN) is preferred because of its higher quantum efficiency. If one source has no PN observation or insufficient amount of counts, the average of MOS1 and MOS2 camera fluxes was used to improve statistics. Reported fluxes for sources with less than 30 counts in each camera are given as the mean of the fluxes in PN, MOS1 and MOS2. Finally, in case of no detection or detection with significant errors (less than detections), we provide an upper limit for the flux in the hard band (2–10 keV). Such sources have the flag LX2_10_UPPER set to -1.
There are 2,311 matches with the 2XMMi-DR3 catalog.
5 Description of the DR10Q catalog
The DR10Q catalog is available as a binary FITS table file at the SDSS public website777http://www.sdss3.org/dr10/algorithms/qso_catalog.php. The FITS header contains all of the required documentation (format, name, unit of each column). Table LABEL:t:CatalogFormat provides a summary of the information contained in each of the columns in the catalog.
Notes on the catalog columns:
1. The DR10 object designation, given by the format SDSS Jhhmmss.ss+ddmmss.s; only the final 18
characters are listed in the catalog (i.e., the character string ”SDSS J” is dropped).
The coordinates in the object name follow IAU convention and are truncated, not rounded.
2-3. The J2000 coordinates (Right Ascension and Declination) in decimal degrees. The astrometry is from SDSS-DR10 (see Ahn et al., 2012).
4. The 64-bit integer that uniquely describes the objects that are listed in the SDSS (photometric and spectroscopic) catalogs (THING_ID).
5-7. Information about the spectroscopic observation (Spectroscopic plate number, Modified Julian Date, and spectroscopic fiber number) used to determine the characteristics of the spectrum. These three numbers are unique for each spectrum, and can be used to retrieve the digital spectra from the public SDSS database. When an object has been observed several times, we selected the best quality spectrum as defined by the SDSS pipeline (Bolton et al., 2012), i.e. with SPECPRIMARY = 1.
8. Redshift from the visual inspection, Z_VI.
9. Redshift from the BOSS pipeline (Bolton et al., 2012).
10. Error on the BOSS pipeline redshift estimate.
11. ZWARNING flag from the pipeline. ZWARNING 0 indicates uncertain results in the redshift-fitting code (Bolton et al., 2012).
12. Automatic redshift estimate using a linear combination of four principal components (see Section 4 of Pâris et al., 2012, for details). When the velocity difference between the automatic PCA and visual inspection redshift estimates is larger than 3000 , this PCA redshift is set to .
13. Error on the automatic PCA redshift estimate. If the PCA redshift is set to , the associated error is also set to .
14. Estimator of the PCA continuum quality (between 0 and 1) as given in Eq.(11) of Pâris et al. (2011).
15-17. Redshifts measured from the C iv, the C iii] complex and the Mg ii emission lines from a linear combination of five principal components (see Pâris et al. 2012). The line redshift is estimated using the maximum of each emission line, contrary to Z_PCA (column #12) that is a global estimate using all the information available in a given spectrum.
18. Morphological information: objects classified as point source by the SDSS photometric pipeline have SDSS_MORPHO = 0 while extended quasars have SDSS_MORPHO = 1. The vast majority of the quasars included in the present catalog are unresolved (SDSS_MORPHO = 0) as it is a requirement of the main quasar target selection (Ross et al., 2012).
19-21. The main target selection information is tracked with the BOSS_TARGET1 flag bits (19; see Table 2 in Ross et al., 2012, for a full description). Ancillary program target selection is tracked with the ANCILLARY_TARGET1 (20) and ANCILLARY_TARGET2 (21) flag bits. The bit values and the corresponding program names are listed in Dawson et al. (2013) and Appendix B.
22. A quasar previously known from the SDSS-DR7 quasar catalog (Schneider et al., 2010) has an entry equal to 1, and 0 otherwise. During Year 1 and 2, all SDSS-DR7 quasars with were re-observed. After Year 2, all SDSS-DR7 quasars with have been re-observed.
23-25. Spectroscopic plate number, Modified Julian Date, and spectroscopic fiber number in SDSS-DR7.
26. Uniform flag. See Section 4.3.
27. Spectral index . The continuum is approximated by a power-law, , and is computed in emission line free regions: 1,450-1,500 Å, 1,700-1,850 Å and 1,950-2,750Å in the quasar rest frame.
28. Median signal-to-noise ratio per pixel computed over the whole spectrum.
29-31. Median signal-to-noise ratio per pixel computed over the windows 1,650-1,750 Å (29), 2,950-3,050 Å (30), 2,950-3,050 Å (31) in the quasar rest frame. If the wavelength range is not covered by the BOSS spectrum, the value is set to .
32-35. FWHM (), blue and red half widths at half-maximum (HWHM; the sum of the latter two equals FWHM), and amplitude (in units of the median rms pixel noise, see Section 4 of Pâris et al., 2012) of the C iv emission line. If the emission line is not in the spectrum, the red and blue HWHM and the FWHM are set to .
36-37. Rest frame equivalent width and corresponding uncertainty in Å of the C iv emission line. If the emission line is not in the spectrum, these quantities are set to .
38-41. Same as 32-35 for the C iii] emission complex. It is well known that C iii]1909 is blended with Si iii]1892 and to a lesser extent with Al iii]1857. We do not attempt to deblend these lines. Therefore the redshift and red HFHM derived for this blend correspond to C iii]1909. The blue HFWM is obviously affected by the blend.
42-43. Rest frame equivalent width and corresponding uncertainty in Å of the C iii] emission complex.
44-47. Same as 32-35 for the Mg ii emission line.
48-49. Rest frame equivalent width and corresponding uncertainty in Å of the Mg ii emission line. We do not correct for the Fe ii emission.
50. BAL flag from the visual inspection, BAL_FLAG_VI. If a BAL feature was identified in the course of the visual inspection, BAL_FLAG_VI is set to 1, 0 otherwise. Note that BAL quasars are flagged during the visual inspection at any redshift.
51-52. Balnicity index (BI; Weymann et al., 1991) for C iv troughs, and their errors, expressed in . See definition in Section 5 of Pâris et al. (2012). The Balnicity index is measured for quasars with only so that the trough enters into the BOSS wavelength region. If the BAL flag from the visual inspection is set to 1 and the BI is equal to 0, this means either that there is no C iv trough (but a trough is seen in another transition) or that the trough seen during the visual inspection does not meet the formal requirement of the BAL definition. In cases with bad fits to the continuum, the balnicity index and its error are set to .
53-54. Absorption index, and its error, for C iv troughs expressed in . See definition in Section 5 of Pâris et al. (2012). In cases with bad continuum fit, the absorption index and its error are set to .
55. Following Trump et al. (2006), we calculate the reduced which we call for each C iv trough from Eq. (3) in Pâris et al. (2012). We require that troughs have 10 to be considered as true troughs.
56. Number of C iv troughs of width larger than 2,000 km s-1.
57-58. Limits of the velocity range in which C iv troughs of width larger than 2,000 km s-1 and reaching at least 10% below the continuum are to be found. Velocities are positive bluewards and the zero of the scale is at Z_VI. So if there are multiple troughs, this goes from one end of the first one to the other end of the last one.
59. Number of troughs of width larger than 450 km s-1.
60-61. Same as 59-60 for C iv troughs of width larger than 450 km s-1.
62-64. Rest frame equivalent width in Å of Si iv, C iv and Al iii troughs detected in BAL quasars with BI 500 and SNR_1700 5. They are set to 0 otherwise or in cases where no trough is detected and to if the continuum is not reliable.
65-66. The SDSS Imaging Run number and the Modified Julian Date (MJD) of the photometric observation used in the catalog.
67-70. Additional SDSS processing information: the photometric processing rerun number; the camera column (1–6) containing the image of the object, the field number of the run containing the object, and the object identification number (see Stoughton et al., 2002, for descriptions of these parameters).
71-72. DR10 PSF fluxes, expressed in nanomaggies, and inverse variances (not corrected for Galactic extinction) in the five SDSS filters.
73-74. DR10 PSF AB magnitudes and errors (not corrected for Galactic extinction) in the five SDSS filters (Lupton et al., 1999).
75. DR8 PSF fluxes (not corrected for Galactic extinction), expressed in nanommagies, in the five SDSS filters. This photometry is the one that was used for the main quasar target selection (Ross et al., 2012).
76. The absolute magnitude in the band at calculated after correction for Galactic extinction and assuming = 70 km s-1 Mpc-1, = 0.3, = 0.7, and a power-law (frequency) continuum index of . The K-correction is computed using Table 4 from Richards et al. (2006). We use the SDSS primary photometry to compute this value.
77. The color, which is the difference in the Galactic extinction corrected for the quasar and that of the mean of the quasars at that redshift . If is not defined for the quasar, which occurs for objects at either or ; the column will contain “”.
78. Galactic extinction in the five SDSS bands based on the maps of Schlegel et al. (1998). The quasar target selection was done using these maps.
79. Galactic extinction in the five SDSS bands based on Schlafly & Finkbeiner (2011).
80. The logarithm of the Galactic neutral hydrogen column density along the line of sight to the quasar. These values were estimated via interpolation of the 21-cm data from Stark et al. (1992), using the COLDEN software provided by the Chandra X-ray Center. Errors associated with the interpolation are expected to be typically less than cm-2 (e.g., see §5 of Elvis et al., 1994).
81. The logarithm of the vignetting-corrected count rate (photons s-1) in the broad energy band (0.1–2.4 keV) from the ROSAT All-Sky Survey Faint Source Catalog (Voges et al., 2000) and the ROSAT All-Sky Survey Bright Source Catalog (Voges et al., 1999). The matching radius was set to 30′′ (see Section 4.5.6).
82. The S/N of the ROSAT measurement.
83. Angular separation between the SDSS and ROSAT All-Sky Survey locations (in arcseconds).
84. Number of XMM-Newton matches in a 5” radius around the SDSS-DR10 quasar positions.
85. Soft X-ray flux (0.5–2 keV) from XMM-Newton matching, expressed in . In case of several observations, the one with the longest exposure time is used to compute the flux.
86. Hard X-ray flux (2–12 keV) from XMM-Newton matching, expressed in .
87. X-ray luminosity in the 0.5–2 keV band of XMM-Newton, expressed in . This value is computed using the visual inspection redshift (Z_VI) and .
88. X-ray luminosity in the 2–12 keV band of XMM-Newton, expressed in . This value is computed using the visual inspection redshift (Z_VI) and .
89. In case of unreliable or no detection in the 2–10 keV band the flux reported in column #86 is an upper limit. In that case, the LUMX2_10_UPPER flag listed in this column is set to .
90. Angular separation between the XMM-Newton and SDSS-DR10 locations, expressed in arcsec.
91. If a SDSS-DR10 quasar matches with GALEX photometring, GALEX_MATCHED is set to 1, 0 if not.
92-95. UV fluxes and inverse variances from GALEX, aperture-photometered from the original GALEX images in the two bands FUV and NUV. The fluxes are expressed in nanomaggies.
96-97. The magnitude and error from the Two Micron All Sky Survey All-Sky Data Release Point Source Catalog (Cutri et al., 2003) using a matching radius of 2.0′′ (see Section 4.5.3). A non-detection by 2MASS is indicated by a ”0.000” in these columns. Note that the 2MASS measurements are Vega-based, not AB, magnitudes.
98-99. S/N in the band and corresponding 2MASS jr_d flag that gives the meaning of the peculiar values of the magnitude and its error888see http://www.ipac.caltech.edu/2mass/releases/allsky/doc/ explsup.html.
100-103. Same as 96-99 for the -band.
104-107. Same as 96-99 for the -band.
108. Angular separation between the SDSS and 2MASS positions (in arcseconds).
109-110. The magnitude and error from the Wide-field Infrared Survey Explorer (WISE; Wright et al., 2010) All-Sky Data Release Point Source Catalog using a matching radius of 2.
111-112 S/N and in the WISE band.
113-116. Same as 109-112 for the -band.
117-120. Same as 109-112 for the -band.
121-124. Same as 109-112 for the -band.
125. WISE contamination and confusion flag.
126. Angular separation between SDSS and WISE positions (in arcsec).
127. If a SDSS-DR10 quasar matches UKIDSS aperture-photometering data, UKIDSS_MATCHED is set to 1, it is set to 0 if not.
128-135. Flux and error from UKIDSS, aperture-photometered from the original UKIDSS images in the four bands Y, J, H and K. The fluxes and errors are expressed in .
136. If there is a source in the FIRST radio catalog (version February 2012) within of the quasar position, the FIRST_MATCHED flag provided in this column is set to 1, O if not. If the quasar lies outside of the FIRST footprint, it is set to .
137. This column contains the FIRST peak flux density, expressed in mJy.
138. The S/N of the FIRST source whose flux is given in column 136.
139. Angular separation between the SDSS and FIRST positions (in arcsec).
6 Conclusions
We have presented the second quasar catalog of the SDSS-III/BOSS survey based on the first three years of observations. It contains 166,583 quasars, 117,668 having , with robust identification from visual inspection and refined redshift measurements based on the results of a principal component analysis of the spectra. The present catalog is almost twice as large as the catalog of the previous release (DR9Q; Pâris et al., 2012) As part of the DR10Q catalog, we also release a catalog of 16,461 BAL quasars and their properties together with a multi-wavelength matching with GALEX, 2MASS, UKIDSS, WISE, FIRST, RASS and XMM observations.
The next SDSS public release, SDSS-DR12, is scheduled for December 2014 and will contain more than 250,000 quasars, including about 200,000 quasars.
Acknowledgements.
I.P. received partial support from Center of Excellence in Astrophysics and Associated Technologies (PFB 06). The French Participation Group to SDSS-III was supported by the Agence Nationale de la Recherche under contracts ANR-08-BLAN-0222 and ANR-12-BS05-0015. A.D.M. is a research fellow of the Alexander von Humboldt Foundation of Germany and was partially supported through NSF Grant 1211112 and NASA ADAP award NNX12AE38G. Funding for SDSS-III has been provided by the Alfred P. Sloan Foundation, the Participating Institutions, the National Science Foundation, and the U.S. Department of Energy Office of Science. The SDSS-III web site is http://www.sdss3.org/. SDSS-III is managed by the Astrophysical Research Consortium for the Participating Institutions of the SDSS-III Collaboration including the University of Arizona, the Brazilian Participation Group, Brookhaven National Laboratory, Carnegie Mellon University, University of Florida, the French Participation Group, the German Participation Group, Harvard University, the Instituto de Astrofisica de Canarias, the Michigan State/Notre Dame/JINA Participation Group, Johns Hopkins University, Lawrence Berkeley National Laboratory, Max Planck Institute for Astrophysics, Max Planck Institute for Extraterrestrial Physics, New Mexico State University, New York University, Ohio State University, Pennsylvania State University, University of Portsmouth, Princeton University, the Spanish Participation Group, University of Tokyo, University of Utah, Vanderbilt University, University of Virginia, University of Washington, and Yale University.References
- Ahn et al. (2013) Ahn, C. P., Alexandroff, R., Allende Prieto, C., et al. 2013, arXiv:1307.7735
- Ahn et al. (2012) Ahn, C. P., Alexandroff, R., Allende Prieto, C., et al. 2012, ApJS, 203, 21
- Aihara et al. (2011) Aihara, H., Allende Prieto, C., An, D., et al. 2011, ApJS, 193, 29
- Alexandroff et al. (2013) Alexandroff, R., Strauss, M. A., Greene, J. E., et al. 2013, MNRAS, 435, 3306
- Allen et al. (2011) Allen, J. T., Hewett, P. C., Maddox, N., Richards, G. T., & Belokurov, V. 2011, MNRAS, 410, 860
- Anderson et al. (2012) Anderson, L., Aubourg, E., Bailey, S., et al. 2012, MNRAS, 427, 3435
- Becker et al. (1995) Becker, R. H., White, R. L., & Helfand, D. J. 1995, ApJ, 450, 559
- Bolton et al. (2012) Bolton, A. S., Schlegel, D. J., Aubourg, É., et al. 2012, AJ, 144, 144
- Bovy et al. (2011) Bovy, J., Hennawi, J. F., Hogg, D. W., et al. 2011, ApJ, 729, 141
- Bovy et al. (2012) Bovy, J., Myers, A. D., Hennawi, J. F., et al. 2012, ApJ, 749, 41
- Busca et al. (2013) Busca, N. G., Delubac, T., Rich, J., et al. 2013, A&A, 552, A96
- Croom et al. (2009) Croom, S. M., Richards, F. T., Shanks, T., & et al. 2009, MNRAS, 392, 19
- Croom et al. (2001) Croom, S. M., Shanks, T., Boyle, B. J., et al. 2001, MNRAS, 325, 483
- Croom et al. (2004) Croom, S. M., Smith, R. J., Boyle, B. J., et al. 2004, MNRAS, 349, 1397
- Cutri et al. (2003) Cutri, R. M., Skrutskie, M. F., van Dyk, S., et al. 2003, VizieR Online Data Catalog, 2246, 0
- Dawson et al. (2013) Dawson, K. S., Schlegel, D. J., Ahn, C. P., et al. 2013, AJ, 145, 10
- Eisenstein et al. (2011) Eisenstein, D. J., Weinberg, D. H., Agol, E., et al. 2011, AJ, 142, 72
- Elvis et al. (1994) Elvis, M., Lockman, F. J., & Fassnacht, C. 1994, ApJS, 95, 413
- Fukugita et al. (1996) Fukugita, M., Ichikawa, T., Gunn, J. E., et al. 1996, AJ, 111, 1748
- Gibson et al. (2009) Gibson, R. R., Jiang, L., Brandt, W. N., et al. 2009, ApJ, 692, 758
- Gunn et al. (1998) Gunn, J. E., Carr, M., Rockosi, C., et al. 1998, AJ, 116, 3040
- Gunn et al. (2006) Gunn, J. E., Siegmund, W. A., Mannery, E. J., et al. 2006, AJ, 131, 2332
- Hall et al. (2002) Hall, P. B., Anderson, S. F., Strauss, M. A., et al. 2002, ApJS, 141, 267
- Hogg et al. (2001) Hogg, D. W., Finkbeiner, D. P., Schlegel, D. J., & Gunn, J. E. 2001, AJ, 122, 2129
- Ivezić et al. (2004) Ivezić, Ž., Lupton, R. H., Schlegel, D., et al. 2004, Astronomische Nachrichten, 325, 583
- Kirkpatrick et al. (2011) Kirkpatrick, J. A., Schlegel, D. J., Ross, N. P., et al. 2011, ApJ, 743, 125
- Krawczyk et al. (2013) Krawczyk, C. M., Richards, G. T., Mehta, S. S., et al. 2013, ApJS, 206, 4
- Lawrence et al. (2007) Lawrence, A., Warren, S. J., Almaini, O., et al. 2007, MNRAS, 379, 1599
- Lupton et al. (2001) Lupton, R., Gunn, J. E., Ivezić, Z., et al. 2001, in Astronomical Society of the Pacific Conference Series, Vol. 238, Astronomical Data Analysis Software and Systems X, ed. F. R. Harnden Jr., F. A. Primini, & H. E. Payne, 269
- Lupton et al. (1999) Lupton, R. H., Gunn, J. E., & Szalay, A. S. 1999, AJ, 118, 1406
- Martin et al. (2005) Martin, D. C., Fanson, J., Schiminovich, D., et al. 2005, ApJ, 619, L1
- McDonald & Eisenstein (2007) McDonald, P. & Eisenstein, D. J. 2007, Phys. Rev. D, 76, 063009
- Padmanabhan et al. (2008) Padmanabhan, N., Schlegel, D. J., Finkbeiner, D. P., et al. 2008, ApJ, 674, 1217
- Pâris et al. (2012) Pâris, I., Petitjean, P., Aubourg, É., et al. 2012, A&A, 548, A66
- Pâris et al. (2011) Pâris, I., Petitjean, P., Rollinde, E., et al. 2011, A&A, 530, A50
- Pier et al. (2003) Pier, J. R., Munn, J. A., Hindsley, R. B., et al. 2003, AJ, 125, 1559
- Richards et al. (2009) Richards, G. T., Myers, A. D., Gray, A. G., et al. 2009, ApJS, 180, 67
- Richards et al. (2004) Richards, G. T., Nichol, R. C., Gray, A. G., et al. 2004, ApJS, 155, 257
- Richards et al. (2006) Richards, G. T., Strauss, M. A., Fan, X., et al. 2006, AJ, 131, 2766
- Ross et al. (2012) Ross, N. P., Myers, A. D., Sheldon, E. S., et al. 2012, ApJS, 199, 3
- Schlafly & Finkbeiner (2011) Schlafly, E. F. & Finkbeiner, D. P. 2011, ApJ, 737, 103
- Schlegel et al. (1998) Schlegel, D. J., Finkbeiner, D. P., & Davis, M. 1998, ApJ, 500, 525
- Schmidt (1963) Schmidt, M. 1963, Nature, 197, 1040
- Schneider et al. (2010) Schneider, D. P., Richards, G. T., Hall, P. B., et al. 2010, AJ, 139, 2360
- Skrutskie et al. (2006) Skrutskie, M. F., Cutri, R. M., Stiening, R., et al. 2006, AJ, 131, 1163
- Slosar et al. (2013) Slosar, A., Iršič, V., Kirkby, D., et al. 2013, J. Cosmology Astropart. Phys., 4, 26
- Smee et al. (2013) Smee, S. A., Gunn, J. E., Uomoto, A., et al. 2013, AJ, 146, 32
- Smith et al. (2002) Smith, J. A., Tucker, D. L., Kent, S., et al. 2002, AJ, 123, 2121
- Spergel et al. (2003) Spergel, D. N., Verde, L., Peiris, H. V., & et al. 2003, ApJS, 148, 175
- Stark et al. (1992) Stark, A. A., Gammie, C. F., Wilson, R. W., et al. 1992, ApJS, 79, 77
- Stoughton et al. (2002) Stoughton, C., Lupton, R. H., Bernardi, M., et al. 2002, AJ, 123, 485
- Trump et al. (2006) Trump, J. R., Hall, P. B., Reichard, T. A., et al. 2006, ApJS, 165, 1
- Tucker et al. (2006) Tucker, D. L., Kent, S., Richmond, M. W., et al. 2006, Astronomische Nachrichten, 327, 821
- Voges et al. (1999) Voges, W., Aschenbach, B., Boller, T., et al. 1999, A&A, 349, 389
- Voges et al. (2000) Voges, W., Aschenbach, B., Boller, T., et al. 2000, IAU Circ., 7432, 3
- Watson et al. (2009) Watson, M. G., Schröder, A. C., Fyfe, D., et al. 2009, A&A, 493, 339
- Weymann et al. (1991) Weymann, R. J., Morris, S. L., Foltz, C. B., & Hewett, P. C. 1991, ApJ, 373, 23
- White et al. (2012) White, M., Myers, A. D., Ross, N. P., et al. 2012, MNRAS, 424, 933
- Wright et al. (2010) Wright, E. L., Eisenhardt, P. R. M., Mainzer, A. K., et al. 2010, AJ, 140, 1868
- Yèche et al. (2010) Yèche, C., Petitjean, P., Rich, J., et al. 2010, A&A, 523, A14
- York et al. (2000) York, D. G., Adelman, J., Anderson, Jr., J. E., et al. 2000, AJ, 120, 1579
| Column | Name | Format | Descriptiona |
|---|---|---|---|
| 1 | SDSS_NAME | STRING | SDSS-DR10 designation hhmmss.ss+ddmmss.s (J2000) |
| 2 | RA | DOUBLE | Right Ascension in decimal degrees (J2000) |
| 3 | DEC | DOUBLE | Declination in decimal degrees (J2000) |
| 4 | THING_ID | INT32 | Thing_ID |
| 5 | PLATE | INT32 | Spectroscopic Plate number |
| 6 | MJD | INT32 | Spectroscopic MJD |
| 7 | FIBERID | INT32 | Spectroscopic Fiber number |
| 8 | Z_VI | DOUBLE | Redshift from visual inspection |
| 9 | Z_PIPE | DOUBLE | Redshift from BOSS pipeline |
| 10 | ERR_ZPIPE | DOUBLE | Error on BOSS pipeline redshift |
| 11 | ZWARNING | INT32 | ZWARNING flag |
| 12 | Z_PCA | DOUBLE | Refined PCA redshift |
| 13 | ERR_ZPCA | DOUBLE | Error on refined PCA redshift |
| 14 | PCA_QUAL | DOUBLE | Estimator of the PCA continuum quality |
| 15 | Z_CIV | DOUBLE | Redshift of C iv emission line |
| 16 | Z_CIII | DOUBLE | Redshift of C iii] emission complex |
| 17 | Z_MGII | DOUBLE | Redshift of Mg ii emission line |
| 18 | SDSS_MORPHO | INT32 | SDSS morphology flag 0 = point source 1 = extended |
| 19 | BOSS_TARGET1 | INT64 | BOSS target flag for main survey |
| 20 | ANCILLARY_TARGET1 | INT64 | BOSS target flag for ancillary programs |
| 21 | ANCILLARY_TARGET2 | INT64 | BOSS target flag for ancillary programs |
| 22 | SDSS_DR7 | INT32 | 1 if the quasar is known from DR7 |
| 23 | PLATE_DR7 | INT32 | SDSS-DR7 spectroscopic Plate number if the quasar is known from DR7 |
| 24 | MJD_DR7 | INT32 | SDSS-DR7 spectroscopic MJD if the quasar is known from DR7 |
| 25 | FIBERID_DR7 | INT32 | SDSS-DR7 spectroscopic Fiber number if the quasar is known from DR7 |
| 26 | UNIFORM | INT32 | Uniform sample flag |
| 27 | ALPHA_NU | FLOAT | Spectral index measurement |
| 28 | SNR_SPEC | FLOAT | Median signal-to-noise ratio over the whole spectrum |
| 29 | SNR_1700 | FLOAT | Median signal-to-noise ratio in the window 1,650 - 1,750Å (rest frame) |
| 30 | SNR_3000 | FLOAT | Median signal-to-noise ratio in the window 2,950 - 3,050Å (rest frame) |
| 31 | SNR_5150 | FLOAT | Median signal-to-noise ratio in the window 5,100 - 5,250Å (rest frame) |
| 32 | FWHM_CIV | DOUBLE | FWHM of C iv emission line in |
| 33 | BHWHM_CIV | DOUBLE | Blue HWHM of C iv emission line in |
| 34 | RHWHM_CIV | DOUBLE | Red HWHM of C iv emission line in |
| 35 | AMP_CIV | DOUBLE | Amplitude of C iv emission line in units of median rms pixel noise |
| 36 | REWE_CIV | DOUBLE | Rest frame equivalent width of C iv emission line in Å |
| 37 | ERR_REWE_CIV | DOUBLE | Uncertainty on the rest frame equivalent width of C iv emission line in Å |
| 38 | FWHM_CIII | DOUBLE | FWHM of C iii] emission complex in |
| 39 | BHWHM_CIII | DOUBLE | Blue HWHM of C iii] emission line in |
| 40 | RHWHM_CIII | DOUBLE | Red HWHM of C iii] emission line in |
| 41 | AMP_CIII | DOUBLE | Amplitude of C iii] emission complex in units of median rms pixel noise |
| 42 | REWE_CIII | DOUBLE | Rest frame equivalent width of C iii] emission line in Å |
| 43 | ERR_REWE_CIII | DOUBLE | Uncertainty on the rest frame equivalent width of C iii] emission complex in Å |
| 44 | FWHM_MGII | DOUBLE | FWHM of Mg ii emission line in |
| 45 | BHWHM_MGII | DOUBLE | Blue HWHM of Mg ii emission line in |
| 46 | RHWHM_MGII | DOUBLE | Red HWHM of Mg ii emission line in |
| 47 | AMP_MGII | DOUBLE | Amplitude of Mg ii emission line in units of median rms pixel noise |
| 48 | REWE_MGII | DOUBLE | Rest frame equivalent width of Mg ii emission line in Å |
| 49 | ERR_REWE_MGII | DOUBLE | Uncertainty on the rest frame equivalent width of Mg ii emission in Å |
| 50 | BAL_FLAG_VI | INT32 | BAL flag from visual inspection |
| 51 | BI_CIV | DOUBLE | Balnicity index of C iv trough (in ) |
| 52 | ERR_BI_CIV | DOUBLE | Error on the Balnicity index of C iv trough (in ) |
| 53 | AI_CIV | DOUBLE | Absorption index of C iv trough (in ) |
| 54 | ERR_AI_CIV | DOUBLE | Error on the absorption index of C iv trough (in ) |
| 55 | CHI2THROUGH | DOUBLE | of the trough from Eq. (3) in Pâris et al. (2012) |
| 56 | NCIV_2000 | INT32 | Number of distinct C iv troughs of width larger than 2,000 km s-1 |
| 57 | VMIN_CIV_2000 | DOUBLE | Minimum velocity of the C iv troughs defined in row 53 () |
| 58 | VMAX_CIV_2000 | DOUBLE | Maximum velocity of the C iv troughs defined in row 53 (in ) |
| 59 | NCIV_450 | INT32 | Number of distinct C iv troughs of width larger than 450 km s-1 |
| 60 | VMIN_CIV_450 | DOUBLE | Minimum velocity of the C iv troughs defined in row 55 (in ) |
| 61 | VMAX_CIV_450 | DOUBLE | Maximum velocity of the C iv troughs defined in row 55 (in ) |
| 62 | REW_SIIV | DOUBLE | rest frame equivalent width of the Si iv trough |
| 63 | REW_CIV | DOUBLE | rest frame equivalent width of the C iv trough |
| 64 | REW_ALIII | DOUBLE | rest frame equivalent width of the Al iii trough |
| 65 | RUN_NUMBER | INT32 | SDSS Imaging Run Number of photometric measurements |
| 66 | PHOTO_MJD | INT32 | Modified Julian Date of imaging observation |
| 67 | RERUN_NUMBER | STRING | SDSS Photometric Processing Rerun Number |
| 68 | COL_NUMBER | INT32 | SDSS Camera Column Number (1-6) |
| 69 | FIELD_NUMBER | INT32 | SDSS Field Number |
| 70 | OBJ_ID | STRING | SDSS Object Identification Number |
| 71 | PSFFLUX | FLOAT[5] | flux in the ,,, and -bands (not corrected for Galactic extinction) |
| 72 | IVAR_PSFLUX | FLOAT[5] | inverse variance of ,,, and fluxes |
| 73 | PSFMAG | FLOAT[5] | PSF magnitudes in ,,, and -bands (not corrected for Galactic extinction) |
| 74 | ERR_PSFMAG | FLOAT[5] | error in ,,, and PSF magnitudes |
| 75 | TARGET_FLUX | FLOAT[5] | TARGET flux in the ,,, and -bands (not corrected for Galactic extinction) |
| 76 | MI | FLOAT | |
| 77 | DGMI | FLOAT | (Galactic extinction corrected) |
| 78 | GAL_EXT | FLOAT[5] | Galactic extinction in the 5 SDSS bands from Schlegel et al. (1998) |
| 79 | GAL_EXT_RECAL | FLOAT[5] | Galactic extinction in the 5 SDSS bands from Schlafly & Finkbeiner (2011) |
| 80 | HI_GAL | FLOAT | (logarithm of Galactic H i column density in ) |
| 81 | RASS_COUNTS | DOUBLE | log RASS full band count rate (counts s-1) |
| 82 | RASS_COUNTS_SNR | FLOAT | S/N of the RASS count rate |
| 83 | SDSS2ROSAT_SEP | DOUBLE | SDSS-RASS separation in arcsec |
| 84 | N_DETECTION_XMM | INT32 | Number of detections in XMM-Newton |
| 85 | FLUX05_2KEV | DOUBLE | Soft (0.5-2 keV) X-ray flux from XMM-Newton () |
| 86 | FLUX2_12KEV | DOUBLE | Hard (2-12 keV) X-ray flux from XMM-Newton () |
| 87 | LUM05_2KEV | DOUBLE | Soft (0.5-2 keV) X-ray luminosity from XMM-Newton () using Z_VI |
| and | |||
| 88 | LUM2_12KEV | DOUBLE | Hard (2-12 keV) X-ray luminosity from XMM-Newton () using Z_VI |
| and | |||
| 89 | LUMX2_10_UPPER | DOUBLE | Flag for upper limit of hard X-ray flux (in col. #86) |
| 90 | SDSS2XMM_SEP | DOUBLE | SDSS-XMM-Newton separation in arcsec |
| 91 | GALEX_MATCHED | SHORT | GALEX match |
| 92 | FUV | DOUBLE | flux (GALEX) |
| 93 | FUV_IVAR | DOUBLE | Inverse variance of flux |
| 94 | NUV | DOUBLE | flux (GALEX) |
| 95 | NUV_IVAR | DOUBLE | Inverse variance of flux |
| 96 | JMAG | DOUBLE | magnitude (Vega, 2MASS) |
| 97 | ERR_JMAG | DOUBLE | Error in magnitude |
| 98 | JSNR | DOUBLE | J-band S/N |
| 99 | JRDFLAG | INT32 | J-band photometry flag |
| 100 | HMAG | DOUBLE | magnitude (Vega, 2MASS) |
| 101 | ERR_HMAG | DOUBLE | Error in magnitude |
| 102 | HSNR | DOUBLE | H-band S/N |
| 103 | HRDFLAG | INT32 | H-band photometry flag |
| 104 | KMAG | DOUBLE | magnitude (Vega, 2MASS) |
| 105 | ERR_KMAG | DOUBLE | Error in magnitude |
| 106 | KSNR | DOUBLE | K-band S/N |
| 107 | KRDFLAG | INT32 | K-band photometry flag |
| 108 | SDSS2MASS_SEP | DOUBLE | SDSS-2MASS separation in arcsec |
| 109 | W1MAG | DOUBLE | magnitude (Vega, WISE) |
| 110 | ERR_W1MAG | DOUBLE | Error in magnitude |
| 111 | W1SNR | DOUBLE | S/N in w1 band |
| 112 | W1CHI2 | DOUBLE | in w1 band |
| 113 | W2MAG | DOUBLE | magnitude (Vega, WISE) |
| 114 | ERR_W2MAG | DOUBLE | Error in magnitude |
| 115 | W2SNR | DOUBLE | S/N in w1 band |
| 116 | W2CHI2 | DOUBLE | in w1 band |
| 117 | W3MAG | DOUBLE | magnitude (Vega, WISE) |
| 118 | ERR_W3MAG | DOUBLE | Error in magnitude |
| 119 | W3SNR | DOUBLE | S/N in w1 band |
| 120 | W3CHI2 | DOUBLE | in w1 band |
| 121 | W4MAG | DOUBLE | magnitude (Vega, WISE) |
| 122 | ERR_W4MAG | DOUBLE | Error in magnitude |
| 123 | W4SNR | DOUBLE | S/N in w1 band |
| 124 | W4CHI2 | DOUBLE | in w1 band |
| 125 | CC_FLAGS | STRING | WISE contamination and confusion flag |
| 126 | SDSS2WISE_SEP | DOUBLE | SDSS-WISE separation in arcsec |
| 127 | UKIDSS_MATCHED | SHORT | UKIDSS Matched |
| 128 | YFLUX | DOUBLE | Y-band flux from UKIDSS (in ) |
| 129 | YFLUX_ERR | DOUBLE | Error in Y-band flux from UKIDSS (in ) |
| 130 | JFLUX | DOUBLE | J-band flux from UKIDSS (in ) |
| 131 | JFLUX_ERR | DOUBLE | Error in J-band flux from UKIDSS (in ) |
| 132 | HFLUX | DOUBLE | H-band flux from UKIDSS (in ) |
| 133 | HFLUX_ERR | DOUBLE | Error in H-band flux from UKIDSS (in ) |
| 134 | KFLUX | DOUBLE | K-band flux from UKIDSS (in ) |
| 135 | KFLUX_ERR | DOUBLE | Error in K-band flux from UKIDSS (in ) |
| 136 | FIRST_MATCHED | INT | FIRST matched |
| 137 | FIRST_FLUX | DOUBLE | FIRST peak flux density at 20 cm expressed in mJy |
| 138 | FIRST_SNR | DOUBLE | S/N of the FIRST flux density |
| 139 | SDSS2FIRST_SEP | DOUBLE | SDSS-FIRST separation in arcsec |
| a All magnitudes are PSF magnitudes | |||
Appendix A List of target selection flags
Table 5 presents the list of target selection bits used to select the parent sample of quasar targets (i.e., without serendipitous quasars from galaxy targets) together with the result of the visual inspection.
The main quasar target selection (Ross et al. 2012) is encoded with the target selection flag BOSS_TARGET1 while the various ancillary program target selections are encoded via the flags ANCILLARY_TARGET1 and ANCILLARY_TARGET2 (Dawson et al. 2013). A given quasar target can be selected by various algorithms or different ancillary programs, and hence the numbers given in Table 5 are not cumulative.
| Selection | Maskbits | # Objects | # QSO | # QSO | # STAR | # GALAXY | # ? | # BAD |
|---|---|---|---|---|---|---|---|---|
| BOSS_TARGET1 | ||||||||
| QSO_CORE | 10 | 3402 | 1349 | 1089 | 1941 | 64 | 40 | 8 |
| QSO_BONUS | 11 | 4149 | 788 | 469 | 3231 | 84 | 35 | 11 |
| QSO_KNOWN_MIDZ | 12 | 15020 | 14919 | 14781 | 34 | 1 | 40 | 26 |
| QSO_KNOWN_LOHIZ | 13 | 57 | 57 | 1 | 0 | 0 | 0 | 0 |
| QSO_NN | 14 | 139310 | 92311 | 74711 | 44192 | 1119 | 781 | 907 |
| QSO_UKIDSS | 15 | 48 | 27 | 22 | 19 | 2 | 0 | 0 |
| QSO_LIKE_COADD | 16 | 1368 | 314 | 229 | 918 | 55 | 61 | 20 |
| QSO_LIKE | 17 | 109433 | 66565 | 46193 | 38749 | 2023 | 1127 | 969 |
| QSO_FIRST_BOSS | 18 | 6195 | 4884 | 3314 | 638 | 240 | 359 | 74 |
| QSO_KDE | 19 | 162988 | 94868 | 73075 | 64277 | 1680 | 1115 | 1048 |
| QSO_CORE_MAIN | 40 | 130024 | 82672 | 67642 | 43885 | 1374 | 1051 | 1042 |
| QSO_BONUS_MAIN | 41 | 264278 | 144539 | 108756 | 108993 | 5473 | 2812 | 2461 |
| QSO_CORE_ED | 42 | 32659 | 21863 | 18553 | 9930 | 269 | 285 | 312 |
| QSO_CORE_LIKE | 43 | 34919 | 25924 | 18945 | 8003 | 446 | 266 | 280 |
| QSO_KNOWN_SUPPZ | 44 | 57 | 57 | 1 | 0 | 0 | 0 | 0 |
| ANCILLARY_TARGET1 | ||||||||
| BLAZGVAR | 6 | 2 | 1 | 0 | 0 | 0 | 1 | 0 |
| BLAZR | 7 | 6 | 2 | 0 | 0 | 4 | 0 | 0 |
| BLAZXR | 8 | 361 | 102 | 5 | 27 | 202 | 30 | 0 |
| BLAZXRSAL | 9 | 3 | 3 | 1 | 0 | 0 | 0 | 0 |
| BLAZXRVAR | 10 | 1 | 0 | 0 | 0 | 0 | 1 | 0 |
| XMMBRIGHT | 11 | 413 | 314 | 15 | 14 | 84 | 1 | 0 |
| XMMGRIZ | 12 | 62 | 14 | 8 | 21 | 18 | 8 | 1 |
| XMMHR | 13 | 476 | 141 | 14 | 24 | 294 | 14 | 3 |
| XMMRED | 14 | 337 | 57 | 2 | 42 | 234 | 1 | 3 |
| FBQSBAL | 15 | 6 | 5 | 2 | 0 | 0 | 1 | 0 |
| LBQSBAL | 16 | 6 | 6 | 0 | 0 | 0 | 0 | 0 |
| ODDBAL | 17 | 21 | 15 | 6 | 1 | 1 | 4 | 0 |
| OTBAL | 18 | 11 | 2 | 0 | 0 | 0 | 9 | 0 |
| PREVBAL | 19 | 10 | 10 | 2 | 0 | 0 | 0 | 0 |
| VARBAL | 20 | 1007 | 999 | 370 | 0 | 0 | 4 | 4 |
| QSO_AAL | 22 | 324 | 319 | 2 | 1 | 1 | 1 | 2 |
| QSO_AALS | 23 | 622 | 617 | 35 | 0 | 0 | 1 | 4 |
| QSO_IAL | 24 | 195 | 194 | 2 | 0 | 0 | 1 | 0 |
| QSO_RADIO | 25 | 157 | 155 | 8 | 1 | 0 | 1 | 0 |
| QSO_RADIO_AAL | 26 | 104 | 104 | 0 | 0 | 0 | 0 | 0 |
| QSO_RADIO_IAL | 27 | 56 | 55 | 0 | 0 | 0 | 1 | 0 |
| QSO_NOAALS | 28 | 53 | 53 | 1 | 0 | 0 | 0 | 0 |
| QSO_GRI | 29 | 1503 | 584 | 561 | 466 | 300 | 114 | 39 |
| QSO_HIZ | 30 | 393 | 0 | 0 | 351 | 3 | 15 | 24 |
| QSO_RIZ | 31 | 1089 | 70 | 66 | 838 | 111 | 50 | 20 |
| BLAZGRFLAT | 50 | 74 | 42 | 6 | 9 | 5 | 15 | 3 |
| BLAZGRQSO | 51 | 94 | 58 | 14 | 14 | 3 | 19 | 0 |
| BLAZGX | 52 | 8 | 2 | 0 | 5 | 1 | 0 | 0 |
| BLAZGXQSO | 53 | 31 | 29 | 2 | 0 | 1 | 1 | 0 |
| BLAZGXR | 54 | 100 | 33 | 3 | 12 | 21 | 34 | 0 |
| CXOBRIGHT | 58 | 99 | 66 | 2 | 3 | 27 | 3 | 0 |
| CXORED | 59 | 17 | 6 | 2 | 3 | 4 | 3 | 1 |
| ANCILLARY_TARGET2 | ||||||||
| HIZQSO82 | 0 | 57 | 2 | 2 | 54 | 1 | 0 | 0 |
| HIZQSOIR | 1 | 86 | 2 | 1 | 77 | 0 | 4 | 3 |
| KQSO_BOSS | 2 | 183 | 86 | 40 | 88 | 4 | 4 | 1 |
| QSO_VAR | 3 | 1370 | 865 | 311 | 424 | 79 | 0 | 2 |
| QSO_VAR_FPG | 4 | 579 | 557 | 284 | 5 | 3 | 9 | 5 |
| RADIO_2LOBE_QSO | 5 | 806 | 402 | 39 | 265 | 76 | 48 | 15 |
| QSO_SUPPZ | 7 | 2824 | 2805 | 14 | 2 | 0 | 4 | 13 |
| QSO_VAR_SDSS | 8 | 15375 | 5857 | 3003 | 8329 | 224 | 551 | 414 |
| QSO_WISE_SUPP | 9 | 5007 | 2988 | 999 | 1561 | 303 | 135 | 20 |
Appendix B Description of the superset of DR10Q
We visually inspected 321,729 quasar candidates to produce the DR10Q catalog. We provide the basic properties (spectroscopic and photometric) of all the quasar targets, together with the result of the visual inspection, in the form of the binary fits file that is available at the SDSS public website999http://www.sdss3.org/dr10/algorithms/qso_catalog.php. The FITS header contains all of the required documentation (format, name, unit of each column).
| Column | Name | Format | Description |
|---|---|---|---|
| 1 | SDSS_NAME | STRING | SDSS-DR10 designation hhmmss.ss+ddmmss.s (J2000) |
| 2 | RA | DOUBLE | Right Ascension in decimal degrees (J2000) |
| 3 | DEC | DOUBLE | Declination in decimal degrees (J2000) |
| 4 | THING_ID | INT32 | Thing_ID |
| 5 | PLATE | INT32 | Spectroscopic Plate number |
| 6 | MJD | INT32 | Spectroscopic MJD |
| 7 | FIBERID | INT32 | Spectroscopic Fiber number |
| 8 | Z_VI | DOUBLE | Redshift from visual inspection |
| 9 | Z_PIPE | DOUBLE | Redshift from BOSS pipeline |
| 10 | ERR_ZPIPE | DOUBLE | Error on BOSS pipeline redshift |
| 11 | ZWARNING | INT32 | ZWARNING flag |
| 12 | CLASS_PERSON | INT32 | Classification from the visual inspection |
| 13 | Z_CONF_PERSON | INT32 | Redshift confidence from visual inspection |
| 14 | SDSS_MORPHO | INT32 | SDSS morphology flag 0 = point source 1 = extended |
| 15 | BOSS_TARGET1 | INT64 | BOSS target flag for main survey |
| 16 | ANCILLARY_TARGET1 | INT64 | BOSS target flag for ancillary programs |
| 17 | ANCILLARY_TARGET2 | INT64 | BOSS target flag for ancillary programs |
| 18 | PSFFLUX | FLOAT[5] | flux in the ,,, and -bands (not corrected for Galactic extinction) |
| 19 | IVAR_PSFLUX | FLOAT[5] | inverse variance of ,,, and fluxes |
| 20 | PSFMAG | FLOAT[5] | PSF magnitudes in ,,, and -bands (not corrected for Galactic extinction) |
| 21 | ERR_PSFMAG | FLOAT[5] | error in ,,, and PSF magnitudes |
| 22 | TARGET_FLUX | FLOAT[5] | TARGET flux in the ,,, and -bands (not corrected for Galactic extinction) |
| 23 | GAL_EXT | FLOAT[5] | Galactic extinction in the 5 SDSS bands (from Schlegel et al. 1998) |