Constraints on Massive Star Formation: Cygnus OB2 was always an Association
Abstract
We examine substructure and mass segregation in the massive OB association Cygnus OB2 to better understand its initial conditions. Using a well understood Chandra X-ray selected sample of young stars we find that Cyg OB2 exhibits considerable physical substructure and has no evidence for mass segregation, both indications that the association is not dynamically evolved. Combined with previous kinematical studies we conclude that Cyg OB2 is dynamically very young, and what we observe now is very close to its initial conditions: Cyg OB2 formed as a highly substructured, unbound association with a low volume density ( stars pc-3). This is inconsistent with the idea that all stars form in dense, compact clusters. The massive stars in Cyg OB2 show no evidence for having formed particularly close to one another, nor in regions of higher than average density. Since Cyg OB2 contains stars as massive as 100 M⊙ this result suggests that very massive stars can be born in relatively low-density environments. This would imply that massive stars in Cyg OB2 did not form by competitive accretion, or by mergers.
keywords:
stars: formation - kinematics and dynamics - open clusters and associations: individual: Cygnus OB21 Introduction
The question of whether all stars form in dense clusters is of crucial importance, as it has implications for theories of star formation (e.g., Bonnell et al., 2001), the processing of binary systems (e.g., Parker et al., 2011), and the conditions for the evolution of protoplanetary disks and the formation of planetary systems (Armitage, 2000; Adams et al., 2006; Parker & Quanz, 2012). In particular, some theories of massive star formation, such as competitive accretion (Bonnell et al., 2001) and stellar mergers, require a dense stellar environment, while other scenarios, such as monolithic collapse (e.g., Yorke & Sonnhalter, 2002), can occur in (and might require) relatively low-density environments (see Zinnecker & Yorke, 2007, for a review).
There are two competing theories of star formation, and although the reality is likely to be an intermediate combination of the two it can be useful to compare and contrast these theories so that they can be tested. In ‘clustered star formation’ the majority of stars form in dense embedded groups containing thousands to hundreds of thousands of stars within parsec-sized regions (e.g., Lada et al., 1991; Carpenter et al., 1997; Kroupa, 2011). The feedback-induced expulsion of residual gas left over from the star formation process destroys 90% of these young clusters within the first 10 Myrs (Hills, 1980; Lada et al., 1984; Goodwin & Bastian, 2006). This widely held view was most prominent advocated by Lada & Lada (2003) and based on the large number of embedded clusters discovered in the near-IR (e.g., Carpenter, 2000). However, recent mid-IR observations have challenged this view by revealing that young stellar objects are correlated with the hierarchically structured interstellar medium (Gutermuth et al., 2011) and found over a wide range of stellar surface densities (Bressert et al., 2010) suggesting there is no preferred scale of star formation.
What is clear is that only around 10% of stars find themselves in gas-free bound clusters after a few Myr (Lada & Lada, 2003). Many other young stars are found in OB associations: loose, co-moving young stellar groups containing O and/or early B-type stars (Blaauw, 1964) with a similar stellar content to young star clusters (e.g., Bastian et al., 2010). Their low stellar mass densities (0.1 M⊙ pc-3) imply that they are gravitationally unbound and therefore expanding, which has led to suggestions that they are the expanded remnants of young star clusters disrupted by gas removal (Lada & Lada, 1991; Brown et al., 1997; Kroupa et al., 2001).
Alternatively, in ‘hierarchical star formation’ stars form at a smoothly varying distribution of densities with significant substructure on pc (or greater) scales and denser sub-areas nested within larger, less dense areas (e.g., Scalo, 1985; Elmegreen et al., 2006; Bastian et al., 2007). Clusters are formed by merging substructures in the densest subvirial regions (Allison et al., 2009), whilst low density and unbound regions become OB associations.
These two scenarios provide very different mechanisms for the formation of OB associations, both of which provide clear observational discriminants. In clustered star formation, associations are the expanding remnants of a dynamically evolved dense star cluster. Mixing in the dense star cluster will have erased any initial substructure (Scally & Clarke, 2002; Goodwin & Whitworth, 2004; Parker & Meyer, 2012), but should retain or enhance any mass segregation (which is often observed in bound clusters, e.g., Hillenbrand et al., 1998; Stolte et al., 2002). But in hierarchical star formation associations are dynamically young and should retain any initial substructure (Scally & Clarke, 2002; Goodwin & Whitworth, 2004; Parker & Meyer, 2012), and will only exhibit mass segregation if it was present initially. Thus, substructure (spatial or dynamical) and mass segregation both provide measurable indicators of the level of dynamical evolution within a group of stars, acting as diagnostics of the original physical and dynamical state of the stars when they formed (see Parker et al., 2013). For example Preibisch & Zinnecker (1999) argued from the kinematics and distribution of stars in the Upper Sco OB association that it must have formed as an association, and very recently, Jesús Delgado et al. (2013) used measures of structure and mass segregation to argue for very different dynamical histories for the Berkeley 94 and Berkeley 96 open clusters.
In this paper we attempt to constrain the initial conditions of the formation of the massive OB association Cygnus OB2 using indicators of dynamical evolution such as substructure and mass segregation. Cyg OB2 is one of the largest OB associations in our Galaxy with an estimated stellar mass of M⊙ (Drew et al., 2008; Wright et al., 2010) and home to many massive stars with masses up to 100 M⊙ (e.g., Massey & Thompson, 1991; Comerón et al., 2002; Hanson, 2003), which have an extreme impact on their environment (Wright et al., 2012). Furthermore at a distance of only 1.4 kpc (Rygl et al., 2012) it can be studied in sufficient detail to resolve and characterise both high and low-mass stars. This paper is outlined as follows. In Section 2 we introduce the observational sample used for this study and in Section 3 we outline the substructure and mass segregation diagnostics used. In Section 4 we present out results and discuss possible biases, and in Section 5 we discuss our findings in terms of the dynamical and structural evolution of Cyg OB2 and consider the implications of our results for both Cyg OB2 and theories of massive star formation.
2 Sample of young stars in Cyg OB2
The observational sample used here is the X-ray selected sample of Cyg OB2 members presented by Wright & Drake (2009). X-ray observations offer a largely unbiased diagnostic of youth that is highly effective in separating young association members from older field stars. This is because pre-main-sequence stars are typically 10–1000 times more luminous in X-rays than main-sequence stars (e.g., Preibisch & Feigelson, 2005) due to enhanced magnetic activity (for low-mass stars, e.g., Wright et al., 2011) and collisions in strong stellar winds (for high-mass stars, e.g., Nazé et al., 2011). The only exception to this is A- and late B-type stars that are not believed to emit X-rays (e.g., Schmitt, 1997). Another commonly used method for selecting young stars is to use infrared observations to identify stars with circumstellar disks, as recently done by Guarcello et al. (2013). However, in regions such as Cyg OB2 where the fraction of stars with circumstellar disks is very low (e.g., Albacete Colombo et al., 2007; Wright et al., 2010) and where feedback from the massive O-type stars (e.g., Wright et al., 2012) may photoevaporate circumstellar disks and therefore spatially bias the distribution of stars with disks this method could bias studies of the spatial distribution of stars. X-ray observations can however be sensitive to absorption due to neutral hydrogen along the line of sight, the effects of which broadly scale with absorption due to dust, affecting the detection of embedded sources. Fortunately Cyg OB2 has already dispersed the molecular cloud from which it formed (e.g., Schneider et al., 2006), with very little evidence for an H ii region in its vicinity (Vink et al., 2008), and Guarcello et al. (2013) noted a dearth of embedded infrared sources toward the centre of the association.
Wright & Drake (2009) presented a catalogue of X-ray sources in Cyg OB2 from two observations with the Chandra X-ray Observatory. The deeper of these two observations was centered on the core of the association and it is the sources from this observation that we use here. Wright et al. (2010) studied the properties of these sources, using optical photometry from IPHAS (INT Photometric H Survey, Drew et al., 2005) to identify and remove foreground contaminants. The masses of stars in the sample range from 80 M⊙ for Cyg OB2 #7, an O3 supergiant, down to 0.1 M⊙. The masses of the high-mass stars were derived from spectroscopy and fitting to evolutionary models (Kiminki et al., 2007) and are therefore quite reliable. The masses of individual low-mass stars, while less reliable, are not necessary for the mass segregation diagnostics used here and this is not therefore a concern.
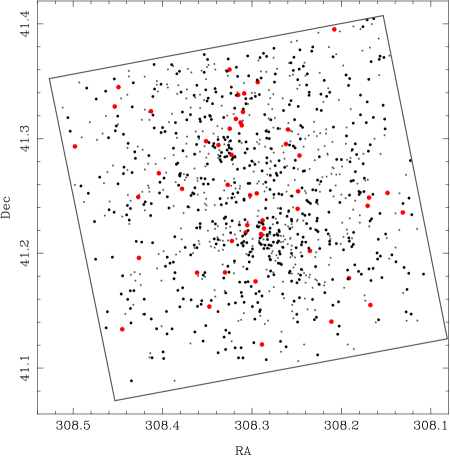
Chandra’s sensitivity to point sources is highly dependent on the size of the point spread function, which is itself dependent on the distance from the centre of the observation, known as the off-axis angle. This leads to a spatially varying sensitivity that could affect the detection of low-mass stars. Since mass segregation is effectively diagnosing differences in the spatial distribution of stars as a function of their mass it is important that we work with a sample free from mass-dependent spatially varying incompleteness. Wright et al. (2010) found that the X-ray luminosity function of our sample was in good agreement with that derived from X-ray studies of other young clusters down to a mass of 1 M⊙ and that the mass function could be fitted with a slope of (excluding A and B-type stars as described above), in good agreement with the ‘universal’ initial mass function slope of (Kroupa et al., 2001). Comparing the distribution of stellar masses with a Kroupa et al. (2001) initial mass function we identify the range of masses where the observed mass function deviates from this and which may therefore suffer from spatially varying incompletenesses. We find that the sample is complete in the mass ranges and , which we here adopt as our spatially-complete sample for studying mass segregation (hereafter dubbed the ‘mass function complete’ sample). This consists of 587 stars, reduced from the 1032 members of Cyg OB2 in the full catalog. These stars are distributed over an area of 0.08 deg2, or 50 pc2 at the distance of Cyg OB2. This is equivalent to a surface density of 2–4 stars arcmin-2, significantly below the level at which sample incompleteness effects can bias measures of mass segregation (e.g., Ascenso et al., 2009). Figure 1 shows the spatial distribution of these sources. Note that the 50 pc2 surface area shown in Fig 1 represents around one-third to one-half of the total population of Cyg OB2.
3 Methodology
In this section we outline the substructure and mass segregation diagnostics used in this work, the results of which are presented in Section 4.
3.1 The parameter measure of cluster structure
Cartwright & Whitworth (2004) pioneered the use of the -parameter in diagnosing the amount of substructure in star clusters. The parameter is defined as , the ratio of the mean edge length of the minimum spanning tree (MST) of all the stars in the cluster, , and the mean separation between stars, , both normalised as described in Cartwright & Whitworth (2004). Clusters with smooth spatial distribution and central condensation have large values, whilst clumpy clusters with significant substructure have small values. The advantage of using the parameter is that it provides an impartial indication of cluster structure without the need for any arbitrary decisions such as choosing a cluster centre. The normalisation factors also make the parameter independent of the size or density of the star cluster, allowing comparisons between different clusters. While the parameter was originally formulated for broadly spherical clusters it can also be adapted to take into account the effects of elongation (Bastian et al., 2009).
3.2 The minimum spanning tree method
The ratio was introduced by Allison et al. (2009) to provide a quantitative measure of the level of mass segregation with an associated significance (see also Olczak et al., 2011; Maschberger & Clarke, 2011). This method uses the length of the MST of a subset of massive stars compared to the mean MST length of many random subsets of low-mass stars. If mass segregation exists in a group of stars then the MST length of the most massive stars will be shorter than the typical MST length of an equal size sample of low-mass stars. Allison et al. (2009) quantified the mass segregation ratio, , as
| (1) |
where is the mean MST edge length of massive stars and is the sample average of the mean MST edge length of stars. The uncertainty on this measure, , can be calculated from Monte Carlo simulations to derive an associated significance. A measurement of indicates no mass segregation (i.e. the massive stars are distributed in the same way as all other stars), whereas indicates mass segregation, with the significance of such a measurement dependent on the uncertainty calculated. This method has particular advantages over other measures of mass segregation based on the radial distributions of the stars in a cluster as it does not rely on defining a cluster centre or any preferred location, a useful feature when studying the spatial distribution of stars in an association that may not have a clear centre.
This method has been well tested on a number of clusters and associations and been shown to produce significant detections of mass segregation in both dynamically evolved clusters and in clusters with known mass segregation (e.g., Allison et al., 2009; Sana et al., 2010) and also to show a lack of mass segregation in less dynamically evolved groups of stars (e.g., Parker et al., 2011, 2012).
3.3 The local stellar surface density method
An alternative measure of mass segregation based on the local stellar surface density was proposed by Maschberger & Clarke (2011). If mass segregation exists then the massive stars will be concentrated in denser areas of the cluster and will have higher local surface densities than the general population. This can be seen in a plot of the local surface density, , versus mass, where , is the number of stars used to measure the local surface density, and is the distance to the nearest neighbour of the star (Casertano & Hut, 1985). We adopt in this work following Maschberger & Clarke (2011) and Casertano & Hut (1985) who found it to be a good compromise between accurately representing the local density and minimising low-level fluctuations. Maschberger & Clarke (2011) tested this method on the hydrodynamical simulation of star formation by Bonnell et al. (2008), quantifying the significance of mass segregation using a two-sample Kolmogorov-Smirnov (KS) test of the values of the subset compared to the values of the entire sample, and found that it provided significant measurements of mass segregation in young clusters. To compare this measurement with that from other clusters we follow Parker et al. (2013) by using the ratio of local surface densities of the 10 most massive stars in the association, , to that of all the stars in the association, , the local surface density ratio .
4 Results
Here we present the results of applying the structural diagnostic and both mass segregation diagnostics to our ‘mass function complete’ sample, the implications of which are discussed in Section 5.
4.1 The Substructure Diagnostic
We calculate a substructure measure of for the centre of Cyg OB2. This is possibly a lower limit due to certain observational effects and the true value is probably 0.4 – 0.5 (see discussion in Section 4.4). Despite this the true value for Cyg OB2 is still very low. Of the regions examined by Cartwright & Whitworth (2004), only Taurus has such a low of 0.47 (although further comparisons between Taurus and Cyg OB2 should be made cautiously as the two regions are very different and are observed at hugely different distances). Such a low value of is almost certainly a signature of a region that is dynamically unevolved as dynamical evolution acts to erase substructure (Scally & Clarke, 2002; Goodwin & Whitworth, 2004; Parker et al., 2013).
4.2 The Mass Segregation Ratio,
The mass segregation ratio was calculated for a subset of massive stars of varying size with calculated from 10,000 random realisations of a random subset of stars drawn from the sample. The distribution of values was then used to calculate . This experiment was repeated for multiple values of to identify any possible subset of the massive star population in Cyg OB2 that might be mass segregated and with different step sizes so that the largest and most significant measurement of mass segregation could be identified.
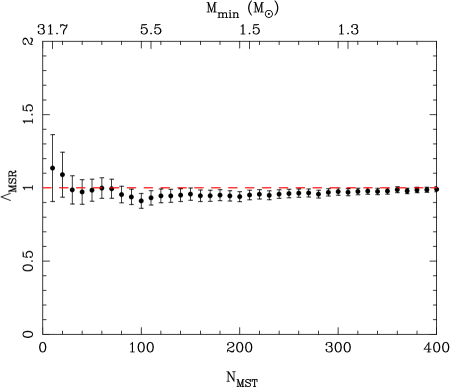
Figure 2 shows the mass segregation ratio for the most massive stars in the centre of Cyg OB2 in steps of 10 stars. The highest mass bin has , indicating that the 10 most massive stars (M = 32–80 M⊙) might be slightly more clustered than the average stars in Cyg OB2, but this result is not significant, deviating from (no mass segregation) by only 0.6. Increasing produces less significant results and for we find . Adjusting the step value of produces minor changes to the largest value of , varying from 1.13 to 1.16 as the step size varies from 5-15. However this does not produce more significant results because as increases we lose the ability to pick out structural differences between mass regimes, while if decreases we raise the uncertainty and lower the resulting significance.
This value of is significantly lower than that found in other regions (e.g., Allison et al., 2009; Sana et al., 2010), both in terms of the absolute measurement and the significance of the measurement. It is also lower than the levels of mass segregation found by Parker et al. (2013) in -body simulations of highly dynamic subvirial clusters (see discussion in Section 5). We therefore conclude that by the mass segregation ratio there is no evidence for mass segregation in the centre of Cyg OB2.
4.3 The local surface density ratio ,
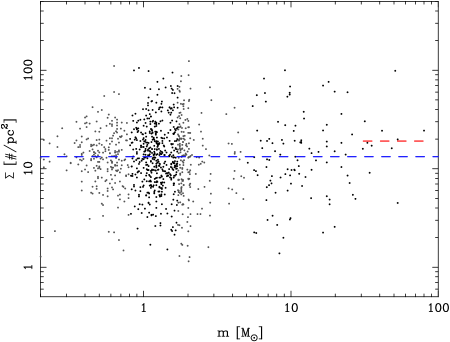
The local surface density, , for all the stars in our sample is shown in Figure 3, showing both the full sample and the ‘mass function complete’ subset of the sample. The spread in is approximately two orders of magnitude, lower than the 3 dex spread measured by Maschberger & Clarke (2011) from their hydrodynamical simulations, but similar to the 2 dex spread observed by Parker et al. (2012) in Ophiuchi.
The median surface density of the ‘mass function complete’ subset of the sample, stars pc-2 is shown, as is the median surface density of the 10 most massive stars in the sample stars pc-2. This difference is not significant however, with a two dimensional KS test returning a p-value of 0.24 that the two subsets share the same parent distribution. The local surface density ratio for Cyg OB2 is then , much lower than the values of found by Parker et al. (2013) in their -body simulations of both subvirial (bound) and supervirial (unbound) dense clusters. Given the large number of massive stars in Cyg OB2 it might be considered restrictive to only use the 10 most massive stars for this diagnostic, though there is a fine balance between sensitivity to the most massive stars and the statistical significance of the result afforded by the sample size. Recalculating the local surface density ratio using the 20 (30) most massive stars changes the ratio to (1.28), a very small change which does not alter the overall result. We conclude that the massive stars in the centre of Cyg OB2 are not in regions of significantly higher local density than the low-mass stars, and are therefore not mass segregated according to this ratio.
4.4 Possible biases
Our observations suggest that there is no significant evidence for mass segregation in Cyg OB2 and that the association exhibits considerable substructure. These results are based on the spatial distribution of stars, both that of the entire sample and that of the IMF complete sample. Anything that could affect our ability to detect and characterise stars at different spatial densities or stars of different masses could therefore bias these results. We consider such possible biases here and attempt to assess their impact on our results.
One possible bias is evident from the positions of stars in Figure 1, which reveals a cross-shape of low stellar density due to the gap between Chandra’s CCDs. This chip gap of 11′′ is partly smoothed out by the Lissajous dither pattern used by the observatory, but will leave an area of low sensitivity between CCDs. While this will not affect the positions of the OB stars (which are known from other observations) and therefore the level of mass segregation, it may induce structural features that will artificially decrease . To test the importance of this effect we simulated fractal datasets with and without a cross in the centre of the image. For ten different realisations of a region with 1000 stars in a 3D fractal with a fractal dimension of 2.0 we find that the ‘true’ 2D value of varies between 0.42 and 0.63 (typically 0.5). Placing a ‘cross’ with a size of 10 per cent of the total size of the region (a conservative over-estimation) typically lowers the measured 2D value by around 0.1 – giving a range of between 0.27 and 0.60 (note that in one case the -value increases by only 0.06). Therefore the measured for Cyg OB2 is likely underestimated slightly and the true -value is probably 0.4 – 0.5, still very low.
Another bias that could affect our sample is contamination of the sample by non-members of Cyg OB2. These objects would be randomly distributed across the field and would appear as low-mass stars (since all the high-mass stars in Cyg OB2 have been spectroscopically identified). Significant contamination would effect the values of all of our quantitative measures. The effect of adding randomly positioned contaminants is to smooth out density differences, effectively pushing towards 0.8 (i.e. smoothly distributed) and pushing towards unity (i.e. to preferentially increase the densities of low-surface density regions). The potential effects of contamination on are subtle, and it could artificially increase or decrease depending on what the true underlying distribution is. However, the very low measured value of shows that no significant randomly distributed component is present (otherwise would not be so low). Therefore we conclude that contamination is not significant in this sample.
Finally we note that the effects of variable extinction are unlikely to have a significant effect on our results. Bastian et al. (2009) studied how incompletenesses due to extinction can affect the resulting parameter, causing the measured value to be lower by 0.04–0.08 if 20–50% of the sources are undetected due to variable extinction. This result was supported by a similar study by Parker & Meyer (2012) who also found the same was true when calculating , i.e., only when an unphysically larger number of stars are undetected due to extinction do such structural diagnostics become unreliable. It is worth reiterating that we do not expect a significant loss of sources due to variable extinction since Guarcello et al. (2013) did not detect many embedded sources in Cyg OB2 from their deep infrared study.
5 Discussion
Cyg OB2 is an association with a total mass estimated to be M⊙ (Drew
et al., 2008; Wright
et al., 2010) spread over an area of at least 50 pc2 and surrounded by (but not embedded within) the molecular cloud complex Cygnus X with a gas mass of M⊙ (adjusted for a distance of 1.4 kpc, Schneider et al., 2006). Based on the results from this paper we can make several statements:
1. The centre of Cyg OB2 shows a significant degree of substructure with a true 2D -value of 0.4–0.5 (see Section 4.1).
2. Cyg OB2 shows no evidence that the massive stars are distributed any differently to the low-mass stars (as measured by , see Section 4.2).
3. Cyg OB2 shows no evidence that the massive stars are in regions of higher local density than the low-mass stars (as measured by , see Section 4.3).
Putting together all of this evidence we argue that Cyg OB2 has always been a substructured, unbound association.
The significant degree of spatial substructure as measured by strongly suggests that Cyg OB2 is dynamically young. That is, it has not been able to mix in phase space and retains the imprint of its initial conditions (a picture supported by evidence of physical and dynamical substructure in Cyg OB2, e.g., Wright et al., 2012; Guarcello et al., 2013). Previous studies have found that substructure is only ever erased (Scally & Clarke, 2002; Goodwin & Whitworth, 2004). In particular, Parker et al. (2013) find that tends to stay the same or increase in the vast majority of simulations, although in some initially smooth and unbound regions substructure can increase very slightly to 0.8 and then quickly falls to 0.6 before remaining roughly constant. This is due to sub-regions with locally similar velocities being able to ‘condense’ from an initially smooth distribution. The decrease in is however small and we also believe such smooth initial conditions to be highly unphysical. Therefore, the current value of is an upper limit on the initial value of . The fact that we see a low current value of means that Cyg OB2 has always contained significant substructure.
The lack of any evidence for mass segregation is extremely interesting. That shows that the massive stars are not closer together than would be expected from a random selection of low-mass stars. Parker et al. (2013) find that in bound ‘clusters’ tends to increase (though it can go down due to the dynamical decay of higher-order Trapezium-like systems), but in unbound regions retains its initial value (as the massive stars have no chance to group together). The velocity dispersion of Cyg OB2 suggests the region is gravitationally unbound (see Kiminki et al., 2007, and erratum) and therefore that was always unity – i.e. the massive stars in Cyg OB2 were never grouped together more closely.
The local surface density around the massive stars as measured by is also statistically the same as that around low-mass stars. Parker et al. (2013) show that in bound and unbound regions always tends to increase. This is because the massive stars act as a local potential well into which they can attract a retinue of low-mass stars increasing their local surface density. Therefore is a lower limit on the initial which increases with dynamical age. This again suggests that Cyg OB2 is dynamically young as the massive stars have had no (dynamical) time to attract a local retinue (alternatively they have had time, but Cyg OB2 started with the massive stars in significantly less locally dense regions), i.e. the massive stars in Cyg OB2 did not form in locally overdense regions.
In particular, given the age of around 3–5 Myr of Cyg OB2 (Wright et al., 2010), and comparing with the simulations of Parker et al. (2013) we find that only unbound (supervirial) regions with initial volume densities of stars pc-3 are of low enough density for the massive stars to fail to gather a retinue in a few Myr. In collapsing, or in higher surface density regions (assuming the third dimension is roughly the same as the observed two dimensions) is always found to increase significantly in a few Myr. The surface density of the observed region is several hundred stars pc-2 (extrapolating to a full IMF), and if the third dimension is roughly the same as the two observed dimensions this suggests an average volume density in this region of around 100 stars pc-3 – in good agreement with the theoretical argument. All the evidence above suggests that Cyg OB2 is dynamically young which would be expected if it was born unbound.
5.1 Implications for theories of massive star formation
Cyg OB2 contains a number of very massive stars with masses of 100 M⊙ (e.g., Massey & Thompson, 1991; Kiminki et al., 2007), particularly the blue hypergiant Cyg OB2 #12, which is reported to have a mass of 110 M⊙ (Clark et al., 2012). The presence of such massive stars is consistent with estimates of the total stellar mass of Cyg OB2 of M⊙ and make it comparable with some of the most massive star clusters in our Galaxy such as NGC 3603 or Westerlund 1. Therefore the conditions under which Cyg OB2 and its massive stars formed is particularly important for our understanding of how such stars form and acts as a constraint for theories of massive star formation.
There are a number of theories for how massive stars form and build up their considerable masses, ranging from scaled up versions of low-mass star formation (e.g., Shu et al., 1987; McKee & Tan, 2003), collisions or mergers in the cores of dense clusters (Zinnecker & Yorke, 2007) and relatively dynamic theories where environment plays a significant role (e.g., Bonnell et al., 2004). The concept of competitive accretion is a particular example of the latter theory and suggests that high-mass stars begin their lives as relatively low-mass molecular cores but are able to accrete considerably more matter than other stars due to their preferential positions in the centres of dense clusters where the gravitational potentials are highest (e.g., Zinnecker, 1982; Larson, 1992; Bonnell et al., 2004). This requires that massive stars are only born in dense massive clusters, and should also be preferentially found in the centres of these clusters, i.e. clusters should exhibit a level of primordial mass segregation that cannot be explained by dynamical means (Bonnell & Davies, 1998).
Our results suggest that the massive stars in Cyg OB2 did not form close together (either in a single cluster, or in a few clusters as this would be retained in ), nor did they form in locally overdense regions (which would be indicated by a high ). The presence of stars as massive as 100 M⊙ in Cyg OB2 is inconsistent with the idea that massive stars can only form in dense clusters. This argues against theories that require massive stars to only form in dense massive clusters, such as the theory of competitive accretion (e.g., Bonnell et al., 2004) or the formation of massive stars by mergers (Zinnecker & Yorke, 2007), as the only mechanisms by which massive stars form.
5.2 Implications for our understanding of Cyg OB2
We suggest it is highly unlikely that Cyg OB2 was ever a single compact cluster which is in the process of destroying itself post gas-expulsion. In such a case we would not expect to see spatial substructure, and we might expect to see some evidence of the (primordial or dynamical) mass segregation of the initial cluster retained. By far the best explanation for the observed properties of Cyg OB2 is that we are seeing the region now very much as it formed, as an unbound association with a relatively low surface density.
Such an interpretation of the initial conditions provides a natural explanation for the large range of stellar ages measured in Cyg OB2. This was first hinted at by Massey & Thompson (1991) who noted the presence of evolved supergiants alongside the high-mass main sequence population in Cyg OB2, and this has since been confirmed by other authors (e.g., Hanson, 2003; Comerón & Pasquali, 2012). Furthermore amongst the lower-mass population Drew et al. (2008) uncovered a 5–7 Myr old population of A-type stars and Wright et al. (2010) found a spread of ages of 3–5 Myr. Whilst there is considerable debate about the reality of age spreads amongst low-mass stars (e.g. Palla & Stahler, 1999; Jeffries et al., 2011), the existence of multiple age populations inferred from OB stars are less prone to such uncertainties, and the evidence from different mass ranges supports the view that Cyg OB2 is not a simple coeval population.
Our finding that Cyg OB2 was born in a highly substructured and low density arrangement suggests that the stars were most likely born over a much larger area, 10 pc, than the typical compact size of young star clusters, 1–2 pc. The observed range of stellar ages could therefore be considered as due to a series of discrete and hierarchical star formation events that have since expanded and overlapped. Indeed, it would seem unlikely to not have age spreads of a few Myr over a region around 10 pc across.
5.3 What is the true 3D structure of Cyg OB2?
As is almost always true in astronomy, our observations of Cyg OB2 are a 2D projection of a 3D region. When dealing with spherical and gravitationally bound ‘clusters’, the assumption that the third dimension is very similar to the two observed dimensions is probably very reasonable. However, the observations of Cyg OB2 show significant substructure (a very low-), and combined with the high (unbound) velocity dispersion and significant age spreads suggest a poorly-mixed, dynamically young region. This raises the question of the possible importance of the true 3D shape of Cyg OB2 and projection effects. It is extremely difficult to imagine how projection effects could give either a low value or a low value if they were not the true values (its effects on are not obvious), but the degree to which it could alter various structure parameters is unclear. We will examine this in more detail in a future paper.
6 Conclusions
The question of whether all stars form in dense clusters has fundamental ramifications for theories of star formation, the formation mechanisms of high-mass stars and whether clusters represent a fundamental unit of star formation. In this paper we have studied the structure of the massive Cyg OB2 association in an attempt to constrain its initial conditions.
To determine the amount of dynamical evolution we have studied the level of physical substructure and searched for evidence of mass segregation in Cyg OB2 using a well-characterised X-ray selected sample of young stars down to 1 M⊙. We used the parameter to diagnose substructure (Cartwright &
Whitworth, 2004) and two independent measures of mass segregation, (Allison et al., 2009) and (Maschberger &
Clarke, 2011; Parker
et al., 2013). Our results show that Cyg OB2 has considerable substructure and is not mass segregated, both indications that the association is dynamically young (see Parker
et al., 2013). We therefore infer that the initial conditions of Cyg OB2 were:
1) Cyg OB2 formed as a relatively low-density, highly substructured, globally unbound association and has changed little in its bulk properties since its formation.
2) The massive stars in Cyg OB2 did not form close together, nor did they form in regions of higher than average local surface / volume density.
The overall conclusion is that Cyg OB2 formed very much as we see it today and was not born as a dense cluster. Since Cyg OB2 contains many very massive stars, including at least two stars as massive as 100 M⊙, this allows us to constrain the sites and conditions under which massive stars form. The formation of these massive stars in a low density environment is inconsistent with the idea that massive stars are only born in dense clusters where the deep potential well caused by a massive and dense star cluster allows the massive stars to attract and accrete sufficient mass to reach such high stellar masses. It is also extremely difficult to imagine any environment in the young Cyg OB2 that would allow mergers to occur. Any theory of massive star formation must therefore be able to explain how stars as massive as 100 M⊙ can form in a low density association such as Cyg OB2.
The total mass and content of massive stars make Cyg OB2 comparable to some of the most massive star clusters in our Galaxy, such as NGC 3603 or Westerlund 1, yet as an association its members are now, and we argue always have been, spread over a much larger area. The question of whether two such similar populations of stars as Cyg OB2 and Westerlund 1 (both with similar total masses and initial mass functions) formed in such different spatial configurations as they appear now, or whether they formed in the same manner and have since evolved in different directions, is an important issue for theories of star formation.
This study was enabled by the high spatial resolution of Chandra X-ray observations, which provide an unbiased and quasi-complete sample of low mass stars in Cyg OB2. The larger Chandra Legacy Survey of Cyg OB2 will allow this study to be extended over a much larger area in the future and with a larger number of stars. Kinematical observations such as radial velocities and proper motions from upcoming facilities such as Gaia and associated ground-based spectroscopic surveys can be used to test our results by searching for and quantifying the level of energy equipartition and dynamical substructure. There is also considerable potential for combining kinematical observations with spatial diagnostics such as those explored in this paper, which we plan to address in a future paper.
7 Acknowledgments
The authors would like to thank Janet Drew, Geert Barentsen, and Mario Guarcello for stimulating discussions and helpful comments on this paper. We also thank the anonymous referee for constructive comments that helped improve the paper. NJW acknowledges a Royal Astronomical Society Research Fellowship. This work is based on ideas and discussions as part of an International Team at the International Space Science Institute in Bern, Switzerland.
References
- Adams et al. (2006) Adams F. C., Proszkow E. M., Fatuzzo M., Myers P. C., 2006, ApJ, 641, 504
- Albacete Colombo et al. (2007) Albacete Colombo J. F., Flaccomio E., Micela G., Sciortino S., Damiani F., 2007, A&A, 464, 211
- Allison et al. (2009) Allison R. J., Goodwin S. P., Parker R. J., Portegies Zwart S. F., de Grijs R., Kouwenhoven M. B. N., 2009, MNRAS, 395, 1449
- Armitage (2000) Armitage P. J., 2000, A&A, 362, 968
- Ascenso et al. (2009) Ascenso J., Alves J., Lago M. T. V. T., 2009, A&A, 495, 147
- Bastian et al. (2010) Bastian N., Covey K. R., Meyer M. R., 2010, ArA&A, 48, 339
- Bastian et al. (2007) Bastian N., Ercolano B., Gieles M., Rosolowsky E., Scheepmaker R. A., Gutermuth R., Efremov Y., 2007, MNRAS, 379, 1302
- Bastian et al. (2009) Bastian N., Gieles M., Ercolano B., Gutermuth R., 2009, MNRAS, 392, 868
- Blaauw (1964) Blaauw A., 1964, ArA&A, 2, 213
- Bonnell et al. (2001) Bonnell I. A., Bate M. R., Clarke C. J., Pringle J. E., 2001, MNRAS, 323, 785
- Bonnell et al. (2008) Bonnell I. A., Clark P., Bate M. R., 2008, MNRAS, 389, 1556
- Bonnell & Davies (1998) Bonnell I. A., Davies M. B., 1998, MNRAS, 295, 691
- Bonnell et al. (2004) Bonnell I. A., Vine S. G., Bate M. R., 2004, MNRAS, 349, 735
- Bressert et al. (2010) Bressert E., Bastian N., Gutermuth R., Megeath S. T., Allen L., Evans II N. J., Rebull L. M., Hatchell J., Johnstone D., Bourke T. L., Cieza L. A., Harvey P. M., Merin B., Ray T. P., Tothill N. F. H., 2010, MNRAS, 409, L54
- Brown et al. (1997) Brown A. G. A., Dekker G., de Zeeuw P. T., 1997, MNRAS, 285, 479
- Carpenter (2000) Carpenter J. M., 2000, AJ, 120, 3139
- Carpenter et al. (1997) Carpenter J. M., Meyer M. R., Dougados C., Strom S. E., Hillenbrand L. A., 1997, AJ, 114, 198
- Cartwright & Whitworth (2004) Cartwright A., Whitworth A. P., 2004, MNRAS, 348, 589
- Casertano & Hut (1985) Casertano S., Hut P., 1985, ApJ, 298, 80
- Clark et al. (2012) Clark J. S., Najarro F., Negueruela I., Ritchie B. W., Urbaneja M. A., Howarth I. D., 2012, A&A, 541, A145
- Comerón & Pasquali (2012) Comerón F., Pasquali A., 2012, A&A, 543, A101
- Comerón et al. (2002) Comerón F., Pasquali A., Rodighiero G., Stanishev V., De Filippis E., López Martí B., Gálvez Ortiz M. C., Stankov A., Gredel R., 2002, A&A, 389, 874
- Drew et al. (2005) Drew J. E., Greimel R., Irwin M. J., Aungwerojwit A., Barlow M. J., Corradi R. L. M., Drake J. J., Gänsicke B. T., Groot P., Hales A., Hopewell E. C., Irwin J., Knigge C., 2005, MNRAS, 362, 753
- Drew et al. (2008) Drew J. E., Greimel R., Irwin M. J., Sale S. E., 2008, MNRAS, 386, 1761
- Elmegreen et al. (2006) Elmegreen B. G., Elmegreen D. M., Chandar R., Whitmore B., Regan M., 2006, ApJ, 644, 879
- Goodwin & Bastian (2006) Goodwin S. P., Bastian N., 2006, MNRAS, 373, 752
- Goodwin & Whitworth (2004) Goodwin S. P., Whitworth A. P., 2004, A&A, 413, 929
- Guarcello et al. (2013) Guarcello M. G., Drake J. J., Wright N. J., Drew J. E., Gutermuth R. A., Hora J. L., Naylor T., Aldcroft T., Fruscione A., García-Alvarez D., Kashyap V. L., King R., 2013, ApJ, 773, 135
- Gutermuth et al. (2011) Gutermuth R. A., Pipher J. L., Megeath S. T., Myers P. C., Allen L. E., Allen T. S., 2011, ApJ, 739, 84
- Hanson (2003) Hanson M. M., 2003, ApJ, 597, 957
- Hillenbrand et al. (1998) Hillenbrand L. A., Strom S. E., Calvet N., Merrill K. M., Gatley I., Makidon R. B., Meyer M. R., Skrutskie M. F., 1998, AJ, 116, 1816
- Hills (1980) Hills J. G., 1980, ApJ, 235, 986
- Jeffries et al. (2011) Jeffries R. D., Jackson R. J., Briggs K. R., Evans P. A., Pye J. P., 2011, MNRAS, 411, 2099
- Jesús Delgado et al. (2013) Jesús Delgado A., Djupvik A. A., Costado M. T., Alfaro E. J., 2013, ArXiv e-prints
- Kiminki et al. (2007) Kiminki D. C., Kobulnicky H. A., Kinemuchi K., Irwin J. S., Fryer C. L., Berrington R. C., Uzpen B., Monson A. J., Pierce M. J., Woosley S. E., 2007, ApJ, 664, 1102
- Kroupa (2011) Kroupa P., 2011, in Stellar Clusters and Associations: A RIA Workshop on Gaia Star Cluster Formation and Some Implications for Gaia. pp 17–27
- Kroupa et al. (2001) Kroupa P., Aarseth S., Hurley J., 2001, MNRAS, 321, 699
- Lada & Lada (1991) Lada C. J., Lada E. A., 1991, in Janes K., ed., The Formation and Evolution of Star Clusters Vol. 13 of Astronomical Society of the Pacific Conference Series, The nature, origin and evolution of embedded star clusters. pp 3–22
- Lada & Lada (2003) Lada C. J., Lada E. A., 2003, ArA&A, 41, 57
- Lada et al. (1984) Lada C. J., Margulis M., Dearborn D., 1984, ApJ, 285, 141
- Lada et al. (1991) Lada E. A., Depoy D. L., Evans II N. J., Gatley I., 1991, ApJ, 371, 171
- Larson (1992) Larson R. B., 1992, MNRAS, 256, 641
- Maschberger & Clarke (2011) Maschberger T., Clarke C. J., 2011, MNRAS, 416, 541
- Massey & Thompson (1991) Massey P., Thompson A. B., 1991, AJ, 101, 1408
- McKee & Tan (2003) McKee C. F., Tan J. C., 2003, ApJ, 585, 850
- Nazé et al. (2011) Nazé Y., Broos P. S., Oskinova L., Townsley L. K., Cohen D., Corcoran M. F., Evans N. R., Gagné M., Moffat A. F. J., Pittard J. M., Rauw G., ud-Doula A., Walborn N. R., 2011, ApJS, 194, 7
- Olczak et al. (2011) Olczak C., Spurzem R., Henning T., 2011, A&A, 532, A119
- Palla & Stahler (1999) Palla F., Stahler S. W., 1999, ApJ, 525, 772
- Parker et al. (2011) Parker R. J., Bouvier J., Goodwin S. P., Moraux E., Allison R. J., Guieu S., Güdel M., 2011, MNRAS, 412, 2489
- Parker et al. (2011) Parker R. J., Goodwin S. P., Allison R. J., 2011, MNRAS, 418, 2565
- Parker et al. (2012) Parker R. J., Maschberger T., Alves de Oliveira C., 2012, MNRAS, 426, 3079
- Parker & Meyer (2012) Parker R. J., Meyer M. R., 2012, MNRAS, 427, 637
- Parker & Quanz (2012) Parker R. J., Quanz S. P., 2012, MNRAS, 419, 2448
- Parker et al. (2013) Parker R. J., Wright N. J., Goodwin S. P., 2013, MNRAS
- Preibisch & Feigelson (2005) Preibisch T., Feigelson E. D., 2005, ApJS, 160, 390
- Preibisch & Zinnecker (1999) Preibisch T., Zinnecker H., 1999, AJ, 117, 2381
- Rygl et al. (2012) Rygl K. L. J., Brunthaler A., Sanna A., Menten K. M., Reid M. J., van Langevelde H. J., Honma M., Torstensson K. J. E., Fujisawa K., 2012, ArXiv e-prints
- Sana et al. (2010) Sana H., Momany Y., Gieles M., Carraro G., Beletsky Y., Ivanov V. D., de Silva G., James G., 2010, A&A, 515, A26
- Scally & Clarke (2002) Scally A., Clarke C., 2002, MNRAS, 334, 156
- Scalo (1985) Scalo J. M., 1985, in Black D. C., Matthews M. S., eds, Protostars and Planets II Fragmentation and hierarchical structure in the interstellar medium. pp 201–296
- Schmitt (1997) Schmitt J. H. M. M., 1997, A&A, 318, 215
- Schneider et al. (2006) Schneider N., Bontemps S., Simon R., Jakob H., Motte F., Miller M., Kramer C., Stutzki J., 2006, A&A, 458, 855
- Shu et al. (1987) Shu F. H., Adams F. C., Lizano S., 1987, ArA&A, 25, 23
- Stolte et al. (2002) Stolte A., Grebel E. K., Brandner W., Figer D. F., 2002, A&A, 394, 459
- Vink et al. (2008) Vink J. S., Drew J. E., Steeghs D., Wright N. J., Martin E. L., Gänsicke B. T., Greimel R., Drake J., 2008, MNRAS, 387, 308
- Wright et al. (2012) Wright N. J., Bouy H., Drake J. J., Drew J. E., Guarcello M., Navacues D. B. y., 2012, ArXiv e-prints
- Wright & Drake (2009) Wright N. J., Drake J. J., 2009, ApJS, 184, 84
- Wright et al. (2012) Wright N. J., Drake J. J., Drew J. E., Guarcello M. G., Gutermuth R. A., Hora J. L., Kraemer K. E., 2012, ApJL, 746, L21
- Wright et al. (2010) Wright N. J., Drake J. J., Drew J. E., Vink J. S., 2010, ApJ, 713, 871
- Wright et al. (2011) Wright N. J., Drake J. J., Mamajek E. E., Henry G. W., 2011, ApJ, 743, 48
- Yorke & Sonnhalter (2002) Yorke H. W., Sonnhalter C., 2002, ApJ, 569, 846
- Zinnecker (1982) Zinnecker H., 1982, Annals of the New York Academy of Sciences, 395, 226
- Zinnecker & Yorke (2007) Zinnecker H., Yorke H. W., 2007, ArA&A, 45, 481