Escaping the poverty trap: modeling the interplay between economic growth and the ecology of infectious disease
Abstract
The dynamics of economies and infectious disease are inexorably linked: economic well-being influences health (sanitation, nutrition, treatment capacity, etc.) and health influences economic well-being (labor productivity lost to sickness and disease). Often societies are locked into “poverty traps” of poor health and poor economy. Here, using a simplified coupled disease-economic model with endogenous capital growth we demonstrate the formation of poverty traps, as well as ways to escape them. We suggest two possible mechanisms of escape both motivated by empirical data: one, through an influx of capital (development aid), and another through changing the percentage of GDP spent on healthcare. We find that a large influx of capital is successful in escaping the poverty trap, but increasing health spending alone is not. Our results demonstrate that escape from a poverty trap may be possible, and carry important policy implications in the world-wide distribution of aid and within-country healthcare spending.
poverty trap; economics; infectious disease dynamics; SIRS model; economic growth model; development aid strategies
1 Introduction
As economics and health are inexorably linked, implementation of appropriate health-centered public policy decisions is a non-trivial undertaking and carry important consequences for long-term economic growth and the health of societies. On the one hand economic health has a large influence on the physical health of a society (through hospitals, improved infrastructure and sanitation, the ability to grow or import healthier food, etc.), while on the other, economic productivity is dependent upon the overall well-being of workers; e.g. sick people cannot (fully) participate in the labor market (1, 2, 3). Despite this strong interdependence, few studies have examined directly the interplay between economic growth and the ecology of infectious disease (4, 5, 6, 7, 8, 9). Many studies have focused on the cost-effectiveness of treatments (10, 11), but only a handful of studies have focused on other economic aspects such as game-theoretic models of vaccination uptake by individuals (12, 13, 14, 15, 16, 17, 18), and positive and negative externalities imposed by the treatment and evolution of infectious diseases (19, 20, 21, 22, 23, 24).
In the present study we present a simple model of economic growth and disease transmission extended from a model developed by Bonds et al. (2010) (4) where they demonstrate how poverty traps can be formed through the interplay of infectious disease and economics. We extend their model to include endogenous economic growth and examine under which scenarios a country could foreseeably escape a poverty trap. Our approach is based on a deterministic Susceptible, Infectious, Recovered, Susceptible (SIRS) model (25) coupled with a Solow economic growth model (26), allowing economic growth to be endogenous. We parameterize our model with empirical socio-economic data and test two hypotheses for escaping a poverty trap formed by infectious diseases: one, that a large influx of development aid (capital) will increase the absolute amount of money available for healthcare spending allowing disease to be reduced to a level which will allow a economic growth; and two, that increasing the percentage of GDP spent on healthcare (without the addition of development aid) will reduce disease to levels which allow economic growth.
2 How Can We Improve the Health and Wealth of a Society?
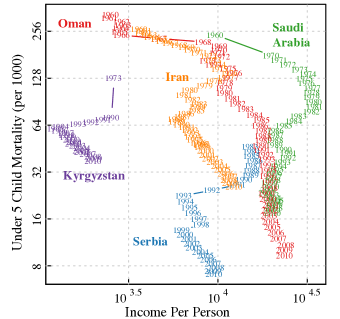
Figure 1 illustrates two possible routes out of an unhealthy and poor status and are chosen specifically to motivate our two hypotheses. Child mortality was high in the Middle Eastern countries Oman, Iran and Saudi Arabia in the early nineteen sixties. After the cost of oil rose, their GDP per capita greatly increased, and child mortality continually decreased. Thus, it is possible that a large influx of capital caused an absolute increase in healthcare spending which thereby improved infrastructure and sanitation (note that Qatar established specialized hospitals in with pregnancy care and vaccination programs. Source: www.sch.gov.qa/sch/En/scontent.jsp?smenuId=40), moving these countries from a rich and unhealthy to a rich and healthier society today.
Another route from poor and unhealthy to wealthy and well is through increasing relative healthcare spending (as a fraction of GDP). This is motivated by Serbia and the former Soviet republic of Kyrgyzstan. After the Soviet Union collapsed, per capita GDP shrank, but child mortality decreased. This may be due to increasing percentage of GDP spent on health. In Kyrgyzstan adopted the Manas program, a national primary-care health system and in 1997 implemented a mandatory insurance program (27). Both examples of national and individual increases in healthcare spending without increases in capital. Similarly for Serbia, after the breakup of Yugoslavia, a shift towards private insurance and increases in healthcare costs (paid both by government and individual) increased healthcare spending, albeit at the cost of efficiency (28). The outcome of this being an increase in the proportion of GDP spent on healthcare and a decline in child mortality.
3 The Model
3.1 Solow’s Model of Economic Growth
A classical model of economic growth was proposed by Solow (26). Capital, , accumulates by saving a portion, of the production, , where is the production function for capital and labor force , and capital decreases due to inflation at rate . Thus, capital changes according to
| (1) |
To utilize (1) we have to specify a functional form for the production function. Here we use the Cobb-Douglas production function (29, 30):
| (2) |
where and parametrize capital and labor returns on production, and is the multifactor productivity representing technology and innovation. An important case of the Cobb-Douglas production function is when , corresponding to constant returns to scale, i.e. doubling and also doubles .
Since our timescale of analysis is relatively short ( years) we set for simplicity. Furthermore, we restrict our analysis to the basic model (1) and set , assuming no improvements in innovation and technology.
3.2 SIRS Model of Disease Transmission
We use a standard SIRS model to describe the dynamics of a generic disease in a population of size (25). The population is divided into three non-overlapping compartments: susceptible (), infected (), and recovered (). By definition, . The dynamics of the system are represented by the following ordinary differential equations (ODEs):
| (3) | |||||
| (4) | |||||
| (5) |
where is the birth rate, is the death rate, is the fraction of newborns that receive prophylaxis, is the fraction of infected people that get treated, is the number of contacts per person per unit time, is the probability of infection given the contact is infected, is the recovery rate, is the “recovery benefit” (percentage) conferred by being treated, and is the relapse rate at which recovered people lose immunity and thus become again susceptible to the disease.
3.3 Solow - SIRS Model of Wealth and Health
The impact of health in the Solow model is two-fold: first, infected people cannot participate at their fullest in the labor force (i.e. they only have a fraction of productivity; if infected people cannot work, ), and second, prophylaxis and treatment incurs costs. Thus,
| (6) | |||||
where is the prophylaxis cost per newborn individual (/person) and is the treatment cost per infected individual per unit time (/person/time). While birth and death rate depend on wealth, for simplicity we assume constant and over the time-scale of infection.
Let be the proportion of the budget that is available to spend on health per unit time. For public policy strategies we make two important assumptions: first, money will only be spent on treatment if all newborns are prophylaxed; and second, if a country has a large enough health budget to cover the cost of prophylaxis for everyone (cost/time = ) then it will do so, thus prioritizing prophylaxis. The fraction of newborns that receive prophylaxis equals
| (7) | |||||
| (8) |
where is an upper bound on the maximum proportion of people who (choose to) get prophylaxis, and is GDP per capita.
Let be the total amount of money spent on prophylaxis per unit time (/time). Then the remaining health budget can be spent on treatment, and the fraction of infectious individuals being treated equals
| (9) |
where is the maximum proportion of infected individuals that are able to be treated. To test the robustness of our findings we also use an entirely opposite strategy where health budget is spent primarily on treatment, and the remaining budget is spent on prophylaxis. Qualitative results remain unchanged (see the Electronic supplementary material [ESM] for details).
The maximum prophylaxis fraction can be inferred from data on immunization indicators, such as vaccination percentage of one-year olds for e.g. Hepatitis B, Haemophilus influenzae B, or Meningococcal vaccine (MCV); all increase with , but plateau at . Costs per prophylaxis, , can be set to reliable values (ranging from USD) (31). In the case of treatment, both parameters are highly disease-specific and thus have large variability. Here we assume a cost of USD per treatment per year, with a maximum treatment fraction of . To test the impact of changing healthcare spending (as percentage of GDP), we vary .
| (10) | |||||
| (11) | |||||
| (12) |
Here transmissibility, , and recovery, , depend on sanitation and nutrition , respectively. The direct dependence of sanitation and nutrition on GDP per capita can be estimated from real-world data. However, due to lack of data on infection probabilities the effect of on must be chosen on a qualitative basis. We assume that decreases as sanitation increases (), and that an increase in capital has only small effects on infection for very low and very high sanitation levels, but has large effects on infection at intermediate levels of sanitation (see the ESM).
4 Data, Modeling Dependence, and Parameter Estimation
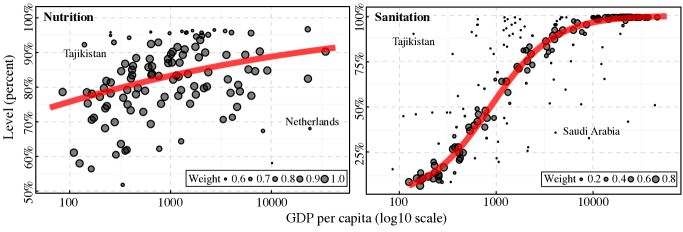
The data shown in Figure 2 were obtained from the World Bank Data Repository (data.worldbank.org) and from www.gapminder.org. Logistic regression to predict sanitation from GDP per capita not only gives a good fit (Figure 2), but also passes standard model checks. The functional relationship thus becomes
| (13) |
where . We proceed analogously for nutrition . Using the transform, (13) becomes linear in
| (14) |
and can be estimated from the data using ordinary least squares (and variants). For the SIRS simulations we use robust parameter estimates (rlm in R (32)). Details on data sources, parameter estimates, and model fits can be found in the ESM.
5 Numerical Results from ODE Simulations
For simulations we fix fundamental economic and disease parameters, and consider how different levels of capital () and health budget policies () affect disease spread as well as economic growth. Ultimately, policymakers are interested in (a low) infection prevalence and (high) economic growth.
The economy we consider i) has a population of one million people (), ii) has a savings rate of , iii) is labor focused (), and iv) has no inflation . Varying and do not make qualitative differences to the main results (see ESM).
As our purpose is to explore two general hypotheses about economic growth and health, we consider a generic disease in a population, i.e. we wish to keep the analysis from being disease-specific and thus applicable to many pathogens, and thus have chosen parameters to encompass longer-duration infections, such as bacterial pneumonia or parasitic worms (25). One time step corresponds to 1 day. We assume a i) maximum recovery rate with a treatment of years-1, ii) treatment effectiveness of (i.e. effective recovery in one week instead of four), iii) birth and death rate of years-1, iv) prophylaxis and treatment costs of /person and per treatment per year, v) maximum prophylaxis and treatment fraction of and , vi) contacts per day, vii) relapse rate of year-1, and viii) complete disability for work (). Parameters for sanitation and nutrition as a function of , as estimated, are , , and , , respectively. Calibration parameters for infection probability and recovery rates are given in the ESM.
The numerical solution of the ODEs was obtained for initial conditions: and (no health budget) for days ( year). At days we raised from zero to and ran the ODEs forward another time steps.
5.1 Increasing the Health Budget can Lead into a Poverty Trap
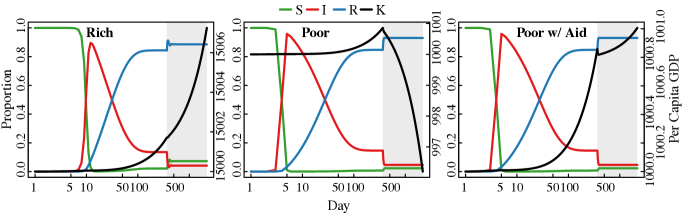
Figure 3 shows an example of two extreme economic scenarios. In a “rich” country () the proportion of infected people reaches about after year and the economy grows exponentially (Figure 3, left panel); after the policy change decreases to about and economic growth slows, but remains positive. A “poor” country () has similar disease prevalence after one year (Figure 3, center panel), and increasing the health budget to also results in a sharp decline in infections. However these policies lead to negative economic growth, which will consequently lead to more infections in the long run. This is the classic poverty trap as previously described (4).
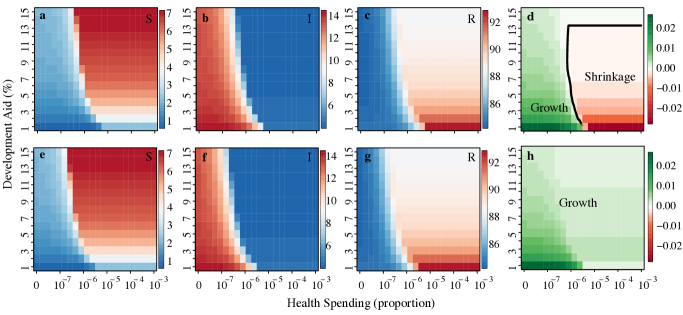
Figure 4 shows the phase space plot of and (log-returns) at days ( years) as a function of initial capital per capita, , and percentage spent on healthcare, . The top-left of Figure 4 show the boundary of effective and economical disease defeat: while both rich and poor economies can lower the proportion of infected people by changing , richer countries (higher initial ) have to spend proportionally less of their budget on prophylaxis and treatment (smaller ), than poorer countries do. Importantly, if a poor country decides to aggressively fight the disease it will temporarily lower prevalence of disease but will end up with negative economic growth (top right, Figure 4, red region of “Shrinkage”), ultimately leading to bankruptcy and possibly high prevalence of disease. Rich countries do not fall into this poverty trap due to remaining positive economic growth.
5.2 Escaping the Poverty Trap
Countries within poverty traps cannot escape without exogenous input. We aim to test two ways of escaping: one, by increasing capital (development aid) and two, by changing the proportion spent on health care (). Figure 4 (top) shows that once in the poverty trap, increasing will not lead to escape. To explore the other means of escape, we introduce development aid by cutting the cost of prophylaxis and treatment in half ( per newborn and per treatment per year). The right panel of Figure 3 shows that this cut in costs puts poor countries (initial ) on a path of economic growth even after increasing (compared to the decline in the center panel). Similarly, the bottom row of Figure 4 demonstrates that poor countries can escape the poverty trap and still have a healthy population if they get sufficient development aid. For countries with low savings rates () or returns on capital (), escape from the poverty trap is possible, albeit at higher levels of development aid (see ESM).
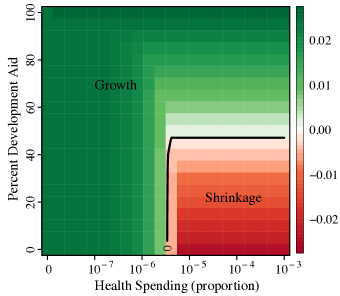
5.3 How Much Support is Necessary?
Development aid in the form of halving the costs of treatment and prophylaxis allow countries to escape the poverty trap, but is this level of support necessary? Figure 5 shows the phase space diagram of health spending (x-axis) versus percentage of development aid (y-axis) for a (poor) country with initial . We see that if development aid exceeds it can provide long term health and economic benefits for the country. Below this level of aid, even if a country is willing to spend a large share of its budget on health they cannot escape the poverty trap.
6 Discussion & Outlook
Economics and the dynamics of infectious disease are deeply linked. Here we extend a model of economics and infectious disease to include endogenous growth of capital. Our aims were twofold: to demonstrate the existence of poverty traps formed by the dynamics of infectious disease (as has been previously demonstrated in (4)) and to test two ways of escaping a poverty trap. Though the framework of our model was relatively simple, we parameterized our model using empirical data in attempts to capture important characteristics of real-world economic and health developments. We found that increasing the percentage of GDP spent on capital alone was not enough to escape the poverty trap, while development aid (through the form of reducing costs of treatment and prophylaxis) allowed countries to reduce disease prevalence and have economic growth, effectively escaping the poverty trap. Our model posits ways to escape poverty traps without having to rely on stochastic effects (6).
Although the nature of the current study was qualitative, our parameter estimates were derived from empirical data and our model features endogenous economic growth, to our knowledge, a first in the field. Future work could extend the model in directions such as incorporating innovation and technology growth (33), education as means to increase human capital (34, 35, 36), as well as international trade (37), or migration (38). Future models could include age-structure to capture differential morbidity and mortality by age. More reliable data to improve parameter estimates, especially nutrition, could increase the realism of the models, as would extending models to incorporate structured populations.
Determining the optimal level of developmental health aid has been the subject of much debate (39, 40). Our findings underly the importance of sufficient developmental aid in that too little aid (here cutting costs by less than ) simply fails to pull economies out of spirals of poor health and low wealth. Our model featured a generic disease and could be further extended to focus on a specific malady (e.g.: malaria, diarrheal diseases, HIV, tuberculosis). Many pathogens which affect developing economies are treatable and our results suggest a relative minimum of aid would be necessary to help these countries become healthier and economically productive. Additionally, our model suggests that with aid, countries can lower per capita health care spending and still have economic growth.
While our data-driven model parametrization yields a more realistic interplay between economic and health, our model extension of previous work still paints a largely simplified picture on the decision making process. Our models are not suitable to give quantitative recommendations for policy makers facing specific health hazards. However, we can show that poverty traps can exist if decision makers do not choose their policies wisely. Designing such optimal policies (perhaps through a dynamic optimization framework) remains a task for future research.
A recent report (41) put forward by a commission of leading global health experts and economists contends that “health disparities between nations could be eliminated within a generation” if funds are invested in healthcare systems of low- and middle-income countries, resulting in enormous social and economic gains. The present work, demonstrating that external aid is key in decreasing the burden of infectious diseases, while also promoting economic growth, offers validating evidence to this report.
Acknowledgments
GMG was supported by an INET grant (no. IN01100005). Our research team is grateful to NSERC (LHD), WAESOBD LSAMPBD NSF Cooperative Agreement HRD-1025879 (OPL), and to Calcul Québec for computing facilities. BMA acknowledges the Omidyar Foundation and an NSF Graduate Research Fellowship (grant no. DGE-0707427). The authors also wish to thank the Santa Fe Institute and their Complex Systems Summer School at which this work was performed.
References
- Berkowitz and Johnson (1974) Monroe Berkowitz and William G. Johnson. Health and labor force participation. The Journal of Human Resources, 9(1):pp. 117–128, 1974. ISSN 0022166X. URL http://www.jstor.org/stable/145048.
- Wolff (2005) François-Charles Wolff. Disability and Labour Supply during Economic Transition: Evidence from Bulgaria. LABOUR, 19(2):303–341, 2005. ISSN 1467-9914. doi: 10.1111/j.1467-9914.2005.00304.x. URL http://dx.doi.org/10.1111/j.1467-9914.2005.00304.x.
- Brown et al. (2008) Sarah Brown, Jenny Roberts, and Karl Taylor. Reservation wages, labour market participation and health. Working Papers 2008002, The University of Sheffield, Department of Economics, 2008. URL http://ideas.repec.org/p/shf/wpaper/2008002.html.
- Bonds et al. (2010) M.H. Bonds, D.C. Keenan, P. Rohani, and J.D. Sachs. Poverty trap formed by the ecology of infectious diseases. Proceedings of the Royal Society B: Biological Sciences, 277(1685):1185–1192, 2010.
- Bonds and Rohani (2010) Matthew H Bonds and Pejman Rohani. Herd immunity acquired indirectly from interactions between the ecology of infectious diseases, demography and economics. J R Soc Interface, 7(44):541–7, 2010. doi: 10.1098/rsif.2009.0281.
- Plucinski et al. (2011) Mateusz M Plucinski, Calistus N Ngonghala, and Matthew H Bonds. Health safety nets can break cycles of poverty and disease: a stochastic ecological model. J R Soc Interface, 8(65):1796–803, Dec 2011. doi: 10.1098/rsif.2011.0153.
- Goenka and Liu (2012) A. Goenka and L. Liu. Infectious diseases and endogenous fluctuations. Economic Theory, 50:125–149, 2012.
- Goenka et al. (2011) Aditya Goenka, Lin Liu, and Manh-Hung Nguyen. Infectious diseases and economic growth. Working papers, LERNA, University of Toulouse, February 2011. URL http://ideas.repec.org/p/ler/wpaper/11.04.338.html.
- Delfino and Simmons (2005) D. Delfino and P.J. Simmons. Dynamics of tuberculosis and economic growth. Environment and Development Economics, 10(6):719, 2005.
- Russell et al. (1996) L.B. Russell, M.R. Gold, J.E. Siegel, N. Daniels, and M.C. Weinstein. The role of cost-effectiveness analysis in health and medicine. JAMA: the journal of the American Medical Association, 276(14):1172–1177, 1996.
- Drummond et al. (2005) M.F. Drummond, M.J. Sculpher, and G.W. Torrance. Methods for the economic evaluation of health care programmes. Oxford University Press, USA, 2005.
- Bauch et al. (2003) Chris T. Bauch, Alison P. Galvani, and David J. D. Earn. Group interest versus self-interest in smallpox vaccination policy. Proc. Nat. Acad. Sci. USA, 100(18):10564–10567, 2003.
- Bauch and Earn (2004) Chris T. Bauch and David J. D. Earn. Vaccination and the theory of games. Proc. Nat. Acad. Sci. USA, 101(36):13391–13394, 2004.
- Reluga et al. (2006) Timothy C. Reluga, Chris T. Bauch, and Alison P. Galvani. Evolving public perceptions and stability in vaccine uptake. Mathematical Biosciences, 204(2):185–198, 2006. doi: 10.1016/j.mbs.2006.08.015. URL http://www.sciencedirect.com/science/article/B6VHX-4KRNR4D-1/2/d114876bb968689217689337b7fb268f.
- Galvani et al. (2007) Alison P. Galvani, Timothy C. Reluga, and Gretchen B. Chapman. Long-standing influenza vaccination policy is in accord with individual self-interest but not with the utilitarian optimum. Proc. Nat. Acad. Sci. USA, 104(13):5692–5697, 2007.
- Vardavas et al. (2007) Raffaele Vardavas, Romulus Breban, and Sally Blower. Can Influenza Epidemics Be Prevented by Voluntary Vaccination? PLoS Computational Biology, 3(5):796–802, 2007.
- van Boven et al. (2008) Michiel van Boven, Don Klinkenberg, Ido Pen, Franz J. Weissing, and Hans Heesterbeek. Self-interest versus group-interest in antiviral control. PLoS ONE, 3(2):e1558, 2008. doi: 10.1371%2Fjournal.pone.0001558. URL http://dx.doi.org/10.1371%2Fjournal.pone.0001558.
- Medlock and Galvani (2009) Jan Medlock and Alison P Galvani. Optimizing influenza vaccine distribution. Science, 325(5948):1705–8, 2009. doi: 10.1126/science.1175570.
- Althouse et al. (2010) Benjamin M Althouse, Theodore C Bergstrom, and Carl T Bergstrom. A public choice framework for controlling transmissible and evolving diseases. Proc Natl Acad Sci U S A, 107 Suppl 1:1696–701, 2010. doi: 10.1073/pnas.0906078107.
- Gersovitz and Hammer (2003) Mark Gersovitz and Jeffrey S. Hammer. Infectious diseases, public policy, and the marriage of economics and epidemiology. The World Bank Research Observer, 18(2):129–157, 2003.
- Gersovitz and Hammer (2004a) Mark Gersovitz and Jeffrey S. Hammer. The economic control of infectious diseases. The Economic Journal, 114:1–27, 2004a.
- Gersovitz and Hammer (2004b) Mark Gersovitz and Jeffrey S. Hammer. Tax/subsidy policies toward vector-borne infectious diseases. Journal of Public Economics, 89:647–674, 2004b.
- Cook et al. (2009) Joseph Cook, Marc Jeuland, Brian Maskery, Donald Lauria, Dipika Sur, John Clemens, and Dale Whittington. Using private demand studies to calculate socially optimal vaccine subsidies in developing countries. Journal of Policy Analysis and Management, 28(1):6–28, 2009. ISSN 0276-8739. URL http://www.ncbi.nlm.nih.gov/pubmed/19090047. PMID: 19090047.
- Geoffard and Philipson (1997) Pierre-Yves Geoffard and Tomas Philipson. Disease eradication: Private versus public vaccination. The American Economic Review, 87(1):222–230, 1997.
- Anderson and May (1992) R.M. Anderson and R.M. May. Infectious Diseases of Humans: Dynamics and Control. Oxford Science Publications. Oxford University Press, 1992. ISBN 9780198540403. URL http://books.google.com/books?id=HT0--xXBguQC.
- Solow (1956) Robert M. Solow. A contribution to the theory of economic growth. The Quarterly Journal of Economics, 70(1):65–94, 1956. ISSN 1531-4650. doi: 10.2307/1884513. URL http://dx.doi.org/10.2307/1884513.
- US Library of Congress (2007) US Library of Congress. Country profile: Kyrgyzstan. Technical report, United States Library of Congress, 2007. URL http://www.unhcr.org/refworld/docid/46f9134b0.html.
- Kunitz (2004) Stephen J Kunitz. The making and breaking of yugoslavia and its impact on health. Am J Public Health, 94(11):1894–904, Nov 2004.
- Houthakker (1955) H. S. Houthakker. The Pareto Distribution and the Cobb-Douglas Production Function in Activity Analysis. The Review of Economic Studies, 23(1):pp. 27–31, 1955. ISSN 00346527. URL http://www.jstor.org/stable/2296148.
- Goldberger (1968) Arthur S. Goldberger. The Interpretation and Estimation of Cobb-Douglas Functions. Econometrica, 36(3/4):464–472, 1968. ISSN 00129682. URL http://www.jstor.org/stable/1909517.
- Wolfson et al. (2008) Lara J Wolfson, François Gasse, Shook-Pui Lee-Martin, Patrick Lydon, Ahmed Magan, Abdelmajid Tibouti, Benjamin Johns, Raymond Hutubessy, Peter Salama, and Jean-Marie Okwo-Bele. Estimating the costs of achieving the WHO-UNICEF Global Immunization Vision and Strategy, 2006-2015. Bulletin of the World Health Organization, 86:27 – 39, 01 2008. ISSN 0042-9686.
- R Development Core Team (2010) R Development Core Team. R: A Language and Environment for Statistical Computing. R Foundation for Statistical Computing, Vienna, Austria, 2010. URL http://www.R-project.org/. ISBN 3-900051-07-0.
- Romer (1994) Paul M. Romer. The origins of endogenous growth. The Journal of Economic Perspectives, 8(1):pp. 3–22, 1994. ISSN 08953309. URL http://www.jstor.org/stable/2138148.
- Aghion et al. (2009) P. Aghion, L. Boustan, and C. Hoxby. The Causal Impact of Education on Economic Growth: Evidence from U.S., 2009.
- Hanushek and Woessmann (2007) Eric A. Hanushek and Ludger Woessmann. The role of education quality for economic growth. Policy Research Working Paper Series 4122, The World Bank, 2007. URL http://ideas.repec.org/p/wbk/wbrwps/4122.html.
- Stone et al. (2010) Joe Stone, Neil Bania, and Jo Anna Gray. Public infrastructure, education, and economic growth: Region-specific complementarity in a half-century panel of states. MPRA Paper 21697, University Library of Munich, Germany, 2010. URL http://ideas.repec.org/p/pra/mprapa/21697.html.
- Lucas (1988) Robert E. Lucas. On the mechanics of economic development. Journal of Monetary Economics, 22:3–42, 1988. URL http://linkinghub.elsevier.com/retrieve/pii/0304393288901687.
- Golgher et al. (2011) André Braz Golgher, Lízia De Figueiredo, and Roberto Santolin. Migration and economic growth in Brazil: empirical applications based on the Solow-Swan model. The Developing Economies, 49(2):148–170, 2011. ISSN 1746-1049. doi: 10.1111/j.1746-1049.2011.00127.x. URL http://dx.doi.org/10.1111/j.1746-1049.2011.00127.x.
- Okamoto et al. (2009) Miyoko Okamoto, Sithan Nhea, Hidechika Akashi, Leo Kawaguchi, Shiori Ui, Mari Kinoshita, and Atsuko Aoyama. Developing institutional capacity of health service system management at the district level in rural cambodia. Biosci Trends, 3(6):239–46, Dec 2009.
- Gilson and Raphaely (2008) Lucy Gilson and Nika Raphaely. The terrain of health policy analysis in low and middle income countries: a review of published literature 1994-2007. Health Policy Plan, 23(5):294–307, Sep 2008. doi: 10.1093/heapol/czn019.
- Jamison et al. (2013) Dean T. Jamison, Lawrence H. Summers, George Alleyne, Kenneth J. Arrow, Seth Berkley, Agnes Binagwaho, Flavia Bustreo, David Evans, Richard G. A. Feachem, Julio Frenk, Gargee Ghosh, Sue J. Goldie, Yan Guo, Sanjeev Gupta, Richard Horton, Margaret E. Kruk, Adel Mahmoud, Linah K. Mohohlo, Mthuli Ncube, Ariel Pablos-Mendez, K. Srinath Reddy, Helen Saxenian, Agnes Soucat, Karene H. Ulltveit-Moe, and Gavin Yamey. Global health 2035: a world converging within a generation. The Lancet, 382(9908):1898–1955, December 2013. ISSN 01406736. doi: 10.1016/s0140-6736(13)62105-4. URL http://dx.doi.org/10.1016/s0140-6736(13)62105-4.