Review of the Use of Electroencephalography as an Evaluation Method for Human-Computer Interaction
Abstract
Evaluating human-computer interaction is essential as a broadening population uses machines, sometimes in sensitive contexts. However, traditional evaluation methods may fail to combine real-time measures, an “objective” approach and data contextualization. In this review we look at how adding neuroimaging techniques can respond to such needs. We focus on electroencephalography (EEG), as it could be handled effectively during a dedicated evaluation phase. We identify workload, attention, vigilance, fatigue, error recognition, emotions, engagement, flow and immersion as being recognizable by EEG. We find that workload, attention and emotions assessments would benefit the most from EEG. Moreover, we advocate to study further error recognition through neuroimaging to enhance usability and increase user experience.
1 INTRODUCTION
Along computer science history, interfaces and interactions have been getting more complex. Nowadays computers are everywhere, used by everyone. It is necessary to make them comply with human capabilities, practical to use. This is mostly done by evaluating HCI prior to their public availability. Yet traditional evaluation methods could either be ambiguous, lack real-time recordings, or disrupt the interaction.
On the other hand, new technologies arise. Physiological sensors help to improve the ergonomics of human-computer interaction (HCI) [Fairclough, 2009]. Systems could be tuned to users by monitoring their mental workload in real-time [Kohlmorgen et al., 2007]. Physiological sensors add an insightful information channel. However sensors may be intrusive or require a calibration to record a proper signal, and some are hardly available to consumers.
These issues could be resolved by using physiological sensors in HCI evaluation. While designing a user interface (UI) it should be acceptable to add sensors’ hindrance to specially enrolled users. Those testers will then help to improve beforehand the UI. Laboratory conditions permit a controlled setup for repeatable measures. Neuroimaging rely on demanding but sensitive sensors. We consider them as an innovative supplement to conventional evaluation methods. Measuring neural activity during HCI can help us to better understand what occurs in the brain when users are interacting [Parasuraman, 2013].
We highlight in this paper which neuroimaging techniques could be used conveniently within laboratories to overcome the difficulties encountered by traditional evaluation methods alone. We review a repertoire of patterns of users’ state which could be used to characterize HCI, and evaluate how neuroimaging objectively measures them. We call those patterns “constructs”, a term which refers to notions as different as workload and the state of “flow”.
Other papers already began to sense how neurotechnologies benefit HCI, but they do not cover evaluation [George and Lécuyer, 2010], or if so they do not study many constructs. [Parasuraman, 2013] only discuss workload, vigilance and error recognition. In the present review we gathered from the HCI literature every major construct which could potentially be evaluated with brain activity.
In this review, we first briefly describe the different families of evaluation methods aimed at assessing HCI and UI quality, along with their advantages and drawbacks. We divided them in four categories: behavioral studies (observations of users actions in real-time), inquiries (e.g. questionnaires, interviews, think aloud), physiological sensors (e.g. heart rate, galvanic skin response) and neuroimaging (a subset of physiological sensors which records brain activity). We also formalize a new scale (whenever the measure is “exocentic” or “egocentric”) which could help to choose the right combination of methods for evaluations.
We show that electroencephalography (EEG) is the neuroimaging technique which offers the best trade-off between spatial and temporal resolution, practical use and cost. Therefore we focus on EEG during the second part. We review there constructs related to the quality of HCI. We identified that workload, attention, vigilance, fatigue, error recognition, emotions, engagement, flow and immersion are useful for evaluation and can be measured with EEG.
Finally we outline the challenges and limitations which arise from this encounter between HCI evaluation and neurotechnologies, as well as constructs that could benefit from being measurable with EEG.
2 EVALUATION METHODS
2.1 Behavioral Studies
Recording users interactions, such as mouse speed, is one standard way to evaluate a UI. “Behavioral studies” refers to this method: behavior and actions of users inside a software. Behavioral studies are close to performance measures, as seen in human factors. The easiest way to sense if a UI is well designed is to watch users. How fast do they complete the task? Are they more accurate with a bigger mouse cursor? Such methods helped to formulate a preeminent law in HCI, Fitts’s law, which is all about time to reach a target depending on its distance and size [Fitts, 1954].
Although behavioral studies are able to account in real-time for users’ interactions, they can be hard to interpret: measures may not be specific to one construct. E.g. a high reaction time can be caused either by a low concentration level or a high workload [Berka and Levendowski, 2007], [Hart and Staveland, 1988]. On top of that, behavioral studies may not provide much information on the users’ state. With simple tasks in particular, little can be computed beside reaction times and a performance metric.
2.2 Inquiries
While it is possible to infer users’ thoughts through a behavioral study, it may be simpler to record their opinion. We call this “inquiries”. In HCI we are interested in questionnaires related to the use of a UI. Standardized questionnaires have been validated across several studies for various measures: e.g. NASA-TLX for workload [Hart and Staveland, 1988].
Unfortunately those “pen and paper” tests are discrete and are not good for real-time assessments. The “think aloud” protocol [Weber, 2007] is a way to circumvent this, yet it could influence the interaction as users still have two different things to do: interact and report their experience. It is an example of double task and divided attention [Ogolla, 2011]. “Focus groups” [Bruseberg and McDonagh-Philp, 2002] is the third form of inquiry. It involves experts and advanced users, who exchange about their findings under the control of the designer.
Questionnaires, think aloud an focus group are three different forms of inquiry fraught with the same hazards. Resulting measures are prone to be contaminated by ambiguities [Nisbett and Wilson, 1977], social pressure [Picard, 1995] or participants’ memory limitations [Kivikangas et al., 2010] – when answers are not oriented toward experimenters’ expectations if subjects figure out what is at stake.
2.3 Physiological Sensors
When humans interact with computers bodily changes co-occurs with mental changes. E.g. pupils dilate while experiencing strong emotions [Partala and Surakka, 2003]. Physiological sensors can be used in order to account for such body changes in HCI [Fairclough, 2009], [Dirican and Göktürk, 2011] or game [Ravaja, 2009], [Nacke et al., 2009] research. Galvanic skin response (GSR, also called “electrodermal activity”) is among those sensors, as well as electrocardiography (ECG, the signal modality heart rate is derived from) and electromyography (EMG, caused by muscular activity, including facial expressions).
Even if someone trained could control his heartbeat, physiological cues are great for the “objectivity” they bring into HCI (see section 2.5). Body reactions are sometimes misleading though: you may record ECG to study attention, whereas an increase in heartbeat can also be caused by strong feelings. Muscles and organs are controlled by the peripheral nervous system. Physiological sensors are a second-order inference about the processing which occurs in the central nervous system.
2.4 Neuroimaging
Neuroimaging is a currently rising field used in brain-computer interfaces (BCI) settings [Blankertz et al., 2010], [Hamadicharef, 2010]. Neuroimaging techniques allows the assessment of brain activity; we classify them apart even if strictly speaking they do belong to physiological sensors.
Non-invasive neuroimaging techniques, which do not require surgery, are divided into two main families [Zander and Kothe, 2011]. Functional magnetic resonance imaging (fMRI) and functional near-infrared spectroscopy (fNIRS) record brain activity through blood flow variations. fMRI has a very good spatial resolution but is a large device which completely surrounds subjects and costs about one million dollars. fNIRS is a much more lightweight and affordable device. Instead of magnetic fields, it uses direct light for recordings. Sensors are fixed on a cap, hence subjects are free to interact with a computer while wearing it. Compared to fMRI, the spatial resolution of fNIRS is less detailed. It records only the outer region of the brain – light is absorbed by tissues. fMRI and fNIRS share a poor temporal resolution. With a latency reaching up to several seconds it is difficult to observe fast and short responses.
The second family of neuroimaging uses electrical currents generated by neural activity. Magnetoencephalography (MEG) records magnetic fields. It is less heavy and expensive than fMRI, but still hardly manageable for uses in HCI contexts. MEG has a high temporal resolution, down to the millisecond. Electroencephalography (EEG) also has a high temporal resolution. It is comparable in size to fNIRS. EEG measures electrical current onto the scalp. Electrodes are “dry” – no electrolyte solution – or, more frequently, “wet” – solvent is either water or gel. Despite its poor spatial resolution it is a relatively cheap equipment for a laboratory. Because it is portable and non invasive, it interferes little with HCI setting.
Experimenters must be cautious with the limitations of the device they choose. Is the signal-to-noise ratio sufficient for what they intend to measure? What artifacts could pollute their data? Are they in control of the algorithms producing measures from raw signals? That said, EEG is the most promising candidate to assist inquiries and other physiological sensors in a wide range of evaluation measures. Compared to others neuroimaging devices, EEG offers the best compromise between spatial and temporal resolution, practical use and cost. Therefore we focus mostly on this type of brain activity recordings in this paper.
2.5 A New Continuum for HCI Evaluation Methods
We have previously mentioned how the evaluation methods do bring different levels of “objectivity” in their measures. Unfortunately, in such context “objective” and “subjective” are scarcely defined in the literature. According to [van de Laar et al., 2013], “the objective methods are based on overt and covert user responses during interaction while the subjective methods rely on user expressions after the interaction”. From that perspective, inquiries are “subjective” while behavioral studies, physiological sensors and neuroimaging are “objective”.
While we agree such a distinction is required, a more rigorous vocabulary is needed. We also doubt the “time” variable should be involved in the definition. As stated in section 2.2, results of inquiries are prone to social pressure and other self-interpretations, and this is also true for the real-time think aloud. Moreover, when studying emotions, it could be argued that only “subjective” feelings are recorded, as the evaluation is centered on the user. Hence, without a complex phrasing (i.e. “objective measure of subjective feelings”), employing such words is open to criticisms. As an alternative “direct” and “indirect” could be considered. But then those concepts are more likely to refer to how measures are reported, not where they originate from (e.g. EMG vs an external observer annotating facial expressions).
As such, we would like to introduce a new nomenclature to name those two aspects and avoid ambiguities: exocentric and egocentric. Those terms are borrowed from spacial navigation research [Brandt et al., 1973] and bring the notion of the self. Exocentric measures are here close to the stimuli, to the source, while egocentric measures are close to the conscious thoughts of the user, to the outcome.
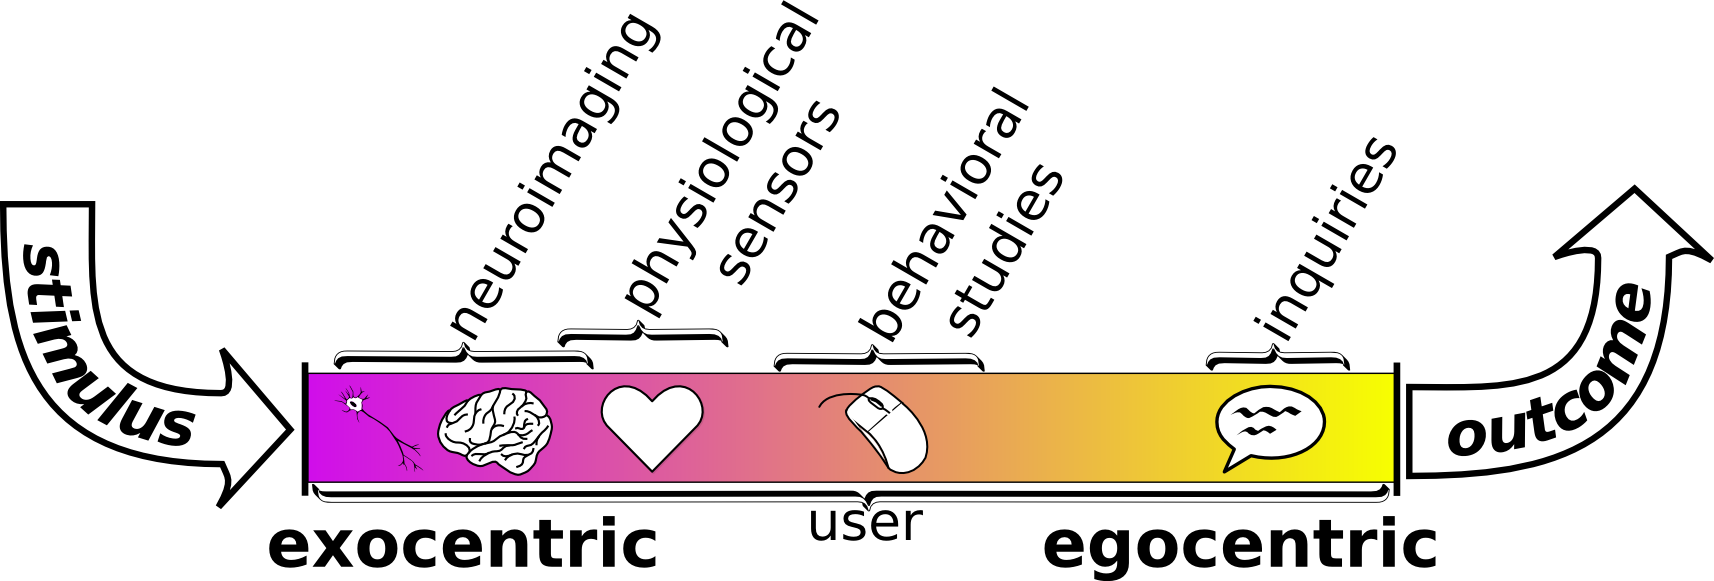
We therefore create a continuous space between two extremes (see Figure 1). We illustrate this scale with the measurement of pain. The pressure of a needle on a finger would represent a perfect exocentric measure: the stimulus’ strength, a value disconnected from human body and perceptions. When the pressure is transmitted to nociceptors in the skin, the measure shifts a little from exocentric to egocentric. As nerves are transmitting signals from the peripheral nervous system to the brain, we go further to the right of the axis. Since we may not be interested in skin’s thickness, this neural activity represents the first interesting value from this side of the exo/egocentric scale. Neuroimaging techniques record such activity, hence it is the most exocentric evaluation method. When the signal reaches the central nervous system, autonomic responses are triggered – increase in heart rate, galvanic skin response [Loggia et al., 2011]. Those reactions could be recorded through physiological sensors, a step further from the exocentric extreme.
As the pain grows, it will alter behaviors and thoughts. A runner may slow down when experiencing pain in a foot, no matter his willingness. Behavioral studies are able to sense modifications occurring against the will of the subject; that could be placed somewhere in the middle of our scale. Concurrently, most of the time, the person is being aware of the pain and could phrase it if asked to. Many other cognitive processes are involved in such a high level of consciousness (e.g. planning, awareness), thus measures recorded by inquiries are close to the far-end of the scale and are indeed egocentric.
This scale can be used for various evaluations. Eventually, it is possible to add “objective/subjective” and “direct/indirect” to describe a whole framework. A construct could be objective (usability) or subjective (emotions). A tool could be either direct (sensor) or indirect (observer). A method is more exocentric (neuroimaging) or egocentric (inquiries). E.g. the work of an experimenter assessing workload with ECG can be described as objective/exocentric/direct.
3 CONSTRUCTS
“Constructs” designate the patterns of users’ state which could be used to characterize interactions. This part reviews relevant constructs from an HCI evaluation perspective that can be assessed using neuroimaging techniques. We grouped similar measurements.
3.1 Workload
3.1.1 Definition
Humans have a limited set of resources to process information [Just et al., 2003]. The ratio between processing power and data coming from the environment determines mental workload. Workload increases as cognitive resources lessen or as the quantity of demands grows. If the workload is too high subject’s performance decreases, sometimes dramatically.
3.1.2 Neuroimaging
Using a device with 9 channels [Berka and Levendowski, 2007] correlated EEG with workload. With a better equipment [Mathan et al., 2007] showed how EEG measures more subtle changes compared to ECG. fNIRS is another well-tried technology: neurons require more energy, hence more oxygen, as the load increases. fNIRS showed better results compared to EEG, with 82% of correct classifications between 2 classes (low vs high workload) and 50% with 3 classes (low, medium, high) [Hirshfield et al., 2009].
In [Blankertz et al., 2010] EEG online analyses (i.e. in real-time) discriminate 2 classes with a 70% accuracy. A 2 minutes time window enables scores from 80% to 90% [Brouwer et al., 2012]. With 2 classes still, reviews report scores close to 100% if EEG is combined with other physiological sensors [van Erp et al., 2010]. [Grimes et al., 2008] claim 99% success in distinguishing 2 memory load levels, 88% with 4.
3.2 Attention – Vigilance – Fatigue
3.2.1 Definition
Attention, vigilance and fatigue are closely related and regularly measured altogether [Oken et al., 2006].
“Attention” refers to the ability to focus cognitive resources on a particular stimulus [Kivikangas et al., 2010]. A correct selective attention allows to ignore distractors. An insufficient attention level results in a difficulty or an inability to complete the task, whereas too high or narrow attention resources may prevent someone to disengage from a sub-task.
While in the literature, “attention” designates more frequently the ability to perceive changes from the environment, the term “vigilance” then often refers to a broader resource, dependent of both cognitive performance and the arousal level on the sleep–wake spectrum [Oken et al., 2006]. In that sense it refers to a state of sustained attention. One needs to maintain a high degree of vigilance over time in order to focus his attention on something. Hereby “alertness” will be considered as a synonym of “vigilance”.
“Fatigue” is a state in which cognitive resources are exhausted. If the required level of vigilance or attention causes a strain too important on the organism, fatigue arises and performances decrease [Boksem et al., 2005]. Then the task cannot be performed correctly and errors appear [van Erp et al., 2010].
3.2.2 Neuroimaging
The alpha band is associated with attention. When eyes are closed, or when fatigue occurs, alpha waves amplitude increases [Shaw, 2003]. This frequency band in the range 8-12Hz is mostly generated by the occipital lobe. It is easily recorded with EEG, even with a single electrode [George et al., 2011]. Alpha band analysis discriminates different attention levels [Klimesch et al., 1998]. Even more, it enables to detect which side of his visual field a subject is paying attention to while his eyes stare in front of him with 70% accuracy [Trachel et al., 2013].
Other types of brain activity are used, such as delays in event-related potentials (ERP) – e.g. visual selective attention in [Saavedra and Bougrain, 2012].
[Berka and Levendowski, 2007] suggested that EEG is the only sensor which can accurately report attention and vigilance shifts on a second-by-second timeframe. Works investigating vigilance measures are reviewed in [Parasuraman, 2013].
Regarding fatigue, if EEG signals are not more accurate than physiological sensors to detect microsleeps, they offer the possibility to detect preceding inattentive states [Blankertz et al., 2010, sec. 3.1]. Mental fatigue has been detected on 4 seconds time windows with 80% accuracy, or 94% over 30 seconds [Laurent et al., 2013]. In order to improve reliability, additional frequency ranges were recorded in this study. For instance alpha, theta (4-8Hz) and beta (13-18Hz) bands have been combined. ERP on the other hand have been used to study how fatigue impairs differently cognitive processes [Lorist et al., 2000].
3.3 Error Recognition
3.3.1 Definition
We call “error recognition” the situation that occurs when users detect by themselves an outcome different from what is expected [Nieuwenhuis et al., 2001]. It can be something users genuinely trigger but then they realize they did a mistake. Or it can happen due to commands erroneously interpreted by the machine.
Error recognition does not occur when a negative feedback is given per se [Ferrez and Millan, 2008]. It is a matter of recognition by the user of a faulty event. In UI evaluation, error recognition could be an objective measure of subjective (mis)representations, an objective assessment of how intuitive an HCI is.
3.3.2 Neuroimaging
ERP are “peaks” and “valleys” in averaged EEG recordings associated with an external event. ERP differ in their “shapes”, place on the scalp and latency depending on the source of the stimuli or on the underlying cognitive mechanism. One particular kind of ERP has been discovered: error-related potentials (ErrP) [Schalk et al., 2000]. They are triggered when an “error” occurs. It can be caused by something users themselves did (response ErrP), by an incorrect response from the command they used (interaction ErrP), by something they witnessed from another user (observation ErrP), and also when an explicit negative feedback is given (feedback ErrP). All of which have distinguishable features [Ferrez and Millan, 2008].
Response ErrP and interaction ErrP suit perfectly our definition of “error recognition”. Brain signals are elicited even when users are not consciously aware of errors [Nieuwenhuis et al., 2001]. ErrP have been used to discriminate between incorrect and correct users decisions. In [Chavarriaga and Millan, 2010] respectively 76% and 63% accuracy were obtained to detect observation ErrP in “single trial”, i.e. in detecting ErrP for each user’s action.
These scores are common in the literature: 79% and 84% in a task involving interaction ErrP [Ferrez and Millan, 2008]. Accuracy relates to EEG devices’ quality. From 70% with an entry-level headset and non gel-based electrodes [Vi and Subramanian, 2012] up to 90% with a more expansive device [Schmidt et al., 2012]. While ErrP detection does not reach 100% (chance is 50%), those scores are sufficient to improve HCI reliability [Vi and Subramanian, 2012].
[Sobolewski et al., 2013] recorded EEG while subjects use a mouse and have to reach different targets. In one-fourth of the trials the hand-to-cursor mapping is randomly off-set by several degrees. Users do not expect these shifts and the analysis gives first insights that the amplitudes of elicited ErrP could relate to the degree of error. If this result is confirmed we may link error recognition to “intuitivity” evaluation.
3.4 Emotions
3.4.1 Definition
Psychology and neuroscience showed that emotions are connected to high-level reasoning; they are tightly linked to decision-making processes [Damasio, 1994]. The valence/arousal model is the most commonly used paradigm to categorize emotions [Picard, 1995]. In this two-dimensional representation, valence is related to hedonic tone and varies from “negative” to “positive” (e.g. frustrated vs pleasant); arousal is related to bodily and mental activation and varies from “calm” to “excited” (e.g. satisfied vs happy). This model must be applied with caution with some populations. Children hardly make distinction between different arousal levels [Posner et al., 2005].
3.4.2 Neuroimaging
Technologies with the highest temporal resolution, such as MEG or EEG, are more indicated when a dynamic content is involved [Vecchiato et al., 2011].
An asymmetry within frequency bands (e.g. alpha and theta) in the frontal brain could be related to different emotions (valence), such as pleasantness/unpleasantness [Vecchiato et al., 2011]. Still, EEG is not yet a reliable sensor to assess emotions. In [Chanel et al., 2011] even if EEG was better than the other studied physiological sensors on short period of times, a 56% accuracy barely suffices for the differentiation of three emotions (chance level is 33%).
Some Papers report high classifications rates. In [Liu et al., 2011] 7 emotions are categorized. Authors state a 85% accuracy for arousal and 90% for valence. This using only three channels of an EEG headset which is known to be sensitive to EMG artifacts. In pure EEG studies it is important to control for facial expressions (i.e. EMG signals), because they can be easily recorder by electrodes. This is even more problematic when emotions are involved. Although we have to be cautious when assessing EEG reliability, there is nothing wrong in combining EEG and EMG (or other sensors) to improve overall performance.
Despite the lack of clear indicators of affect in EEG, neuroimaging is nevertheless a good lead for novel research in this topic. For example different patterns of EEG signals have been observed depending on the sense (sight or hearing) which induces an emotion [Mühl et al., 2011]. It could then be speculated that neuroimaging one day will be able to discriminate which emotion is elicited by which input modality, or which information channel leads to positive and which to negative user experience.
3.5 Engagement – Flow – Immersion
3.5.1 Definition
Definitions of “engagement”, “immersion” and “flow” overlap. From [Matthews et al., 2002], task engagement is defined as an “effortful striving towards task goals”. Authors add that task engagement increases during a demanding cognitive task and decreases when participants perform a sustained and monotonous vigilance task, see also [Fairclough, 2009]. In [Chanel et al., 2011] “engagement” is treated as one particular emotion, expressed as “positive excited” in the valence/arousal model. Engagement is at a crossroads between several concepts studied in this paper: workload, attention and emotions.
“Flow” originates from psychological studies involving challenge and/or creativity. It is a state in which someone is totally involved in what he is doing. Flow happens when the skills of the person meet a sufficient amount of challenge. A too important challenge brings anxiety, for too much skills it is boredom, and too few of both results in apathy [Nacke and Lindley, 2009]. Here again, several measures are involved. Challenge relates to workload and the resulting state to emotions. By definition, flow implies engagement.
“Immersion” is studied mainly in virtual reality (VR) litterature. In [Slater et al., 2009] immersion stands for the modalities hardware gives to users, how well devices can preserve fidelity in VR compared to reality. Then the subjective feeling of being in the VR is called “presence”. Unfortunately this distinction between “immersion” and “presence” is less clear-cut in other papers, see [Nacke and Lindley, 2009].
3.5.2 Neuroimaging
In neuroimaging literature [Fairclough, 2009], [George and Lécuyer, 2010] engagement assessment studies are mentioned, but they often relate only to sub-components such as workload or attention. [Berka and Levendowski, 2007] see engagement as a process related to information gathering, visual scanning, and sustained attention. This study managed to discriminate workload and engagement by using EEG but the tasks involved (mental additions, recalls) are close to what is seen elsewhere in attention/vigilance protocols. Engagement is often left entangled with other states in a “performance” measure, see [Blankertz et al., 2010, sec. 3.2].
Experiments conducted during the FUGA project showed that flow could be related to fMRI measures [Ravaja, 2009]. The analysis with EEG of frequency bands shows different pattern across three conditions of interaction: boredom (i.e. not engaged), flow and immersion in a pilot study [Nacke et al., 2010]. [Berta et al., 2013] improved on this work and achieved a 66% classification accuracy.
4 CHALLENGES
We saw how constructs relevant to HCI can be investigated with neuroimaging techniques. In this section we will argue that two of them could benefit drastically from neurotechnologies: error recognition and attention. Besides accuracy, both could reach a new level of description. Furthermore we will emphasize the need for the evaluation of a whole HCI to account for constructs of higher level, to study usability and user experience. Finally we have to take care of EEG devices and reliability in order to make it casual for experimenters to use neuroimaging techniques.
4.1 Improving on Constructs
Measuring of two constructs would particularly benefit from improvements in neuroimaging.
First, as it may enable a real-time measure of how intuitive a UI is, we would benefit from a continuous and modulated measure of error recognition. We saw how error recognition can be indicated through ErrP [Schalk et al., 2000]. This means that it is possible to detect when an interaction runs against users’ expectations [Ferrez and Millan, 2008], i.e. when it is not intuitive. At the moment only a binary measure and poorly detailed data – “an ErrP is detected or not” – is reliably obtained. Fortunately it seems possible to measure a modulated ErrP [Sobolewski et al., 2013], thus sensing by how much an operation in the UI has perturbed users. If it is to be confirmed, this would enable a quantitative and qualitative data assessment. We saw how single trial detection can be achieved with EEG. Promising work reported ErrP detection as the movement is occurring, within a 400ms timeframe [Milekovic et al., 2013]. At the moment this near continuous detection uses an invasive technique.
The construct evolving around attention would be the second one to profit from neuroimaging. To distinguish clearly in their measurements vigilance and fatigue would be one point. On the other hand EEG studies showed that visual artifacts in images or videos are detected by subjects beyond consciousness [Scholler et al., 2012], whenever it is conscious perception or attention [Mustafa et al., 2012]. This would suggest that ERP could be used to anticipate how much information users are able to process, before even considering their attention level. A (highly) speculative experimental design where various cues are hidden within sensory modalities in order to elicit evoked potentials would create a “human bandwidth” assessment, upstream from vigilance and attention.
4.2 Assessing New Constructs
Three constructs sit apart in our nomenclature. Both usability and comfort are more closely related to UI properties than to users’ state, and user experience is entirely based on previously seen measures. Since they are the subject of many HCI papers, it is worth to shape their meaning in this review in order to encourage their assessment with neuroimaging techniques.
4.2.1 Usability – Comfort
“Usability” groups together the notions of “ease of use” and “usefulness” [Bowman et al., 2002]. It relates to speed, accuracy and error rates in task completion. The learnability of UI is also a key point of usability. As such a good affordance of UI elements – how perceptions of objects induce a proper use – will improve overall usability. Usability is impacted by UI nature and constrains. E.g. an input device based on body gestures is likely to be more tiring than a joystick, given that it requires more energy from the user. Usability is inextricably bound to users’ comfort.
Although usability could be investigated through behavioral studies or inquiries [Jankowski and Hachet, 2013], to our knowledge there is no neuroimaging study which accounts solely for this construct. Neuroimaging has been used instead as an indicator, for example workload through fNIRS [Hirshfield et al., 2009]. In conjunction with other evaluation methods, real-time recordings from physiological sensors and neuroimaging give additional insights and help to contextualize data [Pike et al., 2012].
4.2.2 User Experience
For [Mandryk et al., 2006] user experience (UX) is a shift from usability analysis by bringing emotions and entertainment into the equation. UX embeds “usability/comfort”, “emotions” and “engagement/flow/immersion”. UX is a higher comprehension level of what users experience during interactions. [Ravaja, 2009] compiled various methods to measure media enjoyment. It is possible to refer to UX when studying the social aspect of interactions – e.g. GSR is different if the opponent in a sport game is played by a friend or a computer [Mandryk et al., 2006]. Assessing UX every time new technologies are used could guide the HCI community in its choices, e.g. with BCI [van de Laar et al., 2013].
4.3 Hardware – Signal Processing
Some limitations observed in EEG research are yet to be resolved to make EEG-based evaluation of HCI more operable. EEG devices, while practical compared to other neuroimaging techniques, take long to set up. Hence experiments can be tedious both for the experimenter and for the subject. This is why there are often only few subjects during EEG or BCI experiments, which is a problem for the reliability of the results. EEG signals contain many potential artifacts (e.g. muscular activity and electrical parasites); the quality of the device is essential. EEG signals must be calibrated, processed and interpreted carefully.
Since a few years new EEG devices have appeared, oriented toward a larger public. Their electrodes use no conductive solution, or water as solvent. These electrodes are faster to set-up – no more gel to be put on each one after the device has been installed – but may be less sensitive, see [Blankertz et al., 2010, sec. 2.1]. Hence some companies, while transforming EEG into a mass-product, bring less reliable technology to the market. Those devices often possess fewer electrodes. Without a cap the electrodes are difficult to place in a standardized position on the scalp. Finally they are often packaged with software development kits which hide the signal processing from the users. Constructs like attention or emotions are then claimed to be directly measured, without further justification or muscular artifact control, see [Heingartner, 2009]. Nevertheless, while experimenters must be aware of such limits if their intent is to rely solely on brain activity, this increasing appeal in favor of cheap EEG devices is a great opportunity to push forward the use of neuroimaging in HCI.
Improvements in signal processing, either in features extraction or classification, could benefit every technology. Constructs, such as emotions, are not yet accurately assessed with pure EEG signals. When too many classes (e.g. emotions and workload levels) are assessed altogether, the classifier performance drops – e.g. see how the “curse-of-dimensionality” relates to classifiers’ complexity [Friedman, 1997]. Improvements in mathematical analysis and machine learning algorithms, as well as a better understanding of brain activity, would increase the reliability of the whole system by a great amount and favour every construct.
Finally, no matter how lightweight they are, EEG and physiological sensors change the way users interact. Movements could be restrained by the devices (less immersion) and users could perceive a more stressful context, potentially biasing their experience. As a result, a framework integrating physiological sensors and traditional evaluation methods has to be conceived to profit from the potential of these novel methods, while avoiding their limitations and pitfalls.
5 CONCLUSION
We reviewed how neuroimaging techniques could assess constructs relevant for HCI evaluation.
Between the four categories of evaluation methods, inquiries could deliver more qualitative data, while physiological sensors and neuroimaging are exocentric measures (the most “objective” measures of subjectively perceived stimuli). It is particularly interesting to combine those methods for constructs otherwise difficult to assess with exactitude, as investigated in many studies [Ravaja, 2009], [Nacke and Lindley, 2009], [van Erp et al., 2010], [Chanel et al., 2011].
Our analysis of neuroimaging techniques focused on EEG as it promises a good trade-off between cost, time resolution and ease of installation. We advocate that neurotechnologies can bring useful insights to HCI evaluation. EEG devices are not yet perfectly reliable and practical to use; hardware and software processing are still evolving. However their cumbersomeness is partially avoided if they are used during a dedicated evaluation phase in the HCI development process, with specially enrolled users (testers).
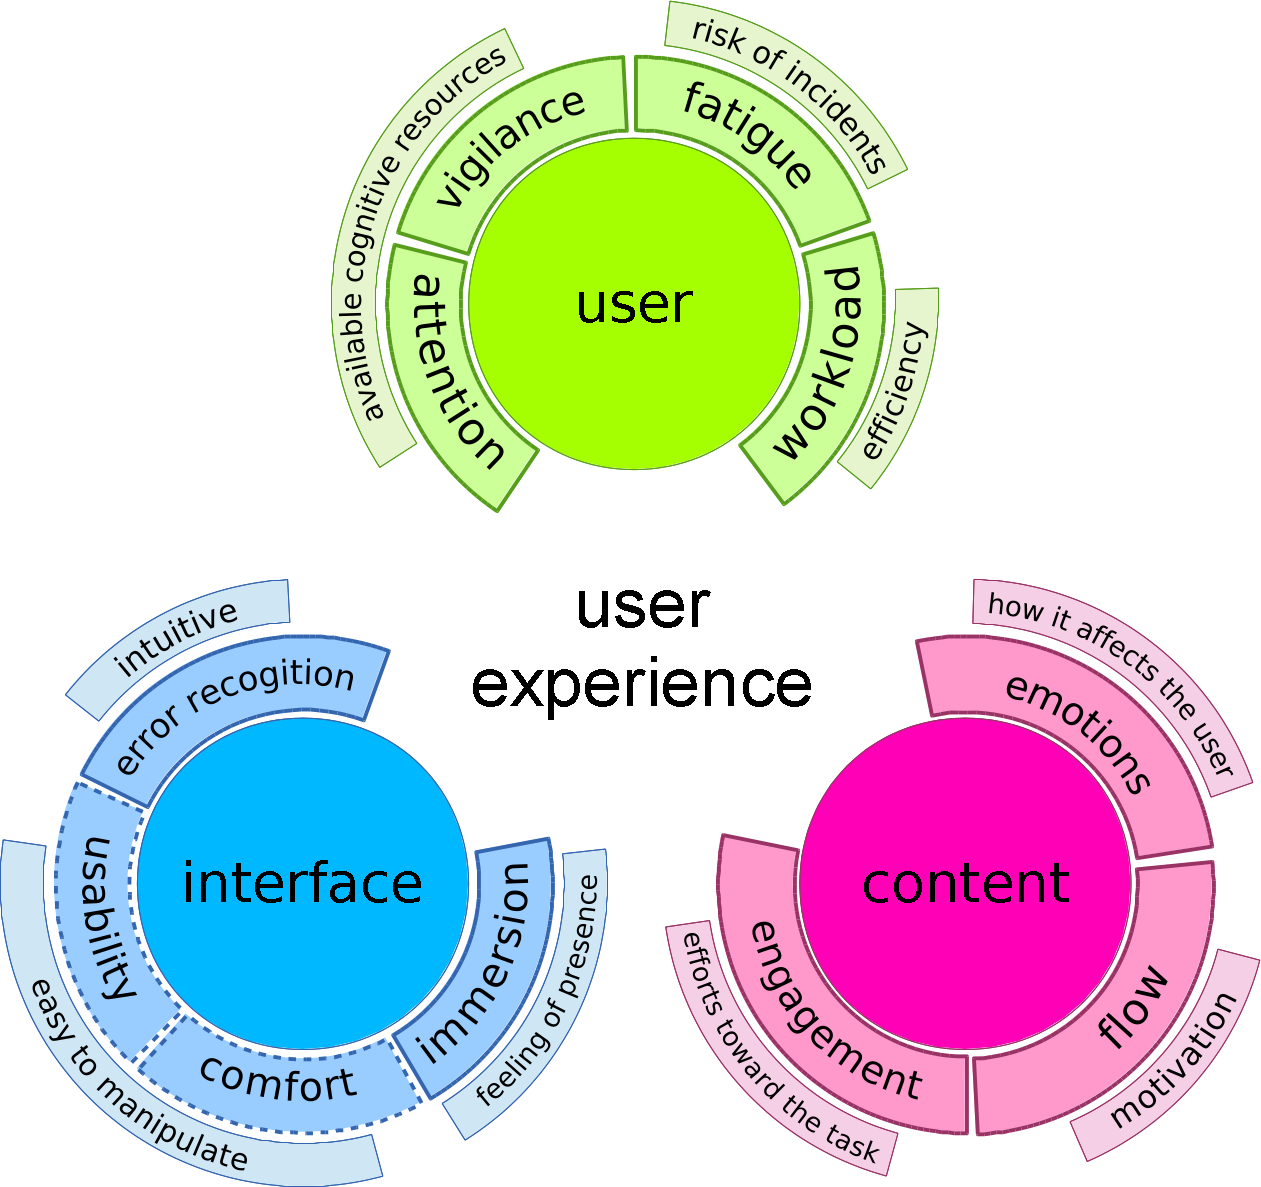
We studied workload, attention, vigilance, fatigue, error recognition, emotions, engagement, flow and immersion. Figure 2 stimulates thoughts about their relationships with HCI components. Some constructs should benefit more than the others from EEG measures: 1) workload, EEG being more sensible to changes compared to other methods [Mathan et al., 2007]; 2) attention, because event related potentials could help to anticipate how many details users register [Mustafa et al., 2012]; 3) emotions, with an arousal/valence state measured over a short time-frame [Chanel et al., 2011]. Error recognition could hardly be assessed precisely with anything but neuroimaging. Such construct highlights how innovative this evaluation method is. Among the outlined challenges, a continuous and modulated error recognition would greatly help to assess usability and comfort.
Next studies should start to combine the various constructs, along with a comprehensive framework which gathers every evaluation method, one’s advantages preventing others’ drawbacks. This should lead to an increase of the overall user experience.
REFERENCES
- Berka and Levendowski, 2007 Berka, C. and Levendowski, D. (2007). EEG correlates of task engagement and mental workload in vigilance, learning, and memory tasks. Aviat Space Environ Med., 78(5 Suppl):B231–44.
- Berta et al., 2013 Berta, R., Bellotti, F., De Gloria, A., Pranantha, D., and Schatten, C. (2013). Electroencephalogram and Physiological Signal Analysis for Assessing Flow in Games. IEEE Trans. Comp. Intel. and AI in Games, 5(2):164–175.
- Blankertz et al., 2010 Blankertz, B., Tangermann, M., Vidaurre, C., Fazli, S., Sannelli, C., Haufe, S., Maeder, C., Ramsey, L., Sturm, I., Curio, G., and Müller, K.-R. (2010). The Berlin Brain-Computer Interface: Non-Medical Uses of BCI Technology. Front Neurosci, 4(December):198.
- Boksem et al., 2005 Boksem, M. a. S., Meijman, T. F., and Lorist, M. M. (2005). Effects of mental fatigue on attention: an ERP study. Cogn Brain Res, 25(1):107–16.
- Bowman et al., 2002 Bowman, D., Gabbard, J., and Hix, D. (2002). A survey of usability evaluation in virtual environments: classification and comparison of methods. Presence-Teleop. Virt., 11(4):404–424.
- Brandt et al., 1973 Brandt, T., Dichgans, J., and Koenig, E. (1973). Differential effects of central versus peripheral vision on egocentric and exocentric motion perception. Experimental Brain Research, 491:476–491.
- Brouwer et al., 2012 Brouwer, A.-M., Hogervorst, M. a., van Erp, J. B. F., Heffelaar, T., Zimmerman, P. H., and Oostenveld, R. (2012). Estimating workload using EEG spectral power and ERPs in the n-back task. J. of neur. engin., 9(4):045008.
- Bruseberg and McDonagh-Philp, 2002 Bruseberg, A. and McDonagh-Philp, D. (2002). Focus groups to support the industrial/product designer: a review based on current literature and designers’ feedback. Applied ergonomics, 33(1):27–38.
- Chanel et al., 2011 Chanel, G., Rebetez, C., Bétrancourt, M., and Pun, T. (2011). Emotion assessment from physiological signals for adaptation of game difficulty. IEEE T Syst. Man Cy. A, 41(6):1052–1063.
- Chavarriaga and Millan, 2010 Chavarriaga, R. and Millan, J. D. R. (2010). Learning from EEG error-related potentials in noninvasive brain-computer interfaces. IEEE Trans. Neural Syst. Rehabil. Eng., 18(4):381–8.
- Damasio, 1994 Damasio, A. R. (1994). Descartes’ error: emotion, reason, and the human brain.
- Dirican and Göktürk, 2011 Dirican, A. C. and Göktürk, M. (2011). Psychophysiological measures of human cognitive states applied in human computer interaction. Procedia Computer Science, 3:1361–1367.
- Fairclough, 2009 Fairclough, S. H. (2009). Fundamentals of physiological computing. Interacting with Comp., 21(1-2):133–145.
- Ferrez and Millan, 2008 Ferrez, P. W. and Millan, J. D. R. (2008). Error-related EEG potentials generated during simulated brain-computer interaction. IEEE Trans. Biomed. Eng., 55(3):923–9.
- Fitts, 1954 Fitts, P. M. (1954). The information capacity of the human motor system in controlling the amplitude of movement. J. of experimental psychology. General, 47(6):381–391.
- Friedman, 1997 Friedman, J. (1997). On bias, variance, 0/1—loss, and the curse-of-dimensionality. Data mining and knowledge discovery, 77:55–77.
- George and Lécuyer, 2010 George, L. and Lécuyer, A. (2010). An overview of research on’passive’brain-computer interfaces for implicit human-computer interaction. In ICABB 2010.
- George et al., 2011 George, L., Lotte, F., Abad, R. V., and Lécuyer, A. (2011). Using Scalp Electrical Biosignals to Control an Object by Concentration and Relaxation Tasks: Design and Evaluation. In IEEE EMBS 2011.
- Grimes et al., 2008 Grimes, D., Tan, D., and Hudson, S. (2008). Feasibility and pragmatics of classifying working memory load with an electroencephalograph. CHI ’08, page 835.
- Hamadicharef, 2010 Hamadicharef, B. (2010). BCI literature - a bibliometric study. In ISSPA ’10, volume 1, pages 626–629. IEEE.
- Hart and Staveland, 1988 Hart, S. and Staveland, L. (1988). Development of NASA-TLX (Task Load Index): Results of empirical and theoretical research. In Human mental workload.
- Heingartner, 2009 Heingartner, D. (2009). Mental block. IEEE Spectrum, 46(1):42–43.
- Hirshfield et al., 2009 Hirshfield, L., Chauncey, K., and Gulotta, R. (2009). Combining electroencephalograph and functional near infrared spectroscopy to explore users’ mental workload. FAC ’09.
- Jankowski and Hachet, 2013 Jankowski, J. and Hachet, M. (2013). A Survey of Interaction Techniques for Interactive 3D Environments. In Eurographics ’13.
- Just et al., 2003 Just, M. A., Carpenter, P. a., and Miyake, A. (2003). Neuroindices of cognitive workload: Neuroimaging, pupillometric and event-related potential studies of brain work. Theoretical Issues in Ergonomics Science, 4(1-2):56–88.
- Kivikangas et al., 2010 Kivikangas, J. M., Ekman, I., Chanel, G., Järvelä, S., Cowley, B., Henttonen, P., and Ravaja, N. (2010). Review on psychophysiological methods in game research. Proc. of 1st Nordic DiGRA.
- Klimesch et al., 1998 Klimesch, W., Doppelmayr, M., Russegger, H., Pachinger, T., and Schwaiger, J. (1998). Induced alpha band power changes in the human EEG and attention. Neuroscience letters, 244(2):73–6.
- Kohlmorgen et al., 2007 Kohlmorgen, J., Dornhege, G., Braun, M., Blankertz, B., Müller, K.-R., Curio, G., Hagemann, K., Bruns, A., Schrauf, M., and Kincses, W. (2007). Improving human performance in a real operating environment through real-time mental workload detection. In Toward Brain-Computer Interfacing.
- Laurent et al., 2013 Laurent, F., Valderrama, M., Besserve, M., Guillard, M., Lachaux, J.-P., Martinerie, J., and Florence, G. (2013). Multimodal information improves the rapid detection of mental fatigue. Biomed. Sig. Proc. Contr., pages 1–9.
- Liu et al., 2011 Liu, Y., Sourina, O., and Nguyen, M. (2011). Real-time EEG-based emotion recognition and its applications. In Trans. comp. science, pages 256–277. Springer.
- Loggia et al., 2011 Loggia, M. L., Juneau, M., and Bushnell, M. C. (2011). Autonomic responses to heat pain: Heart rate, skin conductance, and their relation to verbal ratings and stimulus intensity. Pain, 152(3):592–8.
- Lorist et al., 2000 Lorist, M. M., Klein, M., Nieuwenhuis, S., De Jong, R., Mulder, G., and Meijman, T. F. (2000). Mental fatigue and task control: planning and preparation. Psychophysiology, 37(5):614–25.
- Mandryk et al., 2006 Mandryk, R., Inkpen, K., and Calvert, T. (2006). Using psychophysiological techniques to measure user experience with entertainment technologies. Behav. & Inf. Tech.
- Mathan et al., 2007 Mathan, S., Whitlow, S., and Feyereisen, T. (2007). WorkSense: Exploring the Feasibility of Human Factors Assessment using Electrophysiological Sensors. In 4th IACS.
- Matthews et al., 2002 Matthews, G., Campbell, S. E., Falconer, S., Joyner, L. a., Huggins, J., Gilliland, K., Grier, R., and Warm, J. S. (2002). Fundamental dimensions of subjective state in performance settings: Task engagement, distress, and worry. Emotion, 2(4):315–340.
- Milekovic et al., 2013 Milekovic, T., Ball, T., Schulze-Bonhage, A., Aertsen, A., and Mehring, C. (2013). Detection of error related neuronal responses recorded by electrocorticography in humans during continuous movements. PloS one, 8(2).
- Mühl et al., 2011 Mühl, C., Brouwer, A., van Wouwe, N., van den Broek, E. L., Nijboer, F., and Heylen, D. (2011). Modality-specific Affective Responses and their Implications for Affective BCI. In 5th Int. BCI Conf., pages 120–123.
- Mustafa et al., 2012 Mustafa, M., Lindemann, L., and Magnor, M. (2012). EEG analysis of implicit human visual perception. CHI ’12, page 513.
- Nacke et al., 2009 Nacke, L., Ambinder, M., Canossa, A., Mandryk, R., and Stach, T. (2009). Game Metrics and Biometrics: The Future of Player Experience Research. Future Play.
- Nacke and Lindley, 2009 Nacke, L. E. and Lindley, C. A. (2009). Affective ludology, flow and immersion in a first-person shooter: Measurement of player experience. J. Can. Game Stud. Ass., 3(5).
- Nacke et al., 2010 Nacke, L. E., Stellmach, S., and Lindley, C. A. (2010). Electroencephalographic Assessment of Player Experience: A Pilot Study in Affective Ludology. SAG, 42(5):632–655.
- Nieuwenhuis et al., 2001 Nieuwenhuis, S., Ridderinkhof, K. R., Blom, J., Band, G. P., and Kok, A. (2001). Error-related brain potentials are differentially related to awareness of response errors: evidence from an antisaccade task. Psychophysiology, 38(5):752–60.
- Nisbett and Wilson, 1977 Nisbett, R. E. and Wilson, T. D. (1977). Telling more than we can know: Verbal reports on mental processes. Psychological Review, 84(3):231–260.
- Ogolla, 2011 Ogolla, J. A. (2011). Usability Evaluation: Tasks Susceptible to Concurrent Think-Aloud Protocol. Master thesis, Linköping University.
- Oken et al., 2006 Oken, B. S., Salinsky, M. C., and Elsas, S. M. (2006). Vigilance, alertness, or sustained attention: physiological basis and measurement. Clin Neurophysiol, 117(9):1885–901.
- Parasuraman, 2013 Parasuraman, R. (2013). Neuroergonomics: Brain-Inspired Cognitive engineering. In The Oxford Handbook Of Cog. Engin., page 672. Oxford University Press, USA.
- Partala and Surakka, 2003 Partala, T. and Surakka, V. (2003). Pupil size variation as an indication of affective processing. International Journal of Human-Computer Studies, 59(1-2):185–198.
- Picard, 1995 Picard, R. W. (1995). Affective computing. Technical Report 321, MIT Media Laboratory.
- Pike et al., 2012 Pike, M., Wilson, M., Divoli, A., and Medelyan, A. (2012). CUES: Cognitive Usability Evaluation System. EuroHCIR ’12, pages 1–4.
- Posner et al., 2005 Posner, J., Russell, J. a., and Peterson, B. S. (2005). The circumplex model of affect: an integrative approach to affective neuroscience, cognitive development, and psychopathology. Dev. Psychopathol., 17(3):715–34.
- Ravaja, 2009 Ravaja, N. (2009). FUGA: The Fun of Gaming: Measuring the Human Experience of Media Enjoyment. Final Activity Report. Technical report.
- Saavedra and Bougrain, 2012 Saavedra, C. and Bougrain, L. (2012). Processing Stages of Visual Stimuli and Event-Related Potentials. The NeuroComp/KEOpS’12 workshop, 2:1–5.
- Schalk et al., 2000 Schalk, G., Wolpaw, J. R., McFarland, D. J., and Pfurtscheller, G. (2000). EEG-based communication: presence of an error potential. Clin. Neurophysiol., 111(12):2138–44.
- Schmidt et al., 2012 Schmidt, N. M., Blankertz, B., and Treder, M. S. (2012). Online detection of error-related potentials boosts the performance of mental typewriters. BMC neurosc., 13(1):19.
- Scholler et al., 2012 Scholler, S., Bosse, S., Treder, M. S., Blankertz, B., Curio, G., Müller, K.-R., and Wiegand, T. (2012). Toward a direct measure of video quality perception using EEG. IEEE Trans. Image Process., 21(5):2619–29.
- Shaw, 2003 Shaw, J. C. (2003). The brain’s alpha rhythms and the mind. Elsevier.
- Slater et al., 2009 Slater, M., Lotto, B., Arnold, M., and Sanchez-Vives, M. (2009). How we experience immersive virtual environments: the concept of presence and its measurement. Anuario de psicología, 40(2773):193–210.
- Sobolewski et al., 2013 Sobolewski, A., Chavarriaga, R., and Millán, J. (2013). Error Processing of Self-paced Movements. In TOBI Workshop IV, pages 137–138.
- Trachel et al., 2013 Trachel, R., Brochier, T., and Clerc, M. (2013). Enhancing visuospatial attention performance with brain-computer interfaces. CHI ’13, page 1245.
- van de Laar et al., 2013 van de Laar, B., Gürkök, H., Bos, D. P.-O., Nijboer, F., and Nijholt, A. (2013). Brain-Computer Interfaces and User Experience Evaluation. In Towards Practical Brain-Computer Interfaces, pages 223–237. Springer.
- van Erp et al., 2010 van Erp, J. B. F., Veltman, H., and Grootjen, M. (2010). Brain-Based Indices for User System Symbiosis. In Brain-Computer Interfaces, pages 201–219. Springer, London.
- Vecchiato et al., 2011 Vecchiato, G., Astolfi, L., De Vico Fallani, F., Toppi, J., Aloise, F., Bez, F., Wei, D., Kong, W., Dai, J., Cincotti, F., Mattia, D., and Babiloni, F. (2011). On the use of EEG or MEG brain imaging tools in neuromarketing research. Comput Intell Neurosci, 2011:643489.
- Vi and Subramanian, 2012 Vi, C. and Subramanian, S. (2012). Detecting error-related negativity for interaction design. CHI ’12, page 493.
- Weber, 2007 Weber, J. (2007). Think Aloud Best Practices Study.
- Zander and Kothe, 2011 Zander, T. O. and Kothe, C. (2011). Towards passive brain-computer interfaces: applying brain-computer interface technology to human-machine systems in general. J. Neural. Eng, 8(2):025005.