Signatures of infall motions in the images of the molecular emission of G31 HMC
Abstract
Although gravitational collapse is supposed to play an essential role in the star formation process, infall motions have been always elusive to detect. So far, only a few observational signatures have been commonly used to claim for the presence of infall. Often these features consist in either “blue-asymmetries” or absorption at red-shifted velocities (e.g., inverse P-Cygni profiles). Both signatures are based only on the shape of the line profile and they do not guarantee by themselves the presence of dominant infall motions. More robust “mapping signatures” can be obtained from images that angularly resolve the infalling gas. Here we present VLA observations of the ammonia inversion transitions (2,2), (3,3), (4,4), (5,5), and (6,6) towards the hot molecular core (HMC) near G31.41+0.31 that show the signatures of protostellar infall theoretically predicted by Anglada et al. (1991). The intensity of the ammonia emission is compact and sharply increases towards the centre in the blue-shifted velocity channel maps, while it shows a more flattened distribution in the red-shifted velocity channels. Additionally, the emission becomes more compact with increasing (relative) velocity for both red and blue-shifted channels. We introduce a new infall signature, the “central blue spot”, easily identifiable in the first-order moment maps. We show that rotation produces an additional, independent signature, making the distribution of the emission in the channel maps asymmetric with respect to the central position, but without masking the infall signatures. All these mapping signatures, which are identified here for the first time, are present in the observed ammonia transitions of G31 HMC.
keywords:
circumstellar matter – stars: formation – radiative transfer – ISM: individual object: G31.41+0.31 – ISM: molecules – radio lines: ISM.1 Introduction
It is believed that the star-formation process should be dominated by gravitational infall motions that accrete material from the ambient cloud into a central protostellar object. Establishing the nature of infall motions and distinguishing them from other systematic motions in the cloud are not easy tasks, and they have been the subject of many papers in the last decades. However, it is not only important to detect signatures of infall motions, but also to obtain spatially-resolved information that allows us to further investigate the kinematics and physical parameters of the molecular core around the protostar. Characterizing the infall signatures acquires special interest in the case of the formation of massive stars, where different scenarios have been proposed (merging of less massive stars, competitive accretion, or monolithic collapse; e.g., Zinnecker and Yorke 2007) and, therefore, where obtaining spatially-resolved kinematic information can help to discriminate between these scenarios.
Snell & Loren (1977) proposed as evidence of collapse the asymmetric self-reversed CO line profiles seen towards some embedded stars in dense interstellar clouds. Their modelling of a contracting cloud predicts a double-peaked CO line profile where the dip between the two peaks is red-shifted with respect to the systemic velocity of the cloud. Soon afterwards, this result was criticized by Leung & Brown (1977), who argued that the Sobolev approximation used in the Snell & Loren (1977) calculations was invalid for the velocity fields considered, and concluded that the signature was not unequivocal for collapse.
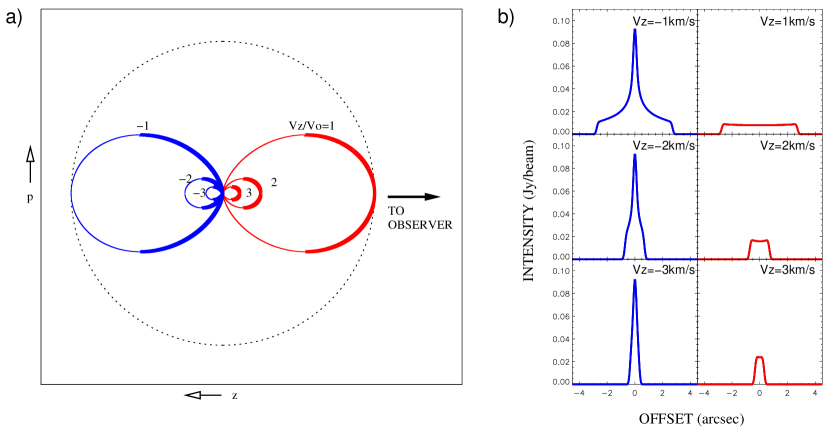
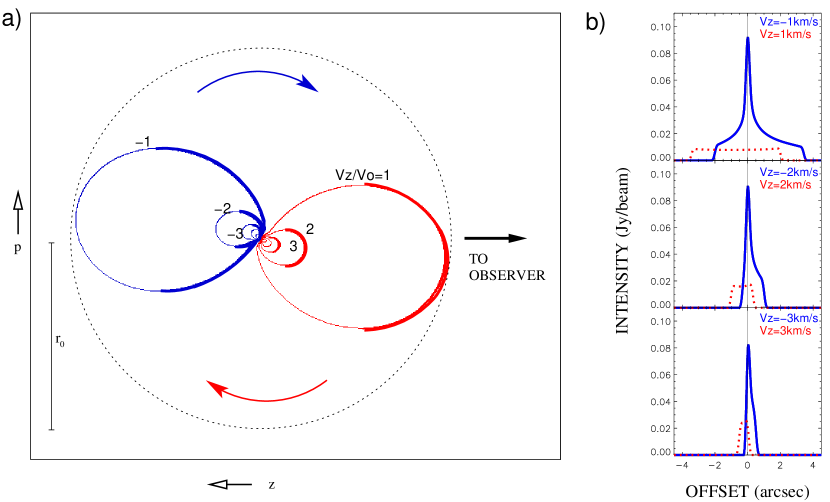
Anglada et al. (1987) studied the infall signatures of an angularly unresolved spherically symmetric protostellar core under the assumptions of optically thick line emission and gravitational infall motions dominating the kinematics over turbulent and thermal motions. Assuming that in the inside-out gravitational collapse towards a central object the velocity increases as the radius decreases, the points with the same line-of-sight (l.o.s.) velocity will form closed surfaces (isovelocity surfaces) (Kuiper et al., 1978; Anglada et al., 1987, see Fig. 1a). All the isovelocity surfaces have the same shape and decrease in size with increasing magnitude of the l.o.s. velocity. The observed flux density as a function of l.o.s. velocity (i.e., the line profile) is determined by the integrated intensity of the corresponding isovelocity surfaces. In general, a given line-of-sight intersects the same isovelocity surface twice. If the opacity is high enough, the observed emission is dominated by the emission coming from the side of the isovelocity surface facing the observer (thick line in Fig. 1a), while the emission from the rear side (thin line in Fig. 1a) remains hidden. Since in protostellar collapse the temperature increases towards the centre of the core, it turns out that the blue-shifted emission comes from points that, on the average, are closest to the protostar (and, therefore, hotter) than the corresponding red-shifted ones (see Fig. 1a). This results in asymmetric line profiles, with the blue-shifted side stronger than the red-shifted one. The assumption of a large opacity gradient allows to adopt a simple approach similar to the Sobolev approximation (see Appendix A.2 in Anglada et al. 1987), as only a very thin edge of the isovelocity surface, where physical properties are unlikely to vary significantly, would be observable. Optically thin lines would have symmetric profiles.
Zhou et al. (1993) reported observations of molecular lines towards B335 showing asymmetric line profiles with the blue side stronger than the red side. This result was considered as evidence of gravitational protostellar infall since the strengths and profiles of the observed lines were in agreement with the predictions of the inside-out collapse model of Shu (1977). Since then, numerous surveys have been carried out and “blue asymmetries” in line profiles have been extensively interpreted as infall signatures (e.g., Gregersen et al. 1997; Mardones et al. 1997; Lee et al. 2001; Fuller, Williams, & Sridharan 2005; Chen et al. 2010), although in most cases a detailed comparison with the predictions of a self-consistent collapse model has not been performed. In several cases, inverse P-Cygni profiles have been observed in molecular lines against a background bright HII region (e.g., Keto, Ho, & Haschick 1987, 1988; Ho & Young 1996; Zhang & Ho 1997; Zhang et al. 1998) or against the bright dust continuum emission of the hot protostellar core itself (e.g., Di Francesco et al. 2001; Girart et al. 2009). These red-shifted absorption features are indicative of red-shifted motions of foreground gas and, along with additional evidence, have been interpreted as infall motions of the surrounding envelope.
However, the “spectral signatures” of infall are mostly based on the line profile of the overall observed emission, and do not provide enough information on the spatial structure of the source. So, other scenarios such as rotation, outflow, intrinsic asymmetries in the source, or the relative motion of unbound clouds are capable of causing similar features. A more complete information can be obtained from “mapping signatures” in images that angularly resolve the source. The use of centroid velocity maps, that give some spatial information, has been proposed to identify rotation signatures (e.g., the so-called “blue bulge” signature) in infalling cores (e.g., Adelson & Leung 1988; Narayanan et al. 1998) but in this case the shape of the line profile is not taken into account, resulting in an incomplete information on the kinematic and physical structure of the core.
A more simple and complete mapping signature of infall can be obtained from images that angularly resolve the emission as a function of velocity. Anglada et al. (1991) (hereafter A91) investigated the signatures of infall in the images obtained from molecular line observations. These authors calculated the predicted intensity maps for different l.o.s. velocities (channel maps) following the same assumptions considered in Anglada et al. (1987). The intensity map at a given l.o.s. velocity results from the emission of the corresponding isovelocity surface and, if the opacity is high enough, it is in fact an image of the excitation temperature distribution in the side of this isovelocity surface facing the observer. For red-shifted channels, the centre of the image corresponds to a region that is slightly farther away from the centre of the core (and, thus, colder) than the edges (Fig. 1a). Conversely, for blue-shifted channels, the centre of the image corresponds to the emission from a region very close to the centre of the core (and, therefore, very hot). This produces very different images in red-shifted and blue-shifted channels. In the image of a red-shifted channel, the intensity is almost constant over the emitting region, decreasing slightly towards the centre, while in the corresponding blue-shifted channel the intensity increases sharply towards the centre of the image (see Fig. 1b). Additionally, since the size of the isovelocity surfaces decreases with increasing (relative) velocity, the emission becomes more compact at higher (relative) velocities for both, red- and blue-shifted channels. The detectability of these infall signatures depends strongly on the beam to source size ratio since one needs to resolve angularly the infalling gas for this purpose.
Here we present evidence of the signatures proposed by A91, as well as additional infall and rotation mapping signatures in the hot molecular core (HMC) close to the ultra-compact HII (UCHII) region G31.41+0.31 (hereafter G31 HMC). HMCs are small, dense, hot molecular clumps usually found in the proximity of UCHII regions, and are believed to trace one of the earliest observable stages in the life of massive stars. G31 HMC, located at a distance of 7.9 kpc (Cesaroni et al. 1998), is one of the hottest molecular cores discovered so far, and it probably harbours an O type protostar. It exhibits strong ammonia emission of high excitation transitions (Churchwell, Walmsley, & Cesaroni 1990; Cesaroni, Walmsley, & Churchwell 1992; Cesaroni et al. 1998), making G31 HMC one of the few sources where a high signal-to-noise ratio analysis of the spatially resolved molecular emission can be attempted. Cesaroni et al. (2010) reported a double radio continuum source towards the centre of the ammonia core, that could trace the two jet lobes from a single central protostar or a binary system. Infall motions in G31 HMC have already been inferred by Girart et al. (2009) through the detection of an inverse P-Cygni profile against the bright dust emission peak. Osorio et al. (2009) carried out a detailed modelling of the source. This model, which consists of a spherical envelope collapsing onto an O type star, is able to reproduce the observed spectral energy distribution (SED) of the source as well as the spectra of the ammonia (4,4) transition obtained in the subarcsecond angular resolution VLA observations carried out by Cesaroni et al. (1998). In this paper we present new, high angular resolution VLA observations of the (2,2) to (6,6) ammonia transitions that reveal clear differences between the red- and blue-shifted channel maps. In Section 2 we describe our observations. In Section 3 we compare the observational results with those of the simple model of protostellar infall by A91 and with those of the more detailed modelling of G31 HMC by Osorio et al. (2009); we introduce an additional infall signature (the “central blue spot”), easily identifiable in the first-order moment maps; and we study the rotation signatures in the spatial intensity profiles, and their presence in G31 HMC. In Section 4 we give our conclusions.
2 Observations
Observations of the ammonia (2,2), (3,3), (5,5) and (6,6) inversion transitions were carried out on 2009, March 1 and 3, with the VLA of the NRAO111The National Radio Astronomy Observatory is a facility of the National Science Foundation operated under cooperative agreement by Associated Universities, Inc. in the B-configuration (VLA Project Code: AM981) providing an angular resolution of . The phase centre was set to RA(J2000) = ; DEC(J2000) = . We used the 4IF correlator mode with a bandwidth of 6.25 MHz (80 km s-1) and 31 channels of 195 kHz (2.4 km s-1) width each, plus a continuum channel that contains the central 75 per cent of the total bandwidth. This configuration allowed us to observe two inversion transitions simultaneously. To make sure that at least the main line and one pair of satellites fall within the observational bandwidth we centred the observation at a velocity in between the main line and the inner red-shifted satellite line.
Phase, flux and bandpass calibrators were 1851+005, 3C286, and 1773-130 respectively. Pointing corrections were derived from X-band observations for all the calibrators and applied on-line. At the time of the observations, the VLA interferometer was going through a transition period to turn into the EVLA and 20 out of 27 antennas at that time were already EVLA antennas while the rest remained VLA antennas. The frequencies for the NH3(5,5) and NH3(6,6) inversion lines fell very close to the edge of the bandwidth of the VLA receivers and only the EVLA antennas were used for these two transitions. For the NH3(2,2) and NH3(3,3) inversion lines both EVLA and VLA antennas were used.
Due to the narrowness of the bandwidth used, and because lines in this source are extremely broad, line-free channels were not enough to subtract the continuum properly and additional continuum observations (VLA Project Code: AM994) were carried out on 2009, May 16 for this purpose. In this continuum observation we used the same flux and phase calibrators as in the line observations.
We also analysed VLA archival data of the NH3(4,4) transition taken in the A configuration (VLA Project Code: AC748; Cesaroni et al. 2010). These observations were carried out on 2004, October 15, 23, and November 5, using the Fast Switching technique with a 80/40 sec source-calibrator cycle. The bandwidth was 12.5 MHz (160 km s-1), with a channel width of 195 kHz (2.4 km s-1).
For all the transitions, data editing and calibration were carried out using the Astronomical Image Processing System (AIPS) package of NRAO following the standard high-frequency VLA procedures. We also followed the advice provided by the NRAO for observations with mixed EVLA and VLA antennas. Continuum was subtracted using the task UVSUB of AIPS. This correction was important only towards the position of the UCHII region and was negligible towards the HMC. Maps were obtained with natural weighting and were restored with a circular beam. For the (4,4) transition, that was observed in the A configuration, maps were obtained using a tapering of 1300 k to improve the signal-to-noise ratio. The observational set-up for all the line observations is summarized in Table 1.
| Rest | Spectral | Synthesized | |||||
|---|---|---|---|---|---|---|---|
| Transition | VLA | Antennaa | Frequency | Bandwidth | Resolution | Beamb | rms |
| (,) | Configuration | Type | (GHz) | (MHz) | (km s-1) | (′′) | (mJy beam-1) |
| (2,2) | B | VLA(7)/EVLA(20) | 23.7226333 | 6.25 | 2.468 | 0.33 | 0.7 |
| (3,3) | B | VLA(7)/EVLA(20) | 23.8701292 | 6.25 | 2.453 | 0.33 | 0.7 |
| (4,4) | A | VLA(27) | 24.1394163 | 12.5 | 2.426 | 0.16c | 0.5 |
| (5,5) | B | EVLA(20) | 24.5329887 | 6.25 | 2.386 | 0.37 | 0.9 |
| (6,6) | B | EVLA(20) | 25.0560250 | 6.25 | 2.337 | 0.34 | 1.0 |
aNumbers in parenthesis indicate the number of antennas of either type.
bHPBW of the circular restoring beam.
cInterferometric visibilities have been tapered to increase the signal-to-noise ratio.
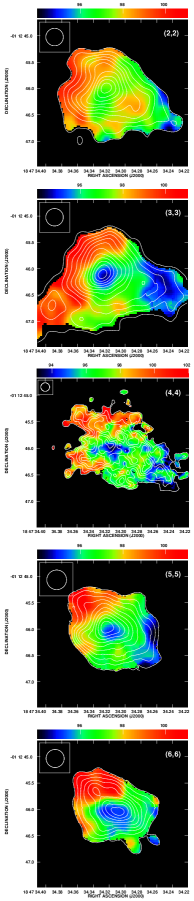
In Fig. 2 we show an overlay of the maps of the zero-order moment (integrated intensity) and first-order moment (intensity weighted mean velocity) of the observed ammonia (2,2), (3,3), (4,4), (5,5), and (6,6) main line emission.
3 Results and discussion
We detected ammonia emission in all the five observed transitions. This is the first interferometric detection of the ammonia (3,3), (5,5), and (6,6) transitions in this source. In the maps (Fig. 2), the ammonia emission appears as a compact condensation, clearly associated with the double radio continuum source (angular separation = ) reported by Cesaroni et al. (2010). The peak brightness temperatures are 100-150 K for all the observed ammonia transitions, similar to the values obtained previously for the (4,4) transition (Cesaroni et al., 1998, 2010). The emission of the main line is optically thick in the five transitions studied, with satellite to main line intensity ratios close to unity. Lines are extremely broad ( 13 km s-1), so that the inner and outer satellite lines blend together even for the (2,2) transition, where the separation in velocity between satellite lines is 9 km s-1. In this paper we present an analysis of the intensity as a function of the projected distance to the core centre (which we call as “spatial intensity profile”), in order to identify possible differences between red-shifted and blue-shifted channels. A more extensive analysis of the observations will be presented in a future paper (Mayen-Gijon et al. in preparation).
3.1 Spatially resolved infall signatures
3.1.1 Spatial intensity profiles
To search for the spatially resolved infall signatures (see section 1) we need to compare the observed intensity as a function of distance to the centre of the core for pairs of velocity channels symmetrically located at both sides of the systemic velocity. In order to improve the signal-to-noise ratio, for every channel map we averaged the emission of the main line over circular annuli of different radii and 015 width, and then we plotted the average intensity as a function of the radius. The centre was chosen to be at RA(J2000) = ; DEC(J2000) = , which corresponds to the position of the peak of the integrated emission of the ammonia (6,6) satellite lines. We have chosen the position of the satellite lines of the (6,6) transition because they have the lowest opacity and highest excitation among the observed lines, so they can penetrate further inside the core, and may trace better the warmer gas, close to the central heating object. Our chosen central position lies roughly in between the positions of the two embedded radio continuum sources detected by Cesaroni et al. (2010), which are separated .
The systemic velocity of the cloud is not accurately determined. In the literature we find velocities ranging from 96.24 km s-1 (Beltrán et al. 2005; from ground state CH3CN (1211) observations) to 98.8 km s-1 (Cesaroni et al. 1994, from low resolution NH3(4,4) observations). We have adopted the value of VLSR=97.4 km s-1 from the interferometric data of Beltrán et al. (2005), obtained by fitting simultaneously several K components of the CH3CN (5-4) transition.
As the original purpose of the observations presented here was not to search for infall signatures, they were not designed adequately for this study. The spectral resolution is poor ( 2.4 km s-1) and the observations of the different transitions were not centred exactly at the same velocity. Thus, we cannot obtain pairs of velocity channels that are exactly symmetric in velocity with respect to the rest velocity of the cloud, which hinders an accurate comparison of red- and blue-shifted channel pairs. As our best approximation, we have compared channel pairs with the most similar velocity shifts with respect to the assumed systemic velocity of the cloud. Given the uncertainty in this central velocity and the large channel widths ( km s-1), in order to ensure that we are comparing emission with different velocity signs (i.e., red vs. blue) we have excluded the channel pair closest ( km s-1) to the systemic velocity.
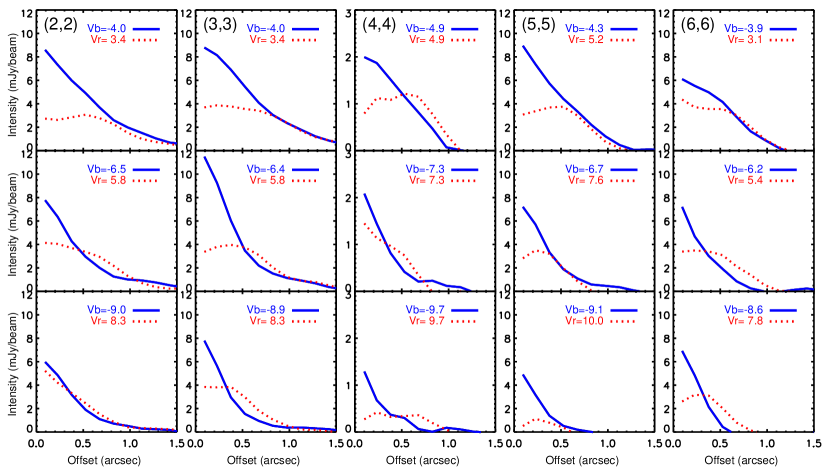
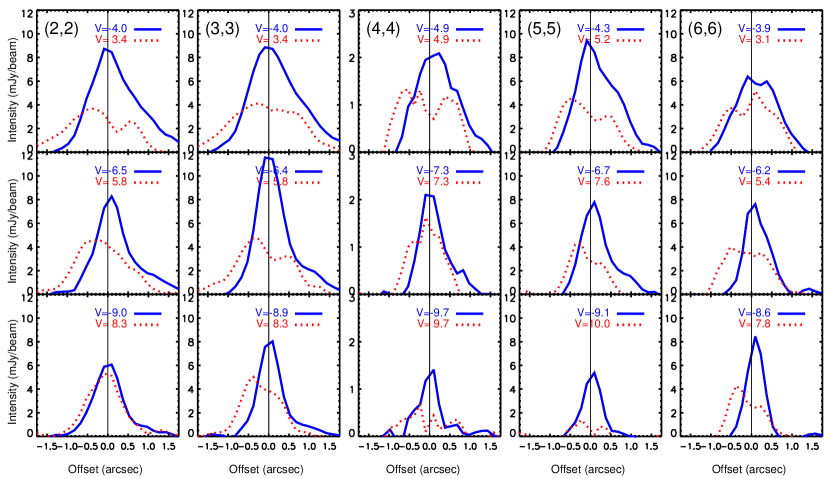
Fig. 3 shows the observed intensity as a function of the projected distance to the core centre for blue-shifted (blue continuous lines) and red-shifted (red dotted lines) velocity channels of the ammonia (2,2), (3,3), (4,4), (5,5) and (6,6) main lines. The main lines of all these transitions are certainly optically thick (as indicated by the main to satellite line ratio that is close to unity), and a pattern is clearly identifiable in the images of all the observed transitions. For each pair of blue/red channels, the intensity of the blue-shifted channel is stronger, and increases more sharply towards the centre, than in the corresponding red-shifted channel, where the intensity distribution is flatter. Moreover, as the velocity increases with respect to the systemic velocity, the emission becomes more compact (a narrower spatial intensity profile). This behaviour is in agreement with the expected mapping signatures of infall for angularly resolved sources described by A91 (see above, and Fig. 1), suggesting that gravitational infall motions strongly contribute to the kinematics of the G31 HMC. Since the satellite lines appear to be also optically thick (at least for the lowest excitation transitions), similar signatures would be expected in the satellite line channel maps. Unfortunately, because of blending between satellite lines due to the large line widths, a similar analysis cannot be carried out for the satellite emission.
To confirm the presence of these infall signatures more quantitatively, we compare our observational results with the predictions of the model for G31 HMC developed by Osorio et al. (2009). These authors modelled G31 HMC as a spherically symmetric envelope of dust and gas that is collapsing onto a recently formed massive star ( 25 M⊙) that is undergoing an intense accretion phase ( M⊙ yr-1). The envelope consists of an inner, infalling region ( au) that is surrounded by a static part ( au). The density and velocity structure of the envelope are obtained from the solution of the dynamical collapse of a singular logatropic sphere. The stellar radiation ( L⊙) and the accretion luminosity ( L⊙) provide the source of heating of the envelope, whose temperature as a function of the distance to the centre is self-consistently calculated from the total luminosity. The excitation and absorption coefficient of the ammonia transitions are calculated according to the physical conditions along the envelope, and the radiative transfer is performed in order to obtain the emerging ammonia spectra. The parameters of the model are determined by fitting the observed spectral energy distribution (SED) and the VLA B-configuration NH3(4,4) line spectra obtained in the observations of Cesaroni et al. (1998) that angularly resolve the source. Fig. 4 shows the intensity predicted by the G31 HMC model as a function of the projected distance to the core centre, for different pairs of blue/red-shifted channels of the ammonia (2,2) to (6,6) main lines. The angular and the spectral resolutions have been set equal to those of the observations.
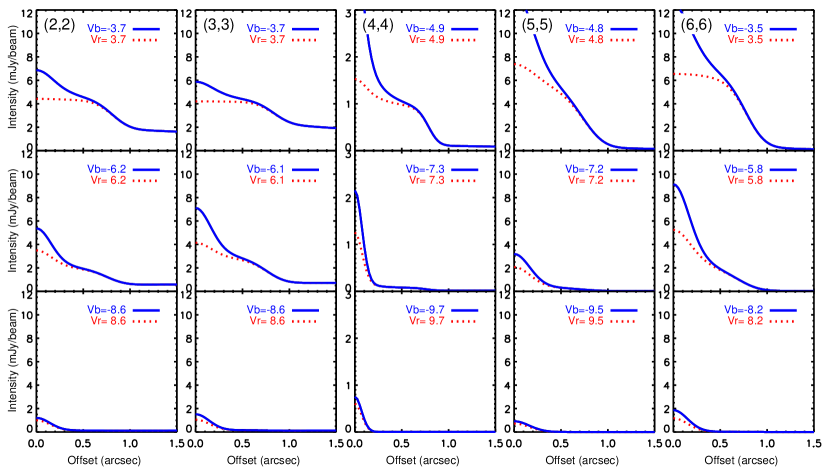
As can be seen from Fig. 4, the spatial intensity profiles predicted by the model of G31 HMC developed by Osorio et al. (2009) show the basic signatures of spatially resolved infall proposed by A91 from a simplified, general treatment of protostellar infall. The spatial intensity profiles of the blue-shifted channels are centrally peaked, while those of the red-shifted channels are flatter; and the emission in both red- and blue-shifted channels becomes more compact as the relative velocity increases. Furthermore, by comparing Figs. 3 and 4 we note that there is a remarkable quantitative agreement between the observations of G31 HMC and the model of this source, as the shape and range of values are similar in the observed and modelled spatial intensity profiles. Thus, we conclude that the general infall signatures described by A91 are present in G31 HMC, suggesting that infall motions have a significant contribution to the kinematics of this source. The quantitative agreement with the predictions of a specific model for G31 HMC indicates that these signatures are sensitive to the physical properties (in particular, the kinematics and temperature profile) of the source and, therefore, that in principle they can be used to verify and/or improve source models.
Although there is a general agreement, the precise shape of the predicted and observed intensity profiles are not fully coincident. For example, at high velocities (relative to rest) the model emission is in general weaker and more compact than observed (bottom panels in Figs. 3 and 4). Some of the discrepancies could be due to the fact that the pairs of velocity channels extracted from the observations are not exactly symmetric in velocity because of the large channel widths and the uncertainty in the central velocity. Observations with higher spectral resolution of optically thick lines, combined with additional observations of optically thin lines (to accurately determine the central velocity) are required to better study the trends presented here. Presence of rotation and outflow motions (e.g., Cesaroni et al. 2011) and, in general, departures from spherical symmetry, that are not considered in the modelling of Osorio et al. (2009) (e.g., the presence of a central binary), could affect the infall signatures, and account for some of the observed differences. In Section 3.2 we will examine the effects of rotation on the spatial intensity profiles.
We want to stress that G31 HMC is an exceptional source, with very strong molecular ammonia emission, making it possible to identify for the very first time spatially resolved infall signatures in molecular emission. The advent of large interferometers with improved sensitivity, such as ALMA, should make it possible to extend this kind of studies to a large number of sources in the near future.
3.1.2 The central blue spot
The infall signatures in the spatial intensity profiles produce an additional signature in the first-order moment (intensity weighted mean velocity, equivalent to a centroid velocity map). This signature is easily identifiable, and consists in a compact spot of blue-shifted emission towards the peak of integrated intensity (zero-order moment) of the source. This spot of blue-shifted emission is a consequence of the differences in intensity and spatial distribution of the emission in the red- and blue-shifted channels. As explained in Section 1 and illustrated in Fig. 1, the emission near the edges of the emitting region has a similar intensity in the pairs of red- and blue-shifted velocity channels that are symmetrically located with respect to the systemic velocity of the cloud. However, while the intensity distribution remains almost flat in the red-shifted channels, it rises sharply towards the centre in the blue-shifted channels. As a consequence, the intensity-weighted mean velocity towards the central region will appear blue-shifted because of the higher weight of the strong blue-shifted emission. Additionally, the integrated intensity (zero-order moment) will peak towards the central position. As one moves away from the centre the integrated intensity decreases, the blue and red-shifted intensities become similar, and the intensity-weighted mean velocity approaches the systemic velocity of the cloud. Therefore, the first-order moment of an infalling envelope is expected to be characterized by a compact spot of blue-shifted emission towards the position of the zero-order moment peak. We will designate this infall signature the “central blue spot”.
The “central blue spot” will appear overlapped with other possible velocity gradients (e.g., due to rotation) that may be present in the first-order moment of the source. This is the case of G31 HMC where the first-order moment (Fig. 2) shows both a velocity gradient from NE to SW, and a spot of blue-shifted emission towards the peak of the zero-order moment. The velocity gradient suggests rotation with a PA . The clear detection of the “central blue spot” signature in G31 HMC indicates that infall motions play a fundamental role in the gas kinematics of this source. As can be seen in Fig. 2, the blue spot signature is present in all the observed ammonia transitions, confirming that its detection is a robust result. It is less evident in the (2,2) transition, probably because this transition has a larger contribution from outer, colder gas.
We note that the opacity is expected to decrease in the central part of the blue-shifted emitting region (see Appendices A and C of Anglada et al. 1987). This can reduce the degree of asymmetry and partially erase the blue spot signature in molecular transitions of moderately high optical depth. The observations and modelling suggest that this is not the case in G31 HMC.
We also note that the “central blue spot” infall signature is related to the “blue bulge” signature introduced by Walker, Narayanan, & Boss (1994), who realized that in the centroid velocity map of a source with a rotation velocity gradient, the blue-shifted contours cross the rotational axis into the side that would otherwise correspond to red-shifted emission. The “blue bulge” signature is interpreted as a consequence of the overall asymmetry between blue- and red-shifted emission produced by infall motions. The “central blue spot” signature introduced here traces specifically the sharp increase in the degree of asymmetry between the blue- and red-shifted intensities as one moves towards the centre, which produces a central compact blue spot. The “blue bulge” signature is also visible in our data. Fig. 2 shows that, for all the observed transitions, part of the blue-shifted emission (the emission shown in green color in the figure) extends to the NE and penetrates into the side that would otherwise correspond to red-shifted emission.
3.2 On the effects of rotation
As can be seen in Fig. 2, the first-order moment (intensity weighted mean velocity) of the ammonia emission in G31 HMC shows a clear velocity gradient in the SW-NE direction, with average velocities preferentially blue-shifted in the SW side and preferentially red-shifted in the NE side of the source. This velocity gradient has been previously reported by other authors using several molecular transitions (e.g., Beltrán et al. 2004; Gibb et al. 2004; Cesaroni et al. 2011), and has been attributed either to rotation or to a bipolar outflow. In order to properly interpret the G31 HMC results, in the following we will discuss which are the expected rotation signatures in the spatial intensity profiles, and how they affect the infall signatures discussed in the previous sections.
To analyse the case of an infalling rotating envelope, and to compare it with the non-rotating case, we have considered a system with properties similar to those of the example described in A91 (Fig. 1), but with the velocity field given by the TSC (Terebey, Shu, & Cassen 1984) prescription. The TSC formalism provides a generalised solution of the problem of the spherical collapse of a singular isothermal sphere (Shu 1977) that includes the effects of an initially uniform and slow rotation. In the TSC velocity field (equations 88-90 of Terebey, Shu, & Cassen 1984), not only radial but also azimuthal and polar velocity components are present. As a consequence, matter does not fall radially onto the central protostar, but settles into a centrifugally supported disk around it (Terebey, Shu, & Cassen 1984; Shu, Adams, & Lizano 1987). In the inner region of the infalling envelope (near the centrifugal radius), the magnitude of rotation and infall velocities tend to equal, and the density adopts a flattened configuration towards the equatorial plane. At larger radii (much larger than the centrifugal radius), the density law tends to the free-fall form solution with nearly radial streamlines.
Fig. 5a shows the contours of equal l.o.s. velocity of the TSC velocity field close to the equatorial - plane, for the example considered. The TSC isovelocity contours are closed curves with sizes similar to those of radial infall shown in Fig. 1a. However, in radial infall all the isovelocity contours are aligned and axially symmetric with respect to the line-of-sight towards the centre, while the TSC isovelocity contours are asymmetric with respect to this line-of-sight, and they appear somewhat distorted. The axis going from the centre of the core to the vertex (the point more distant from the centre) of the TSC isovelocity contours is rotated with respect to the line-of-sight. The angle of rotation of this axis increases from the outer (lower) isovelocity contours to the inner (higher) isovelocity contours where it reaches . This is because in the TSC formalism the rotation velocity is small in the outer parts of the infalling region, that behave almost as free-fall, while in the proximity of the centrifugal radius, in the equatorial plane, it becomes comparable to the radial component.
Following the simplified analysis of A91, that assumes a high enough optical depth, the intensity map at a given l.o.s. velocity is, in fact, an image of the excitation temperature distribution in the side facing the observer of the corresponding isovelocity surface. Since the axes of the TSC isovelocity surfaces are misaligned with respect to the line-of-sight, the observer will see an asymmetric source in each velocity channel. In the example considered (Fig. 5), the emission in the red-shifted channels will be more extended in the eastern side (negative offsets) and more compact in the western side (positive offsets), while in the blue-shifted channels the emission will appear more extended in the western side and more compact in the eastern side. Thus, the spatial intensity profiles will be asymmetric as illustrated in Fig. 5b, where we show the spatial intensity profile along the equatorial direction, for different velocity channels. As in the non-rotating case, the images in blue-shifted channels present centrally peaked intensity distributions, while the red-shifted channels present flatter intensity distributions; and the emission becomes more compact with increasing l.o.s. velocity. Then, the main difference with respect to the non-rotating case is the opposite asymmetry, with respect to the central position, of the red- and blue-shifted pairs of velocity channels.
It can be shown that the asymmetries inferred from the velocity field of the TSC collapse are a general property of the rotating infalling envelopes. Let us consider a given isovelocity surface in an infalling and rotating cloud (in the following descriptions, we consider velocities relative to the systemic velocity of the cloud). If rotation was absent (pure radial infall, as described in Section 1) the isovelocity surface considered, which would correspond to a sole l.o.s. infall velocity, would be symmetric with respect to any plane containing the centre of the core. However, rotation will produce l.o.s. velocity components of opposite sign at both sides of the rotation axis that, together with the l.o.s. infall component, will contribute to the total l.o.s. velocity. On the side where the l.o.s. rotation and infall velocities have the same sign (left side for the red-shifted channels or right side for the blue-shifted channels, as seen from the observer in Fig. 5a) rotation increases the magnitude of the total l.o.s. velocity. Thus, a contribution of the infall component smaller than in the case of no rotation would be required to obtain the same total l.o.s. velocity considered. Infall isovelocity surfaces are nested like matryoshka dolls, with decreasing magnitude of the l.o.s. infall velocity in the outer, larger surfaces (Fig. 1a); therefore, this side of the isovelocity surface considered will consist of points located at outer positions with respect to the case of pure radial infall. On the other hand, on the side where l.o.s. rotation and infall velocities have opposite sign, a larger contribution of the infall component will be required to compensate the decrease in the magnitude of total l.o.s. velocity produced by rotation. Therefore, on this side, the isovelocity surface considered will consist of points closer to the centre (higher magnitude of the l.o.s. infall velocity) than in the case of pure radial infall. In summary, the observed emission at a given l.o.s. velocity from a collapsing and rotating cloud will be asymmetric with respect to the rotation axis, being more extended on the side where rotation and infall velocity components have the same sign and more compact on the opposite side. Likewise, the spatial intensity profiles are stretched on the side where the channel and rotation velocities are both red-shifted or both blue-shifted while they are shrunk on the opposite side.
It should also be noted that the set of spatial intensity profiles for different velocity channels is actually equivalent to a position-velocity (P-V) diagram. However, in a conventional P-V diagram the spatially resolved infall signatures are usually more difficult to identify.
To study whether the rotation signatures discussed above are in qualitative agreement with what is observed in G31 HMC, we obtained the average intensity of the ammonia main line as a function of projected distance to the centre (ring-averaged values, as in Section 3.1, to increase the signal-to-noise ratio), but we calculated this intensity separately in the half of the source that rotation shifts to the blue (SW) and in the half that rotation shifts to the red (NE). From Fig. 2 we infer that the rotation axis (i.e., the angular momentum of the core) has a PA . So, for every observed velocity channel, we obtained the average intensity over half-annuli of different radii corresponding to the NE () and SW () halves of the source. In Fig. 6 we plotted the resulting intensity profiles for different velocity channels of the observed ammonia transitions. As can be seen in the figure, the intensity profiles show the general trends predicted for a rotating collapsing core: (i) The spatial intensity profiles of the blue-shifted channels sharply increase towards the centre, while those of the red-shifted channels are flatter; (ii) The profiles become more narrow as the magnitude of the infall velocity increases; (iii) The intensity profiles are asymmetric with respect to the central position, being the NE part (negative offsets) in the red-shifted channels more extended than the SE part (positive offsets), while the opposite is true for the blue-shifted channels. This behaviour is in agreement with what is expected for an infalling source with clockwise rotation (as seen from north).
It should be noted that, so far, we only have constructed a spherically symmetric model for G31 HMC (Osorio et al. 2009); therefore, we can only evaluate the effects of rotation in a qualitative way. We are working on an integral modelling of the source, where the observational data are fitted to an infalling rotating envelope, whose results will be presented elsewhere (Mayen-Gijon et al., in preparation).
Thus, we conclude that spatially resolved rotation and infall signatures can be identified in the images of the molecular ammonia emission of G31 HMC. It is important to note that rotation does not mask the mapping signatures of infall proposed by A91, but just modifies these signatures by making the spatial intensity profiles asymmetric.
4 Conclusions
We found that the high angular resolution images of the ammonia (2,2), (3,3), (4,4), (5,5), and (6,6) inversion transitions in G31 HMC present the mapping signatures of gravitational infall predicted by A91: (i) Given a pair of red/blue-shifted channels at symmetric velocities with respect to the systemic velocity of the cloud, in the blue-shifted channels the intensity as a function of projected distance to the core centre is stronger and sharply increases towards the centre, while the red-shifted channels show a flatter intensity distribution; (ii) The emission becomes more compact as the velocity increases with respect to the systemic velocity of the cloud.
We introduced a third mapping signature of infall, that we call the “central blue spot”, consisting in a spot of blue-shifted emission in the first-order moment towards the position of the zero-order moment peak. We found that the central blue-spot infall signature is also present in all the observed ammonia transitions of G31 HMC. These three signatures are robust infall signatures that, to our knowledge, have been observationally identified here for the first time. These signatures cannot be easily mimicked by other motions, and indicate that infall motions play a fundamental role in the gas kinematics of G31 HMC.
There is a good quantitative agreement, both in the shape and range of values, between the spatial intensity profiles predicted by the model for G31 HMC developed by Osorio et al. (2009) and those observed in the channel maps of the ammonia (2,2) to (6,6) inversion transitions. This is particularly remarkable, as only the SED and (4,4) transition data were used in fitting the model parameters.
We studied how rotation affects the spatial intensity profiles of an infalling envelope. We concluded that the rotation signature makes the spatial intensity profiles asymmetric with respect to the central position but it does not mask the A91 infall signatures. The spatial intensity profile of the image in a given velocity channel (red- or blue-shifted) is stretched towards the side where rotation has the same sign (red- or blue-shifted, respectively), and it is shrunk on the opposite side. These rotation signatures are present in the spatial intensity profiles of the images of the ammonia transitions observed in G31 HMC.
In summary, G31 HMC shows a quantitative agreement with the A91 infall signatures, it presents the “central blue spot” infall signature, and shows a qualitative agreement with the signatures expected in a rotating infalling envelope.
G31 HMC is an exceptional source because of its strong ammonia emission that allowed us to identify these infall signatures for the first time. However, with the advent of new and improved high angular resolution facilities, it will become possible to identify these signatures in more sources. This kind of observations, combined with a detailed modelling, can be used to determine the kinematic properties of infalling protostellar envelopes.
Acknowledgments
JMM-G, GA, MO, and JFG acknowledge support from MICINN (Spain) AYA2008-06189-C03-01 and AYA2011-30228-C03-01 grants (co-funded with FEDER funds). SL acknowledges support from PAPIIT-UNAM IN100412. We thank the referee, Eric Keto, for his valuable comments. We would like to thank Riccardo Cesaroni for his advise in the reduction of the ammonia (4,4) data.
References
- Adelson & Leung (1988) Adelson, L. M., & Leung, C. M. 1988, MNRAS, 235, 349
- Anglada et al. (1987) Anglada, G., Rodríguez, L. F., Cantó, J., Estalella, R., & López, R., 1987, A&A, 186, 280
- Anglada et al. (1991) Anglada, G., Estalella, R., López, R., Rodríguez, L.F., & Cantó, J., 1991, A&A, 252, 639 (A91)
- Beltrán et al. (2004) Beltrán M. T., Cesaroni R., Neri R., Codella C., Furuya R. S., Testi L., Olmi L., 2004, ApJ, 601, L187
- Beltrán et al. (2005) Beltrán, M. T., Cesaroni, R., Neri, R., et al. 2005, A&A, 435, 901
- Cesaroni, Walmsley, & Churchwell (1992) Cesaroni R., Walmsley C. M., Churchwell E., 1992, A&A, 256, 618
- Cesaroni et al. (1994) Cesaroni, R., Churchwell, E., Hofner, P., Walmsley, C.M., Kurtz, S. 1994, A&A, 288, 903
- Cesaroni et al. (1998) Cesaroni, R., Hofner, P., Walmsley, C. M., & Churchwell, E. 1998, A&A, 331,709
- Cesaroni et al. (2010) Cesaroni, R., Hofner, P., Araya, E., & Kurtz, S. 2010, A&A, 509, A50
- Cesaroni et al. (2011) Cesaroni, R., Beltrán, M. T., Zhang, Q., Beuther, H., & Fallscheer, C. 2011, A&A, 533, A73
- Chen et al. (2010) Chen X., Shen Z.-Q., Li J.-J., Xu Y., He J.-H., 2010, ApJ, 710, 150
- Churchwell, Walmsley, & Cesaroni (1990) Churchwell E., Walmsley C. M., Cesaroni R., 1990, A&AS, 83, 119
- Di Francesco et al. (2001) Di Francesco, J., Myers, P. C., Wilner, D. J., Ohashi, N., & Mardones, D. 2001, ApJ, 562, 770
- Fuller, Williams, & Sridharan (2005) Fuller G. A., Williams S. J., Sridharan T. K., 2005, A&A, 442, 949
- Gibb, Wyrowski, & Mundy (2004) Gibb A. G., Wyrowski F., Mundy L. G., 2004, ApJ, 616, 301
- Girart et al. (2009) Girart, J. M., Beltrán, M. T., Zhang, Q., Rao, R., & Estalella, R. 2009, Science, 324, 1408
- Gregersen et al. (1997) Gregersen, E. M., Evans, N. J., II, Zhou, S., & Choi, M. 1997, ApJ, 484, 256
- Ho & Young (1996) Ho, P. T. P., & Young, L. M. 1996, ApJ, 472, 742
- Keto, Ho, & Haschick (1987) Keto, E. R., Ho, P. T. P., & Haschick, A. D. 1987, ApJ, 318, 712
- Keto, Ho, & Haschick (1988) Keto, E. R., Ho, P. T. P., & Haschick, A. D. 1988, ApJ, 324, 920
- Kuiper et al. (1978) Kuiper, T. B. H., Rodriguez Kuiper, E. N., & Zuckerman, B. 1978, ApJ, 219, 129
- Lee et al. (2001) Lee, C. W., Myers, P. C., & Tafalla, M. 2001, ApJ 136, 703
- Leung & Brown (1977) Leung, C. M., & Brown, R. L. 1977, ApJ, 214, L73
- Mardones et al. (1997) Mardones, D., Myers, P. C., Tafalla, M., et al. 1997, ApJ, 489, 719
- Narayanan et al. (1998) Narayanan, G., & Walker, C. K. 1998, ApJ, 508, 780
- Osorio et al. (2009) Osorio, M., Anglada, G., Lizano, S., & D’Alessio, P. 2009, ApJ, 694, 29
- Snell & Loren (1977) Snell, R. L., & Loren, R. B. 1977, ApJ, 211, 122
- Shu (1977) Shu, F. H. 1977, ApJ, 214, 488
- Shu, Adams, & Lizano (1987) Shu F. H., Adams F. C., Lizano S., 1987, ARA&A, 25, 23
- Terebey, Shu, & Cassen (1984) Terebey S., Shu F. H., Cassen P., 1984, ApJ, 286, 529
- Walker, Narayanan, & Boss (1994) Walker C. K., Narayanan G., Boss A. P., 1994, ApJ, 431, 767
- Zhang & Ho (1997) Zhang, Q., & Ho, P. T. P. 1997, ApJ, 488, 241
- Zhang et al. (1998) Zhang, Q., Ho, P. T. P., & Ohashi, N. 1998, ApJ, 494, 636
- Zhou et al. (1993) Zhou, S., Evans, N. J., II, Koempe, C., & Walmsley, C. M. 1993, ApJ, 404, 232
- Zinnecker and Yorke (2007) Zinnecker, H., & Yorke, H. W. 2007, ARA&A, 45, 481