On the surface paramagnetism of diamond
Abstract
We present measurements of spin relaxation times (, , ) on very shallow ( nm) nitrogen-vacancy (NV) centers in high-purity diamond single crystals. We find a reduction of spin relaxation times up to 30 compared to bulk values, indicating the presence of ubiquitous magnetic impurities associated with the surface. Our measurements yield a density of /nm2 and a characteristic correlation time of ns of surface states, with little variation between samples (implanted, N-doped) and surface terminations (H, F and O). A low temperature measurement further confirms that fluctuations are themally activated. The data support the atomistic picture where impurities are associated with the top carbon layers, and not with terminating surface atoms or adsorbate molecules. The low spin density implies that the presence of a single surface impurity is sufficient to cause spin relaxation of a shallow NV center.
pacs:
76.30.Mi, 75.70.Cn, 68.35.DvInterest in magnetic surface impurities of diamond comes from recent attempts to utilize the material for ultrasensitive, nanoscale magnetic sensor heads degen08 ; balasubramanian08 ; maletinsky12 and sensor arrays toyli10 ; steinert10 ; lesage13 . These sensors take advantage of the long-lived spin state of single nitrogen-vacancy (NV) centers to detect minute magnetic fields down to a few maze08 ; balasubramanian08 . Diamond-based sensors have recently enabled several notable nanoscale imaging experiments, providing magnetic images of, for example, disk drive media rondin12 ; maletinsky12 , magnetic vortices rondin13 , a single electron spin grinolds13 , and magnetotactic bacteria lesage13 . One of the most exciting prospects of diamond magnetometry is the detection and mapping of single nuclear spins under ambient conditions degen08 . Such a “single-spin“ nuclear magnetic resonance (NMR) microscope could have a transformative impact on structural biology and would be an extremely useful tool for the chemical analysis of surfaces. Indeed, several groups have recently reported successful detection of proton NMR from organic molecules deposited on the surface of a diamond chip with a sensitivity of nuclei mamin13 ; staudacher13 ; ohashi13 .
Sensitive detection of nuclear spin signals requires placement of NV centers very close to the diamond surface () without compromising the long intrinsic spin coherence time. Many recent experiments indicate, however, that spin relaxation times of shallow defects can be reduced by several orders of magnitude. These include studies of nanodiamonds smaller than laraoui12 ; mcguinness13 ; tetienne13 and of bulk crystals with NV centers less than about 10 nm from the surface oforiokai12 ; mamin12 ; ohno12 ; ohashi13 . The reduction in spin lifetimes is attributed to magnetic noise generated at the diamond surface panich06 ; tisler09 ; oforiokai12 . A number of possible origins for this noise have been suggested, including dangling bonds samsonenko79 ; osipov09 , terminating surface atoms tisler09 ; mcguinness13 , adsorbed molecules (like paramagnetic oxygen) bansal72 , or dynamical strain flatte13 . Electron paramagnetic resonance (EPR) and optically detected magnetic resonance (ODMR) have been used to estimate the density and characteristic correlation time of surface magnetic states; most studies, however, required extensive modeling, provide ambiguous results, and are not consistent among each other. Current reported values are between and mamin12 ; mcguinness13 ; tetienne13 . The goal of this study is to present a clear, quantative picture of the surface density and correlation time, and to more precisely pinpoint the atomistic origin and physical mechanism of noise generation.
Presented are measurements of the spin relaxation times , and for a series of shallow () NV centers in high-purity, single crystalline diamond. Relaxation time measurements are widely used techniques in the fields of NMR and EPR for quantitative studies of fast (ps-) processes in materials kimmich04 ; desousa07 ; schenkel06 . The methods exploit the fact that the transition rate in a two-level system is proportional to the energy spectral density evaluated at the transition frequency (according to Fermi’s golden rule). For a spin two-level system, the energy spectral density is given by , where is the magnetic noise spectral density (in units of T2/Hz) and is the electron gyromagnetic ratio.
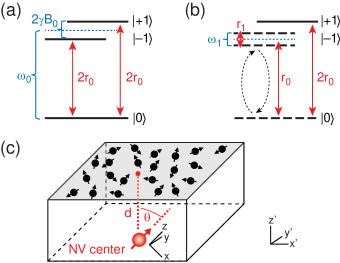
Utilized in this study are two different relaxation times that probe on two different time scales, including the spin-lattice relaxation time (where ) and the rotating-frame relaxation time (). Fig. 1(a) and (b) identify the transitions and rates relevant for these relaxation times in the NV center’s spin system. is the rate of spin flips between the and the (nearly degenerate) states over an energy gap of , where is the zero-field-splitting parameter doherty13 . is the rate of spin flips between parallel and antiparallel states in a spin-locking experiment loretz13 with an energy gap given by the Rabi frequency (typ. ). Transition rates are connected to the magnetic noise spectral density as and slichter90 ; loretz13 , where the numerical factor comes from evaluation of transition matrix elements and is the sum of the three components of the (double-sided) magnetic noise spectral density orientation . The associated relaxation times and are given by (see Supplementary Information):
| (1) | |||||
| (2) |
where we have assumed that and , which will be the case in our study. Using Eqs. (1,2) we can express the magnetic noise spectral density as a function of measured and :
| (3) | |||||
| (4) |
We will interpret the magnetic noise in terms of a two-dimensional bath of electron spins () located at a distance from the NV center, illustrated in Fig. 1(c). The two dimensional bath produces a cumulative magnetic field given by the sum of (randomly oriented) magnetic dipoles, and displays a noise spectrum that is governed by the dynamics of the spin bath. The magnitude of the field is given by:
| (5) |
where is the uniform areal density of surface dipoles, is spatial position (with the NV center located at the origin), , are the three components of the surface magnetic moment, and . For a (100)-oriented surface the NV spin is at to the surface normal, and evaluation of the integral yields:
| (6) |
Provided that the depth of an NV center is known one may use Eq. (7) to infer the density of surface states:
| (7) |
The noise spectrum is more difficult to estimate, as it depends on the detailed dynamics of the surface spin bath and may involve multiple time constants. In spite of that we will interpret dynamics by a single autocorrelation time . The advantage of this approach is that quantitative values for and can be directly inferred from a single pair of relaxation times, providing an efficient means for analyzing many experimental conditions. (We note that while the entire noise spectral density could in principle be mapped out by field cycling kimmich04 ; loretz13 , these measurements are impractical due to the long acquisition times involved and yield ambiguous results due to the field dependence of surface spin dynamics). We will find below that intrinsic donor spins in fact contribute additional low frequency (MHz) noise, but this noise is negligible in the high frequency range relevant for this study. The magnetic noise spectral density associated with correlation time is:
| (8) |
which will be used to infer and :
| (9) | |||||
| (10) |
Here is directly determined by the relaxation times and through Eqs. (1,2).
We have measured spin relaxation times for a series of shallow () NV centers in two different single crystalline samples. These samples had originally been prepared for other experiments oforiokai12 ; ohashi13 , and the data presented here were partially acquired during these measurements. Sample A was a 17-nm thin film of 13C -depleted diamond grown on top of a bulk crystal by chemical vapor deposition (CVD) ishikawa12 ; ohashi13 ; loretz13 . The topmost 5 nm of this film were doped with nitrogen ( ppm) during growth, and only this film was found to host NV centers ohashi13 . Sample B was an electronic-grade single crystal grown by CVD that was scaife-polished, nitrogen-implanted at low energy (0.4-5 keV) and annealed, resulting in NV-centers at roughly 1-10 nm from the surface oforiokai12 . Both samples had a (100) surface orientation. Sample A was further investigated under three different surface chemistries, including hydrogen-, oxygen- and fluorine-terminations. Sample B was only investigated under oxygen termination. More details on sample growth and surface preparation are given with Refs. ohashi13 ; oforiokai12 .
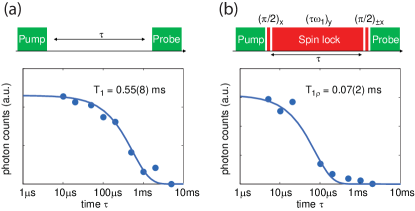
Spin relaxation times were measured by optically-detected magnetic resonance (ODMR) spectroscopy at room temperature gruber97 . All experiments were carried out on single NV centers. Measurement protocols are explained in Fig. 2: For measurements, NV centers were prepared by a first “pump” laser pulse into the state and the spin state was measured by a second “probe” laser pulse based on the NV center’s spin-dependent luminescence gruber97 . Pump and probe pulses were separated by a dark interval of duration during which relaxation occurred. Mapping of fluorescence generated by the probe pulse as a function of then yields an exponential decay with decay time . Two decay curves were recorded for each NV center with the spin state initialized in the and state, respectively, to obtain, after subtraction, a zero-baseline measurement with a monoexponential decay jarmola12 . For measurements, three microwave pulses were applied during the dark period to create a “spin lock” situation loretz13 (see Fig. 2(b)). Again, phase cycling of the second pulse was used to achieve a zero-baseline measurement with a monoexponential decay. Representative decay curves for and are shown with Fig. 2.
Fig. 3 collects and analyzes measurements obtained from 13 different NV centers. These measurements represent the main dataset of our study. In a first panel (Fig. 3(a)) we plot as function of (black dots). The figure serves to illustrate two findings: To begin, we observe that and are strongly correlated – NV centers with long times also have long , and NV centers with short times also exhibit short . The ratio between and is fairly consistent at about 10:1. Second, we observe that relaxation times are reduced up to compared to bulk values (here for Sample A and for Sample B). This shows that surface effects are indeed present and that both and are sensitive indicators of surface magnetic noise. The baseline noise associated with of sample A is only , illustrating the sensitivity of the measurement.
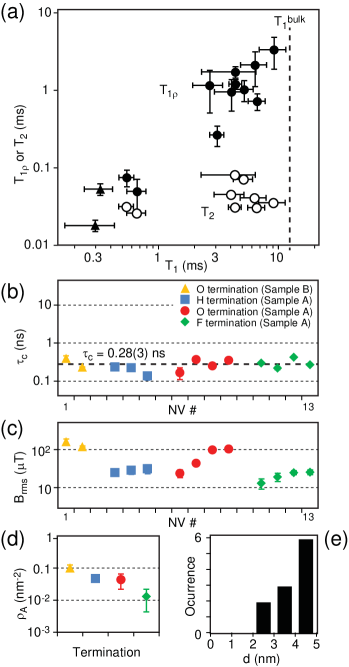
Fig. 3(a) additionally plots values of the spin echo decay time . We note that is not correlated with . Thus, relaxation is governed by low-frequency () noise that is not related to the surface, such as the noise produced by nitrogen impurities in the diamond samples. values measured in this study were between .
Figs. 3(b) and (c) plot values of the characteristic correlation time and the rms magnetic field organized by surface chemistry and sample type. and were calculated from relaxation times according to Eqs. (3,4) and (9,10). (We note that an offset was subtracted from both and to account for surface-unrelated or “bulk” relaxation). We find that shows little variation with most values between 0.2 and 0.4 ns, around a mean value of . This finding is surprising, because a strong variation of would be expected if magnetic surface states were rooted in terminating surface atoms or adsorbates. Much larger variations are found for , as can be expected from the stochastic placement of NV centers and perhaps also due to the stochastic distribution of surface impurities.
In Fig. 3(d) we have calculated an upper bound for the surface spin density based on and an estimate of defect depth . Although we do not have a precise knowledge of , we know that for all NV centers given the 5-nm-thick doping layer of the sample (Sample A) depth . For sample B the depth was estimated through SRIM calculations oforiokai12 ; srim . Among the NV centers of Sample A we have pick the ones with the lowest for each surface termination (here ). These NV centers are likely bvery close to nm. In fact, since many NV centers showed similar , we suspect that most NV centers are located near the deep end of the doping layer. We find that (upper bound) for both samples (see Fig. 3(d)). The lowest densities are observed for fluorine-terminated surfaces and the highest densities for the implanted surface, respectively.
The densities of surface impurities found here are low compared to previous studies on nanodiamonds tisler09 ; tetienne13 and compared to densities measured by SQuID’s on other material surfaces bluhm09 , where . We believe that this is a consequence of the high surface quality of the present samples. Given the low density and close proximity of investigated NV centers to the surface, actually only very few surface states significantly couple to the NV spin. In fact, we have calculated that at a depth of about 80% of will originate from a single surface impurity. This means that at shallow depth a single impurity is responsible for spin relaxation. While this is an exciting prospect in the context of quantum sensing schaffry11 ; grinolds13 , it is difficult to confirm and utilize the “quantum” character of these surface states due to the short .
Noting that and do not vary significantly between samples, we have used to “gauge” the approximate depth (upper bound) of investigated NV centers, according to Eq. (7). Fig. 3(e) plots a histogram of inferred depth values. The histogram suggests that no NV centers lie within 2 nm from the surface. Although our inferred depth is very approximate, we note that this observation is consistent with the smallest reported size for NV-carrying nanodiamonds of smith09 ; tisler09 and recent depth measurements by nanoscale NMR jelezko13 .
Our data further give insight into the mechanism generating the magnetic fluctuations. Two main mechanisms have been suggested including spin diffusion and spin-phonon relaxation desousa07 ; tetienne13 . The low density of surface states in our samples favors spin-phonon relaxation over spin diffusion. This hypothesis is supported by the observation that all investigated surfaces show similar correlation times irrespective of . To more conclusively establish the mechanism of noise generation we have recorded of one NV center as a function of temperature. Since according to Eq. (8) a temperature dependence of directly indicates whether fluctuations are thermally activated, as predicted for a spin-phonon (but not a spin diffusion) process jarmola12 . As Fig. 4(a) shows, is strongly temperature dependent, indicating that surface fluctuations are indeed thermally activated. We note that the long at low temperature may become benefitial for magnetometry applications that require high frequency resolution laraoui13 .
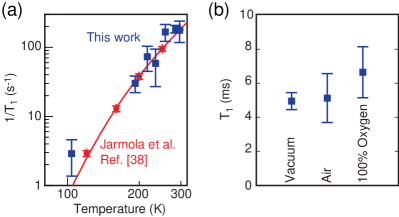
We finally discuss a few anecdotal observations. In an attempt to perform nanoscale NMR measurements with shallow NV centers mamin13 ; staudacher13 ; ohashi13 we have overcoated the diamond surface with a variety of substances and recorded the associated relaxation times. We did not find any significant changes with any of the substances tested, including stearic acid and optical immersion oils (data not shown). We found a strong reduction of relaxation times when overcoating the surface by PMMA resist, but this reduction was most likely caused by paramagnetic contamination of the resist. We have finally exposed the sample to vacuum, ambient air and 100% oxygen atmospheres, with no noticeable change in (see Fig. 4(b)). We can thus exclude molecular oxygen as the leading cause of surface magnetic noise. Together, all observations support the general picture where the surface states are intrinsically associated with diamond’s top carbon layers samsonenko79 and not with terminating surface atoms or adsorbate molecules.
In the light of these findings, several illuminating experiments could be conceived to more precisely pinpoint the underlying atomistic mechanism responsible for surface magnetic states. In particular, different surface orientations of diamond (such as a -oriented surface) or atomically-flat substrates watanabe99 could be explored to elucidate the influence of bonding structure of the top carbon atoms. Altogether, a precise understanding of diamond surface magnetic states will be crucial for further improving the sensitivity and resolution of diamond magnetic sensor heads and sensor arrays.
The work at ETH was supported by the Swiss National Science Foundation through Project Grant and through the NCCR QSIT. The work at Keio has been supported by the Cannon Foundation, the Core-to-Core Program by JSPS, and the Project for Developing Innovation Systems by MEXT. We thank K. Chang, R. Schirhagl and F. Jelezko for experimental help and fruitful discussions, and J. Meijer and S. Pezzanga for help with preparation of sample B oforiokai12 .
References
- (1) C. L. Degen, Appl. Phys. Lett. 92, 243111 (2008).
- (2) G. Balasubramanian et al., Nature 455, 648 (2008).
- (3) P. Maletinsky et al., Nat. Nanotechnol. 7, 320-324 (2012).
- (4) D. M. Toyli, C. D. Weis, G. D. Fuchs, T. Schenkel, and D. D. Awschalom, Nano Lett. 10, 3168-3172 (2010).
- (5) S. Steinert et al., Rev. Sci. Instrum. 81, 43705 (2010).
- (6) D. Le Sage et al., Nature 496, 486-U105 (2013).
- (7) J. R. Maze et al., Nature 455, 644 (2008).
- (8) L. Rondin et al., Appl. Phys. Lett. 100, 153118 (2012).
- (9) L. Rondin et al., arXiv:1302.7307
- (10) M. S. Grinolds et al., Nat. Phys. 9, 215-219 (2013).
- (11) H. J. Mamin et al., Science 339, 557-560 (2013).
- (12) T. Staudacher et al., Science 339, 561-563 (2013).
- (13) K. Ohashi et al., Nano Letters 13, 4733-4738 (2013).
- (14) A. Laraoui, J. S. Hodges, and C. A. Meriles, Nano Lett. 12, 3477-3482 (2012).
- (15) L. P. McGuinness et al., arXiv:1211.5749
- (16) J. P. Tetienne et al., Phys. Rev. B 87, 235436 (2013).
- (17) H. J. Mamin, M. H. Sherwood, and D. Rugar, Phys. Rev. B 86, 195422 (2012).
- (18) B. K. Ofori-Okai et al., Phys. Rev. B 86, 081406 (2012).
- (19) K. Ohno et al., Appl. Phys. Lett. 101, 082413 (2012).
- (20) A. M. Panich et al., Eur. Phys. J. B 52, 397 (2006).
- (21) J. Tisler et al., ACS Nano 3, 1959 (2009).
- (22) V. Y. Osipov, A. Shames, and A. Y. Vul’, Physica B: Condensed Matter 404, 4522-4524 (2009).
- (23) N. D. Samsonenko, G. V. Zhmykhov, V. S. Zon, and V. K. Aksenov, J. Struct. Chem. 20, 951-953 (1979).
- (24) R. C. Bansal, F. J. Vastola, and P. L. Walker, Carbon 10, 443 (1972).
- (25) J. M. Moore, and M. E. Flatté, APS March Meeting, Abstract B46.00014, Baltimore, 2013.
- (26) R. de Sousa, Phys. Rev. B 76, 245306 (2007).
- (27) R. Kimmich, and E. Anoardo, Prog. Nucl. Magn. Reson. Spectrosc. 44, 257-320 (2004).
- (28) T. Schenkel et al., Appl. Phys. Lett. 88, 112101 (2006).
- (29) M. W. Doherty et al., Physics Reports 528, 1-45 (2013).
- (30) M. Loretz, T. Rosskopf, and C. L. Degen, Phys. Rev. Lett. 110, 017602 (2013).
- (31) C. P. Slichter, Principles of Magnetic Resonance, (Springer, Heidelberg, 1996).
- (32) The magnetic field is isotropic assuming that surface spins are randomly oriented and the NV center’s spin is at an angle from the surface normal (see Supplementary Information).
- (33) T. Ishikawa et al., Nano Lett. 12, 2083-2087 (2012).
- (34) A. Gruber et al., Science 276, 2012 (1997).
- (35) A. Jarmola, V. M. Acosta, K. Jensen, S. Chemerisov, and D. Budker, Phys. Rev. Lett. 108, 197601 (2012).
- (36) The thickness of the -doped layer was estimated from the calibrated growth rate and is expected to be accurate within 20 %. See also Refs. ohashi13 ; ishikawa12 .
- (37) J. F. Ziegler, J. P. Biersack, and M. D. Ziegler, “SRIM, the stopping and range of ions in matter”, http://srim.org.
- (38) H. Bluhm, J. A. Bert, N. C. Koshnick, M. E. Huber, and K. A. Moler, Phys. Rev. Lett. 103, 026805 (2009).
- (39) M. Schaffry, E. M. Gauger, J. J. L. Morton, and S. C. Benjamin, Phys. Rev. Lett. 107, 207210 (2011).
- (40) B. R. Smith et al., Small 5, 1649 (2009).
- (41) F. Jelezko, private communication.
- (42) A. Laraoui et al., Nature Communications 4, 1651 (2013).
- (43) H. Watanabe et al., Diam. Relat. Mat. 8, 1272-1276 (1999).
- (44) A small bias field does not significantly alter the relaxation dynamics; the error added to spectral densities is .