Suzaku study of gas properties along filaments of A2744
Abstract
Context. We present the results of Suzaku observations of a massive galaxy cluster A2744, which is an active merger at .
Aims. By using long X-ray observations of A2744, we aim to understand the growth of the cluster and the gas heating process through mass accretion along the surrounding filaments.
Methods. We analyzed data from two-pointed Suzaku observations of A2744 to derive the temperature distribution out to the virial radius in three different directions. We also performed a deprojection analysis to study radial profiles of gas temperature, density, and entropy and compared the X-ray results with multi-wavelength data to investigate correlations with the surface density of galaxies and with radio relics.
Results. The gas temperature was measured out to the virial radius in the north-east region and to about in the north-west and south regions. The radial profile of the gas temperature is rather flat and the temperature is very high (even near ); it is comparable to the mean temperature of this cluster ( keV). These characteristics have not been reported in any other cluster. We find a hint of temperature jump in the northeast region whose location coincides with a large radio relic, indicating that the cluster experienced gas heating because of merger or mass accretion onto the main cluster. The temperature distribution is anisotropic and shows no clear positive correlation with the galaxy density, which suggests an inhomogeneous mass structure and a complex merger history in A2744.
Key Words.:
galaxies: clusters: individual: Abell 2744 – galaxies: intracluster medium – X-rays: galaxies: clusters – cosmology: observations1 Introduction
A2744 at (AC118 or RXC~J0014.3–3022) is one of the most actively merging clusters, nicknamed “Pandora’s cluster” (e.g., Owers et al., 2011). This cluster is also known as a gravitational lens, with an enormous mass ( for ; Merten et al., 2011). Braglia et al. (2007) discovered the existence of two large-scale filamentary structures that extend beyond the virial radius of A2744. Given this well-defined large-scale structure, A2744 offers a unique opportunity to study the formation and growth of a massive cluster in the distant universe through merging and mass accretion along the filaments.
The mass structure and characteristics of the intracluster medium (ICM) in the core of A2744 have been extensively studied at various wavelengths. In the X-ray region, the cluster exhibits two emission peaks that correspond to the main cluster and to a subcluster in the northwest. A bow shock was discovered in the subcluster by Chandra (Kempner & David, 2004). Consistent with this discovery, in the central region of the system, two over-densities of member galaxies appear that are clearly separated from the two X-ray sub-components visible in the XMM-Newton image (e.g., Pierini et al., 2008; Zhang et al., 2004, 2006; Finoguenov et al., 2005). Merten et al. (2011) performed a detailed lensing and X-ray analysis that suggests the southern and northwestern cores are post-merger and exhibit a morphology similar to that of the Bullet Cluster viewed from a different angle.
The radio halo in A2744 is one of the most luminous and the bulk of the diffuse radio emission is centered on the main cluster. The cluster also hosts a large radio relic at a projected distance of 2 Mpc (Govoni et al., 2001a, b). This suggests that shock heating is at work; however, due to the lack of deep X-ray data, the detailed characteristics of the ICM at the location of relic have yet to be clarified. Furthermore, within Mpc the dynamical mass is calculated to be (Boschin et al., 2006). This value is greater than the X-ray hydrostatic mass by %, and it is likely to be overestimated because of mergers. Thus, A2744 calls for an assessment of the characteristics of its complex ICM beyond the virial radius.
The X-ray Imaging Spectrometer (XIS; Koyama et al., 2007) onboard the Suzaku satellite (Mitsuda et al., 2007) enabled observations of diffuse ICM emission up to their virial radius because of the low and stable background. Thus far, XIS has measured temperature profiles in the cluster outskirts for about twenty nearby objects, all of which show a temperature drop by a factor of two to four at large radii (for a review, see Reiprich et al., 2013). Recently, Ichikawa et al. (2013) reported a similar temperature decrease in a cool-core cluster A1835 at . Beyond that redshift, we still lack data. Theoretically, the mass accretion and formation shock may preferentially occur at high redshifts. Thus, a detailed study of the outer regions of distant mergers is important to probe the formation history of clusters.
With the goal of understanding cluster growth via mass accretion and gas heating, we focus on A2744 and measure the large-scale temperature distribution with Suzaku. This paper is organized as follows: in §2 the Suzaku observations and data reduction are presented, in §3 the spectral analysis and results are shown, in §4 the temperature profile of A2744 is compared with other clusters and the ICM characteristics are discussed based on a comparison with the galaxy density in the filaments and the radio relic, and in §5 we summarize the results.
Throughout the paper, the cosmological model is adopted with matter density , cosmological constant , and Hubble constant . At the cluster redshift (), corresponds to 274 kpc. Unless otherwise noted, the specified errors indicate a 90% confidence interval.
2 Observation and data reduction
| Object | OBSID | Date | RAa | DECa | Exposure (sec)b |
|---|---|---|---|---|---|
| A2744 Center | 802033010 | 2007 Jul 19–23 | 00:14:9.5 | :20:40.6 | 150583 |
| A2744 South | 805015010 | 2010 Dec 10–12 | 00:14:3.2 | :33:2.9 | 67428 |
-
a
Pointing coordinates in J2000.
-
b
Net exposure time after data filtering.
The present study uses Suzaku XIS data of A2744 taken during two pointed observations, one centered on the main cluster and the other on the south region. The net exposure times were 150 ks and 67 ks for the center and the southern regions, respectively. The summary of the observation log is given in Table 1. The XIS detectors consist of four X-ray-sensitive CCD cameras, three front-illuminated CCDs (XIS-0, XIS-2, XIS-3), and one back-illuminated CCD (XIS-1) (Koyama et al., 2007). Among them, XIS-0, XIS-1, and XIS-3 were operated in normal modes during the observations and the Space Charge Injection option was applied (Uchiyama et al., 2008).
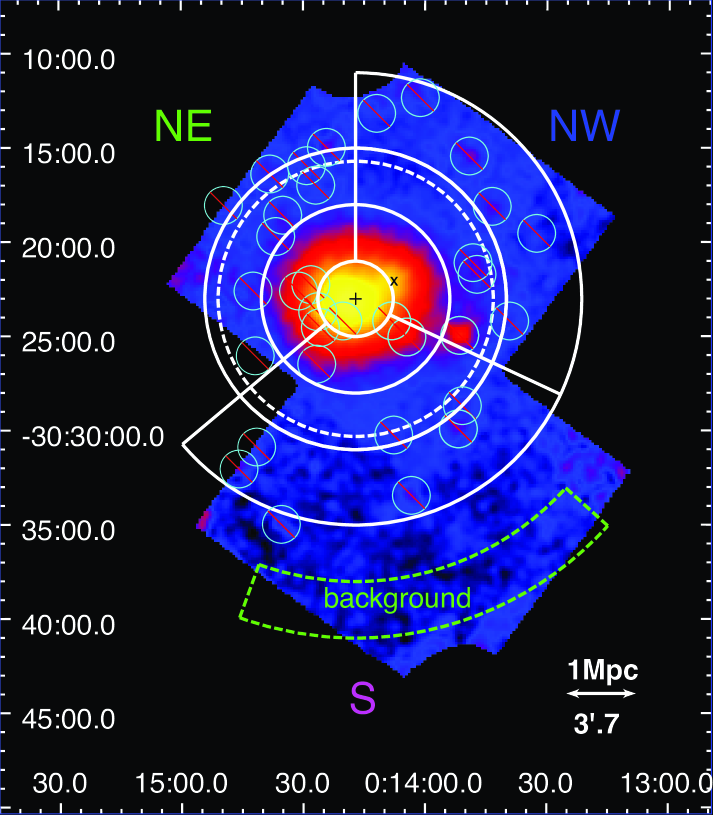
Fig. 1 shows the XIS mosaic image of A2744 in the 0.5–8 keV energy band. Thus, the XIS field of view covers the ICM emission out to the cluster virial radius Mpc (see §3.1) and beyond. As seen in Fig. 1, the X-ray morphology is irregular, with elongation along the west-east direction and bimodal X-ray-emission peaks at the center.
We used cleaned event files created by the pipeline processing version 2.4 and performed the data analysis using HEASoft ver 6.12 and CALDB version 2012-09-02 for XIS and version 2011-06-30 for the X-ray telescopes (XRT; Serlemitsos et al., 2007). The XIS data were filtered according to the following criteria: Earth elevation angle , day-Earth elevation angle , and the satellite was outside the South Atlantic Anomaly.
To measure the average ICM temperature, the X-ray spectra were extracted from the full XIS field of view in the central pointing. Note that, throughout the spectral analysis point sources detected by XMM-Newton were removed with an circle. To investigate the radial distributions, we analyzed the spectra integrated from annular regions centered on the X-ray centroid, (RA, Dec)=(00:14:17.1, :23:02.6) (Ota & Mitsuda, 2004). The radial ranges of the spectra were , and and they were divided into the three azimuthal directions NW, NE and S (Fig. 1) because two filaments were identified in the NW and S directions (Braglia et al., 2007). The spectra were rebinned so that each spectral bin contained more than 60 counts for spectra in the center and 80 counts for spectra in the south.
| a | b | b | /d.o.f | |||
| () | [keV] | () | [keV] | () | ||
| 1.40(fixed) | 38.7/38 |
-
a
Photon flux of power-law model, in units of at 1 keV.
-
b
Normalization of the APEC model, . is the angular diameter distance to the source. An uniform sky is assumed.
The non-X-ray background was subtracted using xisnxbgen (Tawa et al., 2008). The other background components, i.e., the cosmic X-ray background (CXB) and the Galactic X-ray emission arising from the Local Hot Bubble (LHB) and the Milky Way Halo (MWH) were assessed by using the same model as used in Sakuma et al. (2011) and in Ota et al. (2013). The background spectra in the south () were fit to the model “apecLHB+phabs(apecMWH+power-lawCXB)”, which yielded the parameters given in Table 2, where the spectral normalization factors were derived assuming that these X-ray background components have uniform surface brightness distributions within centered at the XIS optical axis. According to this model, the X-ray background in each spectral region was simulated by using the XSPEC fakeit command and then subtracted from the observed spectrum.
We used xisrmfgen to generate the energy response file. To take into account the XRT’s vignetting effect and a decrease in the low-energy efficiency because of the contaminating material on the optical blocking filter of the XIS the auxiliary response files were calculated by using xissimarfgen (Ishisaki et al., 2007). For input cluster surface brightness, we assumed a -model image with and (Ota & Mitsuda, 2004).
3 Analysis and results
3.1 Global spectra in center
To measure the average temperature of A2744, we first analyzed the XIS spectra extracted from an square in the central pointing (Fig. 1). The observed 0.5–8 keV spectra of three sensors (XIS-0, XIS-1, and XIS-3) were simultaneously fit to the APEC thermal plasma model (Smith et al., 2001) (Fig. 2). The cluster redshift and Galactic hydrogen column density were fixed at and (LAB survey; Kalberla et al., 2005), respectively. For metal abundance, we used the tables in Anders & Grevesse (1989). The fitting was performed using XSPEC version 12.7.1
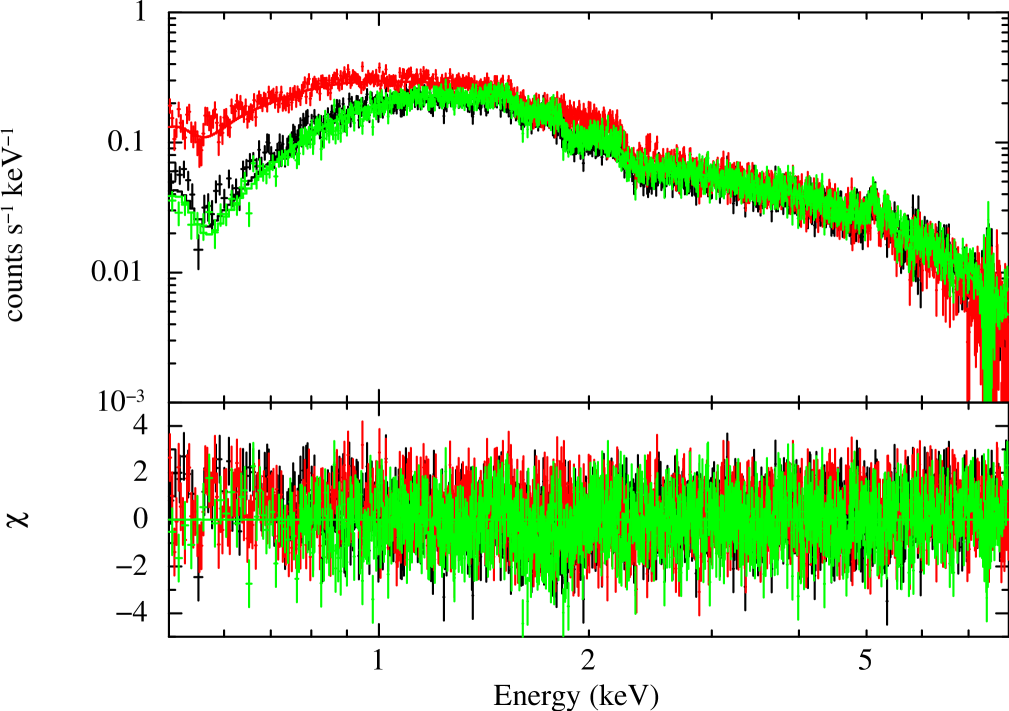
The model parameters are given in Table 3. The resulting global temperature and metal abundance are keV and solar, respectively, which agree well with the previous ASCA measurement (Ota & Mitsuda, 2004). Substituting a mean temperature of keV into the relationship (Arnaud et al., 2005) gives a virial radius of or 7′.3.
| [keV] | [solar] | Norm | /d.o.f. |
|---|---|---|---|
| 2993/2739 |
3.2 Annular spectra in three directions
To derive the radial temperature profiles along the filaments, we extracted spectra from the concentric rings: , , , and , as shown in Fig. 1. The azimuthal angles in three directions are NW: , NE: , and S: , respectively, and All: is used for the azimuthally averaged profile. For the NE direction, is outside the XIS field of view. No significant cluster emission is detected beyond from the cluster center in the S direction, which was not used in the present analysis.
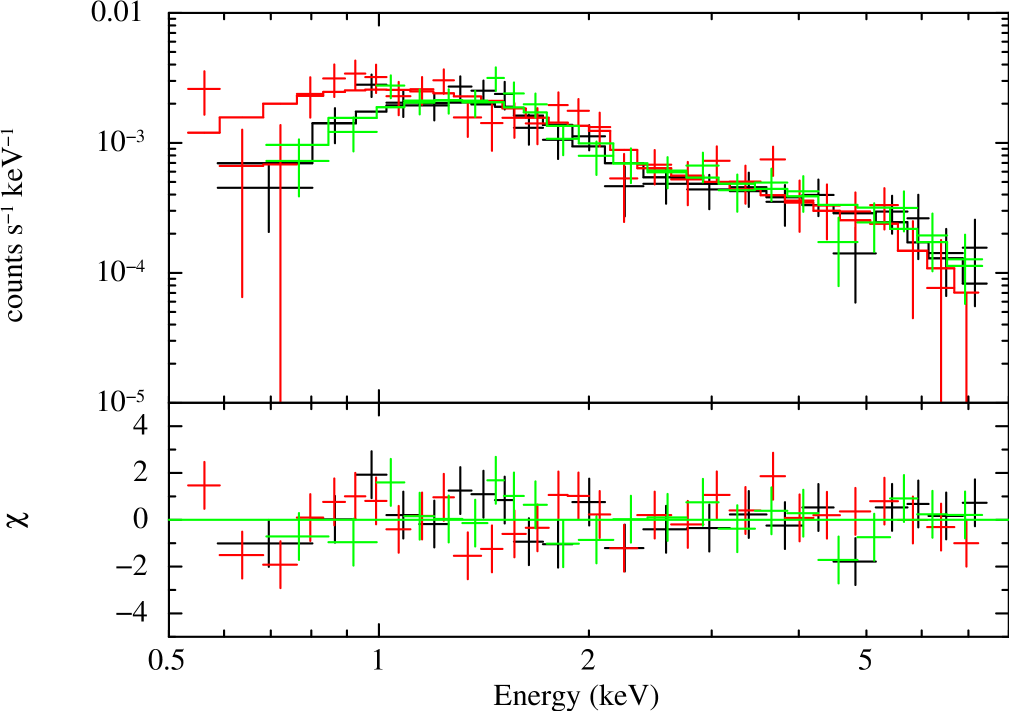
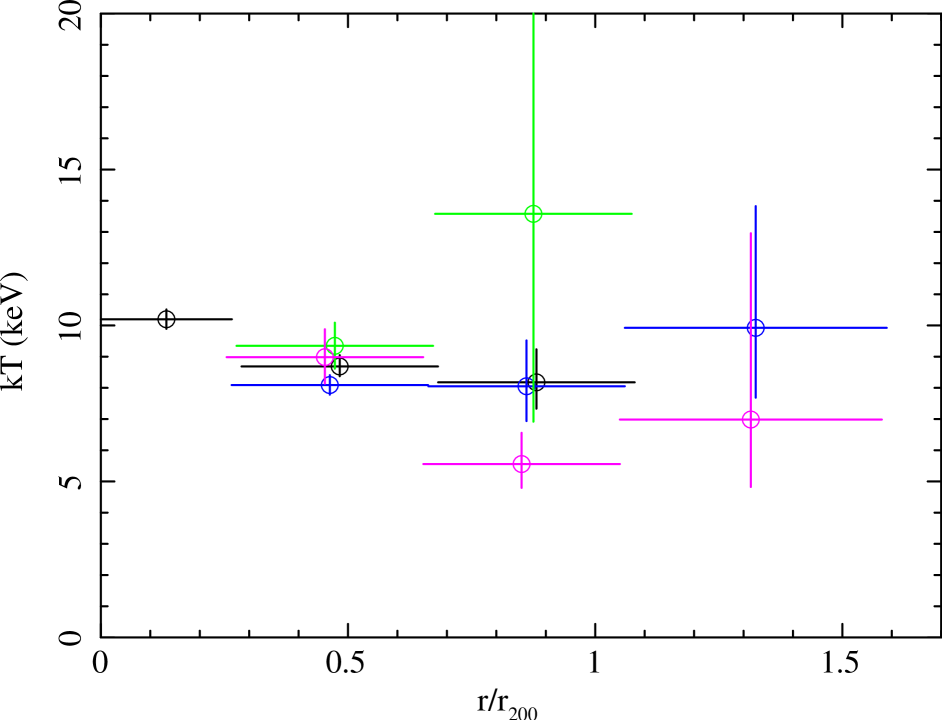
XIS-0, XIS-1, XIS-3 spectra in each ring were then simultaneously fit to the APEC model in the same manner as mentioned above. Figure 3 shows an example of spectral fitting for the case of the NE region. The best-fit parameters are listed in Table 4 and the projected temperature profiles are plotted in Fig. 4.
We successfully obtained the radial temperature profile up to for NE and for NW and S for the first time. The temperature near the virial radius is associated with relatively large statistical uncertainty, however, the result suggests that the profile is rather flat. The temperature outside is comparable to the global temperature ( keV) and does not decline significantly, as is often seen in other clusters.
Furthermore, the temperature distribution is anisotropic as there is also a hint of temperature jump near in the NE while the temperature is lowest in the S direction at the same radius, which will be discussed in more detail later.
| All | ||||
| Region | a | – | ||
| [keV] | – | |||
| [solar] | – | |||
| Norm | – | |||
| 1032/956 | 841/750 | 323/289 | ||
| NW | ||||
| Region | ||||
| [keV] | – | |||
| [solar] | – | |||
| Norm | – | |||
| – | 570/546 | 246/197 | 221/189 | |
| NE | ||||
| Region | ||||
| [keV] | – | – | ||
| [solar] | – | – | ||
| Norm | – | – | ||
| – | 283/294 | 60.6/73 | - | |
| S | ||||
| Region | ||||
| [keV] | – | |||
| [solar] | – | |||
| Norm | – | |||
| – | 271/236 | 170/145 | 45.3/62 | |
-
(a)
The inner-most region is a circle with , which is common among the three directions.
3.3 Systematic errors in temperature measurement
To check the robustness of the temperature measurement in the cluster outskirts, we consider possible systematic errors due to (i) the background model and (ii) the effect of the XRT’s point spread function (PSF), and we examine (iii) possible contamination of the cluster spectra from point sources in the NE region.
For (i), we found that the 2–10 keV CXB flux estimated from A2744 south is 30% lower than that of a blank-sky spectrum from the XIS data of the Lockman Hole and 36% lower than that obtained with the ASCA Medium Sensitive Survey and Large Sky Survey (Kushino et al., 2002). We confirmed this trend by comparing the ROSAT PSPC spectra of annular regions around A2744 and around the Lockman Hole that we retrieved from the ROSAT All-Sky Survey diffuse background map (Snowden et al., 1997). Considering the typical large-scale fluctuations of % (Kushino et al., 2002), the probability that we would observe this low intensity is likely to be low, however, we use the present CXB model in Table 2 as the nominal case for A2744 and examine the impact of background uncertainty in a more quantitative manner below.
The statistical fluctuation of the source number count in the XIS field of view gives the CXB brightness fluctuation expressed as . Here is the effective solid angle and is the energy flux of the faintest point source detectable in the field of view. Following the same approach as in Hoshino et al. (2010), we estimate the CXB fluctuation by substituting into the above relation and from the present XIS observation. With this substitution and referring to the values and from the Ginga satellite (Hayashida et al., 1989), we obtain %. We thus intentionally change the background intensity by % and find that this does not significantly influence the resulting spectral parameters.
For (ii), the Suzaku XRT has a wide PSF (half power diameter ) that allows photons from adjacent regions to contaminate the data. To avoid significant photon mixing, we set the width of annular regions larger than for the outer rings. Simulations by xissim raytracing show that, in terms of the fraction of photons, the PSF effect is 40% for whereas it is as small as 20% for the outer-most () ring.
(iii) In the NE region, many point sources were detected by XMM-Newton (Fig. 1), and the contamination of the cluster spectra from their emission may not be negligible, although they were removed with the circle. To check their impact, we extracted XMM-Newton spectra of the point sources and fitted them to the power-law model. Because of the poor photon statistics (only 260 counts), the photon index was fixed at . The resulting power-law flux was in the 0.2–12 keV band, which corresponds to 30% of the observed flux in the region of interest. Then, we fitted the XIS spectra of the entire NE region to a two-component model consisting of the APEC model and the power-law model whose normalization was fixed to the best-fit value. The gas temperature was obtained as keV in this case. This is marginally lower than the value in Table 4, keV but has an overlap within the errors. To accurately estimate the errors, we assigned keV (a difference between the two best-fit values) to a systematic error of the temperature in NE region. By adding statistical and systematic errors in quadrature, we obtained keV. Note that in Figs. 4–6 and Eq. 3, we showed error ranges calculated by considering systematic errors.
3.4 Deprojection analysis
To derive the radial profiles of gas density and entropy, we performed a deprojection analysis of the annular spectra under the assumption that the cluster gas distribution is spherically symmetric. Although we know that A2744 has an irregular X-ray morphology, the deprojection analysis allows the gas properties to be compared with those of other clusters (deduced under the same assumption).
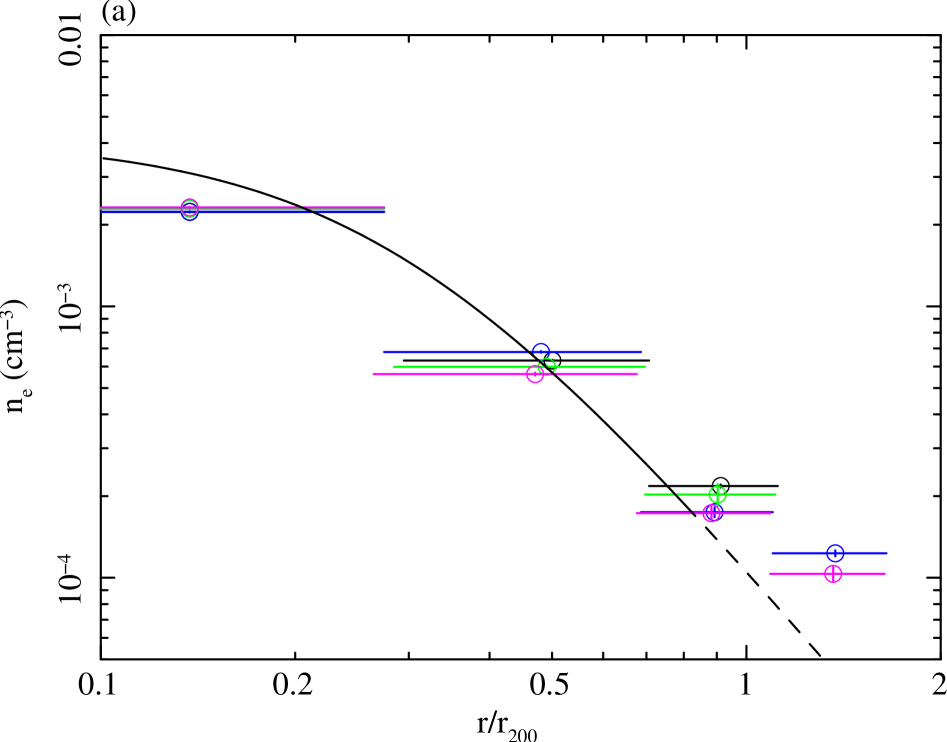
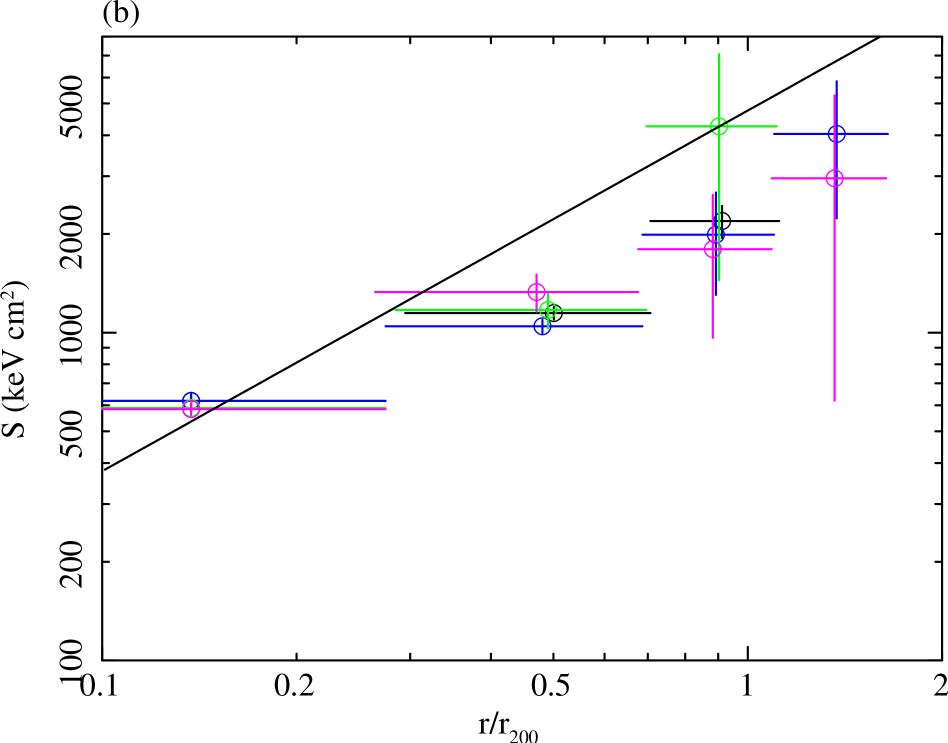
The APEC model corrected for the Galactic absorption was fit to each radial bin with the assumption that the metal abundance is radially constant. The arithmetic deprojection operation was performed by the “projct” model in XSPEC. The two panels in Fig. 5 show the electron density and entropy profiles where the radius is normalized by . The electron density was calculated from the APEC normalization factor , where . The entropy, defined as (Voit, 2005) is calculated by substituting the electron density and the temperature derived from the deprojection analysis for each radial bin.
4 Discussion
With Suzaku, the profiles of temperature, gas density, and entropy were measured out to Mpc in A2744. In this section, to discuss the gas heating process in the cluster outskirts and the evolutionary stage of this unique object, the gas properties of A2744 are compared with X-ray observations of other clusters as well as with multi-wavelength data of this cluster.
4.1 Gas properties in cluster outskirts
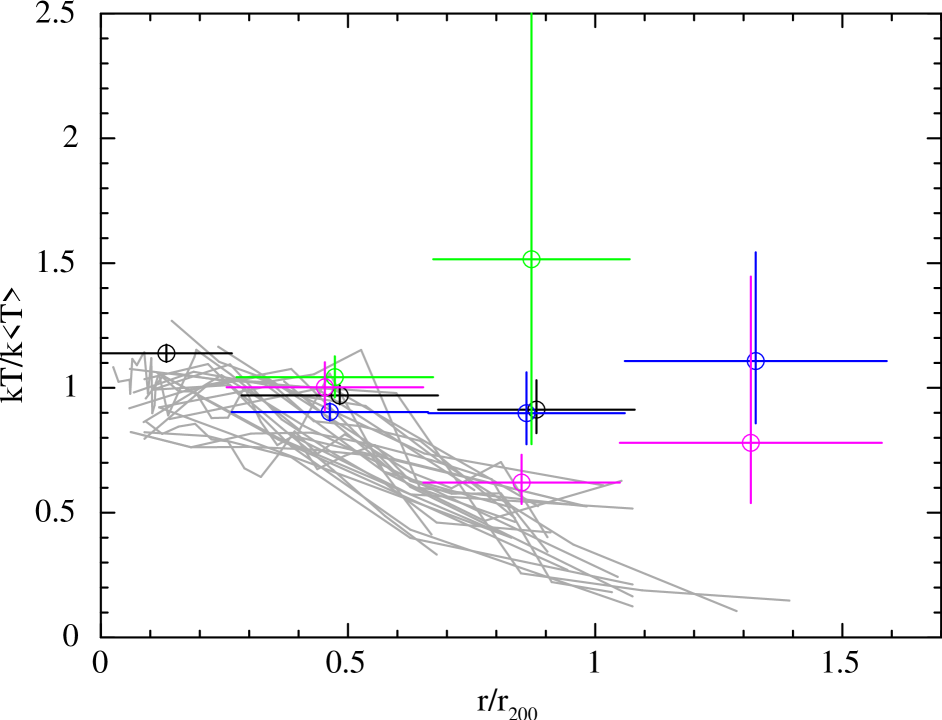
Figure 6 compares A2744’s azimuthally-averaged temperature profile (§3.2) with currently available Suzaku profiles taken from the literature (Reiprich et al., 2013, and references therein). Although the nearby clusters show a systematic temperature decline by a factor of 3 to , A2744 has a flat temperature distribution and the temperature near is one of the highest among them. This result indicates that some significant heating process is at work in the cluster outskirts.
In Fig. 5 (a), the best-fit -model gas-density profile obtained from the ROSAT/HRI data (Ota & Mitsuda, 2004) is shown for comparison. Because the -model analysis was performed by using the cluster image within Mpc, the density profile is extrapolated outside that radius. Overall, the present result agrees well with that of the -model within the virial radius for all directions. On the other hand, some flattening is seen at the outermost region. A similar effect was reported for other clusters such as A1689 (Kawaharada et al., 2010) and A1795 (Bautz et al., 2009).
Based on simulations considering gravitational heating because of smooth mass accretion Voit et al. (2005) noted that the radial gas entropy profile in clusters tends to follow a power-law, that can be used as a baseline for assessing the impact of non-gravitational processes in the ICM. Figure 5(b) shows the baseline profile calculated for keV. The entropy profiles at are flatter than that predicted by the baseline profile, as observed in other nearby clusters (Walker et al., 2012). At , however, the entropy of A2744 shows no clear drop in the outskirts, unlike the previous Suzaku results (Walker et al., 2012). This suggests that the thermal properties of ICM in the cluster outskirts should be significantly affected by the complex merging activities in this system, which are examined below by comparing them with multi-wavelength observations.
4.2 Comparison between X-ray and optical observations
To examine a relationship between the gas property and galaxy distribution in outer regions of the cluster, we compare the gas temperature with the galaxy surface density. The galaxy density was calculated by using the galaxy catalogue in Table 5 of Owers et al. (2011), who compiled two photometric catalogs based on the Supercosmos Sky Survey (Busarello et al., 2002) and the Very Large Telescope (Braglia et al., 2009). We selected 442 galaxies that meet the same criterion as used in Boschin et al. (2006): (or ) and the -band magnitude . The following result does not significantly change if we select galaxies with the same criteria as used in A1835 at , and (Ichikawa et al., 2013).
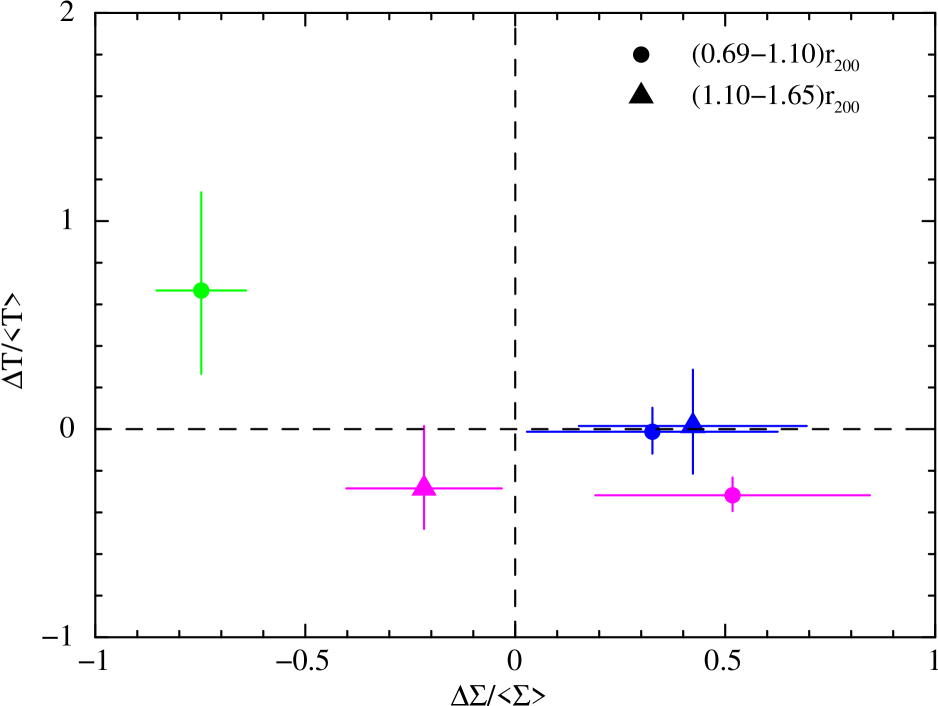
Table 5 shows the gas temperature measured by Suzaku and the galaxy density for two radial ranges; namely, and . The ranges are normalized by their mean values in each radial bin and the errors indicate the statistical uncertainties at 68% confidence. In Fig. 7, the temperature deviation is plotted as a function of the galaxy density contrast, .
As is clear from Table 5, the galaxy density is anisotropic. For , we confirm the galaxy excess in the NW and S directions where the filaments have already been identified by Braglia et al. (2007). On the other hand, the galaxy density is significantly lower in the NE direction. For larger radii (), however, the density in the NE direction is comparable to the mean. If compared with the gas temperature (Fig. 7), no simple one-to-one correspondence exists between the optical and X-ray properties. These results differ from previous reports on A1689 and A1835 that claimed a positive correlation between galaxy density and gas temperature (Kawaharada et al., 2010; Ichikawa et al., 2013). Therefore, the present result strongly suggests a complex dynamical state and mass structure in A2744.
| Region | X-ray temperature | Galaxy surface density | X-ray temperature | Galaxy surface density |
|---|---|---|---|---|
| [keV] | [keV] | |||
| NW | ||||
| NE | –a | |||
| S | ||||
| Average | ||||
-
The statistical errors are quoted.
-
(a)
For NE, is outside the XIS field of view.
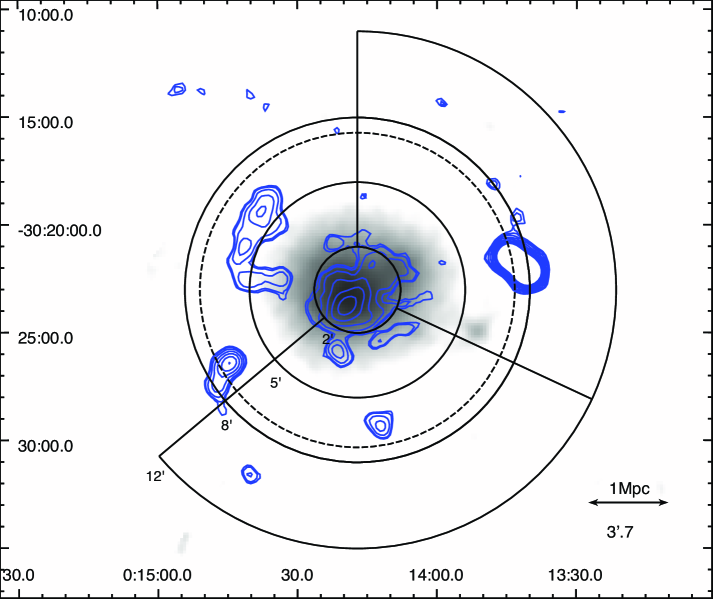
4.3 Comparison between X-ray and radio observations
From the Suzaku observation, we found a hint of temperature jump in the NE region. In fact, as seen from Fig. 8, the location of the high-temperature region coincides well with that of the large radio relic. Thus, the gas may have undergone shock heating because of merging or mass accretion onto the main cluster. For A3667, a sharp change of both temperature and brightness near the relic was observed (Finoguenov et al., 2010; Akamatsu et al., 2012a). With the current photon statistics of the Suzaku data in the NE region, however, we find no significant discontinuity in the X-ray surface brightness at the radio relic. To clarify the origin of the high-temperature gas in the NE region and its relationship to the radio relic, we will examine the temperature and density structures in more detail upon completion of an additional pointing observation approved for Suzaku AO8.
4.4 X-ray mass estimation and implications
The complex gas distribution in A2744 indicates that the cluster is not in the relaxed state. However, we expect that comparing the hydrostatic mass estimated from X-ray observations with the gravitational lensing mass will clarify the dynamical state of the system (e.g., Ota et al., 1998). Merten et al. (2011) estimated the weak lensing mass of this cluster to be . From the radially-averaged temperature profile (All:) derived in §3.4 and the -model parameters and kpc (Ota & Mitsuda, 2004), we calculate the hydrostatic mass projected within a radius of 1.3 Mpc to be
| (1) |
If the temperature profiles in three different directions are separately used, we obtain
| (2) | |||||
| (3) | |||||
| (4) |
Excluding the NE region where the high-temperature gas exists, the systematic uncertainty in the X-ray hydrostatic mass is estimated to be 25%. Although the X-ray mass derived from the mean temperature profile is in an agreement with the weak lensing mass within the statistical error, its interpretation must be done with care given the systematic uncertainty.
Based on X-ray observations (e.g., Akamatsu et al., 2012a, b) and hydrodynamic simulations (e.g., Akahori & Yoshikawa, 2010), a possibility of non-equilibrium ionization in merging clusters has been pointed out. Assuming that the ionization timescale is given by (Masai, 1984) and the observed high-temperature gas originates from the merger shock having a shock velocity of the order , the ion-electron relaxation timescale near the viral radius of A2744 is likely to be longer than the time elapsed after the shock occurs. A more quantitative evaluation of the physical state of the ICM requires an additional observation.
5 Summary
By using the Suzaku XIS detectors, we performed an X-ray spectral analysis of the merging cluster A2744 at and derived the temperature profiles out to large radii ( in the NE direction and in the NW and S directions) for the first time. The temperature is as high as keV even near the virial radius and does not decline significantly in the outskirts, which differs from all other clusters observed with Suzaku. We also found that the temperature structure is anisotropic and exhibits no clear positive correlation with the galaxy surface density, suggesting that the cluster has a very complex mass structure and is dynamically young. We find a hint of temperature jump in the NE region whose location coincides well with that of a large radio relic. Thus the gas may have undergone shock heating because of merging or mass accretion. A further examination of the shock structure near the radio relic must await a follow-up X-ray observation of the NE region.
Acknowledgements.
We are grateful to the Suzaku team members for satellite operation and instrumental calibration. We would also like to thank E. Orrù for providing the radio data, T. H. Reiprich for the electronic data to reproduce a figure of temperature profiles obtained with Suzaku, and D. Pierini and A. Scaife for useful discussions. We are also grateful to K. Sato for suggesting a useful means of calculating the PSF effect. This work is in part supported by a Grant-in-Aid by MEXT, KAKENHI Grant Number 25400231(NO). Y.Y.Z. acknowledges support by the German BMWi through the Verbundforschung under grant 50 OR 1103.References
- Akahori & Yoshikawa (2010) Akahori, T. & Yoshikawa, K. 2010, PASJ, 62, 335
- Akamatsu et al. (2012a) Akamatsu, H., de Plaa, J., Kaastra, J., et al. 2012a, PASJ, 64, 49
- Akamatsu et al. (2012b) Akamatsu, H., Takizawa, M., Nakazawa, K., et al. 2012b, PASJ, 64, 67
- Anders & Grevesse (1989) Anders, E. & Grevesse, N. 1989, Geochim. Cosmochim. Acta., 53, 197
- Arnaud et al. (2005) Arnaud, M., Pointecouteau, E., & Pratt, G. W. 2005, A&A, 441, 893
- Bautz et al. (2009) Bautz, M. W., Miller, E. D., Sanders, J. S., et al. 2009, PASJ, 61, 1117
- Boschin et al. (2006) Boschin, W., Girardi, M., Spolaor, M., & Barrena, R. 2006, A&A, 449, 461
- Braglia et al. (2007) Braglia, F., Pierini, D., & Böhringer, H. 2007, A&A, 470, 425
- Braglia et al. (2009) Braglia, F. G., Pierini, D., Biviano, A., & Böhringer, H. 2009, A&A, 500, 947
- Busarello et al. (2002) Busarello, G., Merluzzi, P., La Barbera, F., Massarotti, M., & Capaccioli, M. 2002, A&A, 389, 787
- Finoguenov et al. (2005) Finoguenov, A., Böhringer, H., & Zhang, Y.-Y. 2005, A&A, 442, 827
- Finoguenov et al. (2010) Finoguenov, A., Sarazin, C. L., Nakazawa, K., Wik, D. R., & Clarke, T. E. 2010, ApJ, 715, 1143
- Govoni et al. (2001a) Govoni, F., Enßlin, T. A., Feretti, L., & Giovannini, G. 2001a, A&A, 369, 441
- Govoni et al. (2001b) Govoni, F., Feretti, L., Giovannini, G., et al. 2001b, A&A, 376, 803
- Hayashida et al. (1989) Hayashida, K., Inoue, H., Koyama, K., Awaki, H., & Takano, S. 1989, PASJ, 41, 373
- Hoshino et al. (2010) Hoshino, A., Henry, J. P., Sato, K., et al. 2010, PASJ, 62, 371
- Ichikawa et al. (2013) Ichikawa, K., Matsushita, K., Okabe, N., et al. 2013, ApJ, 766, 90
- Ishisaki et al. (2007) Ishisaki, Y., Maeda, Y., Fujimoto, R., et al. 2007, PASJ, 59, 113
- Kalberla et al. (2005) Kalberla, P. M. W., Burton, W. B., Hartmann, D., et al. 2005, A&A, 440, 775
- Kawaharada et al. (2010) Kawaharada, M., Okabe, N., Umetsu, K., et al. 2010, ApJ, 714, 423
- Kempner & David (2004) Kempner, J. C. & David, L. P. 2004, MNRAS, 349, 385
- Koyama et al. (2007) Koyama, K., Tsunemi, H., Dotani, T., et al. 2007, PASJ, 59, 23
- Kushino et al. (2002) Kushino, A., Ishisaki, Y., Morita, U., et al. 2002, PASJ, 54, 327
- Masai (1984) Masai, K. 1984, Ap&SS, 98, 367
- Merten et al. (2011) Merten, J., Coe, D., Dupke, R., et al. 2011, MNRAS, 417, 333
- Mitsuda et al. (2007) Mitsuda, K., Bautz, M., Inoue, H., et al. 2007, PASJ, 59, 1
- Orrú et al. (2007) Orrú, E., Murgia, M., Feretti, L., et al. 2007, A&A, 467, 943
- Ota et al. (2013) Ota, N., Fujino, Y., Ibaraki, Y., Böhringer, H., & Chon, G. 2013, A&A, 556, A21
- Ota & Mitsuda (2004) Ota, N. & Mitsuda, K. 2004, A&A, 428, 757
- Ota et al. (1998) Ota, N., Mitsuda, K., & Fukazawa, Y. 1998, ApJ, 495, 170
- Owers et al. (2011) Owers, M. S., Randall, S. W., Nulsen, P. E. J., et al. 2011, ApJ, 728, 27
- Pierini et al. (2008) Pierini, D., Zibetti, S., Braglia, F., et al. 2008, A&A, 483, 727
- Reiprich et al. (2013) Reiprich, T. H., Basu, K., Ettori, S., et al. 2013, Space Sci. Rev.
- Sakuma et al. (2011) Sakuma, E., Ota, N., Sato, K., Sato, T., & Matsushita, K. 2011, PASJ, 63, 979
- Serlemitsos et al. (2007) Serlemitsos, P. J., Soong, Y., Chan, K.-W., et al. 2007, PASJ, 59, 9
- Smith et al. (2001) Smith, R. K., Brickhouse, N. S., Liedahl, D. A., & Raymond, J. C. 2001, ApJ, 556, L91
- Snowden et al. (1997) Snowden, S. L., Egger, R., Freyberg, M. J., et al. 1997, ApJ, 485, 125
- Tawa et al. (2008) Tawa, N., Hayashida, K., Nagai, M., et al. 2008, PASJ, 60, 11
- Uchiyama et al. (2008) Uchiyama, Y., Maeda, Y., Ebara, M., et al. 2008, PASJ, 60, 35
- Voit (2005) Voit, G. M. 2005, Reviews of Modern Physics, 77, 207
- Voit et al. (2005) Voit, G. M., Kay, S. T., & Bryan, G. L. 2005, MNRAS, 364, 909
- Walker et al. (2012) Walker, S. A., Fabian, A. C., Sanders, J. S., & George, M. R. 2012, MNRAS, 427, L45
- Zhang et al. (2006) Zhang, Y.-Y., Böhringer, H., Finoguenov, A., et al. 2006, A&A, 456, 55
- Zhang et al. (2004) Zhang, Y.-Y., Finoguenov, A., Böhringer, H., et al. 2004, A&A, 413, 49