Dynamical coupling during collective animal motion
a Chair of Systems Design, ETH Zurich, Weinbergstrasse 56/58, 8092 Zurich, Switzerland
b Department of Ecology and Evolution, University of Lausanne, Biophore, 1015 Lausanne, Switzerland
c Institute of Evolutionary Biology and Environmental Studies, University of Zurich, Winterthurerstrasse 190, 8057 Zurich, Switzerland )
Abstract
The measurement of information flows within moving animal groups has recently been a topic of considerable interest, and it has become clear that the individual(s) that drive collective movement may change over time, and that such individuals may not necessarily always lead from the front. However, methods to quantify the influence of specific individuals on the behaviour of other group members and the direction of information flow in moving group, are lacking on the level of empirical studies and theoretical models. Using high spatio-temporal resolution GPS trajectories of foraging meerkats, Suricata suricatta, we provide an information-theoretic framework to identify dynamical coupling between animals independent of their relative spatial positions. Based on this identification, we then compare designations of individuals as either drivers or responders against designations provided by the relative spatial position. We find that not only does coupling occur both from the frontal to the trailing individuals and vice versa, but also that the coupling direction is a non-linear function of the relative position. This provides evidence for (i) intermittent fluctuation of the coupling strength and (ii) alternation in the coupling direction within foraging meerkat pairs. The framework we introduce allows for a detailed description of the dynamical patterns of mutual influence between all pairs of individuals within moving animal groups. We argue that applying an information-theoretic perspective to the study of coordinated phenomena in animal groups will eventually help to understand cause and effect in collective behaviour.
Major classification: Biological Sciences
Minor classification: Ecology
Keywords: Suricata suricatta, meerkat, animal movement, GPS, coupling, leading, information theory, mutual information.
Corresponding author: Thomas Richardson, Office 3104, Department of Ecology and Evolution, University of Lausanne, Biophore, 1015 Lausanne, Switzerland. . thomas.richardson@unil.ch
Author contributions: MBM & CAHB designed and performed the data collection. NP & CAHB constructed GPS collars for data collection. TOR & NP analysed the data and wrote the paper. TOR, NP, CJT, MM & FS provided analytical tools. FS & MBM acquired funding, provided research facilities and provided support and advice to junior colleagues. All authors discussed the results and implications.
Introduction
To date, most investigations of the organisation of collective movement have focused on cases of coherent group movement, in which local speed or velocity differences between individual and group motion are rather minor. This may be the typical case in bird flocks or fish shoals, but the same may not be so for moving terrestrial groups. In such groups [1], individual movement often consists of periods of rapid displacement during which the animal moves in concert with the group, and is intermittently punctuated by near-stationary phases during which it may engage in local area-restricted search, for example after encountering a food-resource patch. In such groups, motion at the individual and group levels may not be so strongly synchronised as is observed in flying or swimming groups; at any moment, a sizeable fraction of the group may perform area-restricted movement, whilst the rest continue onwards. The leading edge of a moving animal group may create one or more dynamical fronts whose direction of movement is subject to sudden changes, whose shape is subject to abrupt deformations, and whose membership is in a constant state of flux. How then to reliably identify the influential individuals?
Studies now abound on the role of influential individuals (such as leaders) in collective behaviour. Theoretical progress has been rapid [2, 3, 4, 5, 6, 7], and often outstrips empirical progress. Nevertheless, in experimental settings it has been shown that variation in nutritional state [8, 9, 10], in indicators of mate quality [11], in temperamental [12] or personality [13, 14] traits such as boldness, in relatedness between leader-follower pairs [15], or in differential knowledge of food [16, 17, 18] and nesting locations [19] can all give rise to the emergence of leading or following roles. Such studies often operationally define leaders as those individuals at the front of the group, although recently it has been put into question whether these are indeed the key individuals driving group movement [20, 21, 22, 23, 24]. Consequently, a major challenge remains in formally measuring the strength of influence that different individuals within the group exert upon one another, as only with a complete categorisation of all such links will it be possible to infer the leaders. In what follows we term this influence ‘coupling’ in order to distinguish its low-level nature from the classical high-order definitions of leadership as a stable individual characteristic, associated with dominance rank, and issues of intentionality or control [25].
In this paper we will argue that existing methods for measuring the influence within pairs of individuals – namely, pairwise correlations – do not fully capture the variety of functional dependencies that such coupling can take. We then present a more comprehensive entropic measure which explicitly quantifies the dependency in terms of information flow, rather than measuring correlations because such correlations are not always guaranteed to be present when there are underlying information flows. Using the simplest possible dataset – pairs of simultaneously recorded individual spatial trajectories – we demonstrate the basis of the approach. Finally we outline the limitations of this analysis, and advocate the extension of the approach to measuring the coupling between all unique pairs, from which a formal identification of the leader(s) will be possible. However, we first describe how coupling relates to ‘leadership’ as it is currently defined in the context of animal behaviour.
Classically, a leader in an animal group is an individual with some unique skill or behavioural characteristic which through its actions controls or directs the group’s behaviour. In this everyday sense, the quality of leadership is some characteristic that is consistent over at least an intermediate time-period. This definition has been adopted by psychologists [26], ethologists and behavioural biologists [27]. Essentially, a leader is a key individual whose impact on the collective behaviour is greater than that of others [25]. Under this definition, the maximum number of individuals that may be ascribed the label of ‘leader’ is undefined, as is the related question of whether the remaining non-leaders should all be equally responsive to the actions of the leader(s). So for clarity, here we consider the simplest case termed ‘personal leadership’ [28]; a single individual whose influence upon all the other group members is much greater than that of any other individual. Classical personal leadership often occurs in hierarchically-organised societies, in which a single dominant individual can control the actions of other subordinate group members [29, 30]. In these cases, it is long-term individual traits that determine dominance, and hence status as the group leader [31]. However, the possession of a hierarchical social organisation does not mean that leadership is necessarily centralised upon the most dominant individual in all contexts. For example macaques [32, 33, 22, 23], lemurs [34] and capuchins [28] possess dominance hierarchies, but in all cases the initiation of group movement is not associated with dominance, but instead sequentially alternates among all the group members. In this scenario, an individual is only a leader during the short period during which it influences group movement, so individual leadership is temporary and distributed.
Given the above, it seems clear that the fundamental feature common to both personal (centralised) and sequential (distributed) leadership is that the actions of the leader causally impact upon those of the other group members through a set of dynamical dependencies, known as ‘drive-response’ coupling [35, 36, 37]. In the case of animal groups that have personal or sequential leadership, the ‘coupling direction’ is by definition from the leader(s) to the follower(s). However, in many such cases at any given moment a sizeable proportion of the group may not have a potential direct link (e.g. line-of-sight) with the leader. Then, coupling between non-leader individuals is still necessary in order (i) for the influence of the central leader to indirectly propagate, and (ii) to maintain group cohesion. Indeed, in any animal group possessing a centralised leader one can measure the coupling between pairs of individuals, without knowing how far down the causal chain one is observing. Therefore, it is necessary to recognise that such coupling mechanisms must also be in operation in situations in which at any given moment there are numerous individuals that simultaneously but fleetingly exert an influence at the group level, but which have neither personal nor sequential leadership, for example in large yet cohesive flocks [38], swarms [39], shoals [16] and herds [40].
Our central claim is that dynamical coupling mechanisms operating between pairs are the fundamental components common to not only all forms of leadership, but also all cases where a group has no leaders per se but still exhibits cohesion [2, 41]. This assertion is perhaps best evidenced by considering a cohesive moving animal group in which a single centralised leader is present, but where the individuals do not possess a global overview.
The primary challenge in King’s [25] definition of leaders as those individuals that disproportionately influence the other group members, is in quantifying the magnitude of the causal links from the leader to each of the group members. However, as the fundamental mechanism underlying all forms of leadership is pairwise dependencies (coupling), the same challenge exists when measuring the coupling within a pair of non-leader individuals, although then the challenge is more complex as the direction of the link (the coupling direction) is not given a priori.
As the coupling within a pair is only a sample from a large set of simultaneously-occurring pairwise interactions, it represents a window into the inner dynamics of the group that will likely include many causal interactions not necessarily associated with the central leader, for example, those associated with play, sexual competition, foraging competition, group cohesion, predator detection and evasion.
By analysing the time ordering in the movements (spatial trajectories) in animal pairs, several studies have made important methodological progress towards quantitative inference of pairwise coupling [21, 42, 43, 24]. Such studies tacitly subscribe to the long-standing convention of describing some event, A, as causal to another, B, only if A precedes B, and if knowing A increases the prediction ability about the future of B [44, 45, 46], rather than the more rigorous (but often experimentally intractable) definition that requires demonstration of cause and effect through experimental intervention. Although experimental manipulations of coupling are possible, for example through insertion of robotic ‘dummy’ individuals into a moving group [47, 48, 49, 50], none exists for field experimental systems such as cohesively foraging terrestrial species. Hence, here we are constrained to methods of inferring leadership non-manipulatively - typically from the time ordering of paired time series. Such methods include Hellinger distance [51], Granger causality [45], and perhaps more simply, lagged correlation analyses [52].
In the context of collective animal behaviour the lagged correlation analysis consists of measuring the correlation in the orientations or displacements within pairs of moving animals. This gives the coupling strength, and the behaviour of such correlations as a function of the time-delay gives the coupling direction, and hence, which – if any – leads [21, 42, 43, 24, 53]. However, to establish which individual in a pair drives (and hence which responds), these studies used the complete time-aggregated trajectories to establish the direction of causality over the entire observation period. Here, rather than using the complete trajectories to assign a fixed label to the relationship between a given pair, we instead investigate the dynamics of the driver-responder relationship through the use of sliding windows to split the trajectories into a sequence of overlapping trajectory subsections (see Supplemental Information).
In primate groups, the identity of the initiators of bouts of collective movement, such as the initiation of group departure from a resting site, may change from bout to bout [54, 55]. However, the behavioural context we study here is not that of the initiation of group movement: instead, the trajectories we study comprise single coordinated foraging bouts. A further difference between the current study and those that focused upon the initiation of collective movement is the temporal resolution of the data; the high recording frequency of the trajectories studied means that a more natural comparison is with studies of tracking at a high temporal resolution. Such data allow for a fine-grained description of the dynamics of influence between pairs of individuals, specifically through the characterisation of the direction and magnitude of this influence. The uninterrupted measurement of individual position makes it possible to consider this influence from a near-continuous perspective rather than during discrete events, as has often been the case in past studies [54, 55].
The absence of empirical data on time dependence in pairwise drive-response relationships naturally leads to our first null hypothesis; that within a single bout of group foraging, the causal relationship between the actions of pairs of individuals is, if not of fixed magnitude, then at least constant in direction. In many experimental studies of moving animal groups the operational definition of an individual as a leader was [29, 20] – and still often is [56, 57] – defined by its occupancy of a position at the leading edge of the moving group. Theoretical approaches to leadership have found that when the model input includes between-individual variation in the preference to orientate towards some goal, such as an attractive location [6], or to move according to an external gradient [58], then the individuals with prior knowledge or the stronger preference occupy the frontal positions.
Our second null hypothesis is the following: individuals towards the leading edge of the moving group influence those in other positions to a much greater extent than do those at the trailing edge. This proposition is motivated by the argument that, whilst in practice the individuals that most influence the group’s direction of motion are often found at the front [20, 59], it is not clear a priori that leadership by relative spatial position and leadership by copying (sensu King [25]) need be necessarily correlated. In principle, an individual whose actions strongly influence others in the group may occupy non-frontal positions.
To disentangle the potentially confounding correlation between spatial position and causation, we first apply an information-theoretic framework for measuring coupling in moving animal groups. Then, using paired high-frequency GPS trajectory data from a model empirical system [60], collective foraging in meerkats, we demonstrate the applicability of the approach to the extraction of drive-response relationships from noisy field data. Interestingly, similar techniques have been used to track waves of information diffusion through cortical neural networks [61, 62] and simulated animal groups [63]. However, to the best of our knowledge, this study is the first to compare entropic driver-responder classifications with position-based classifications of leader-follower roles, and the first to apply the approach to empirical data on collective behaviour on animal groups.
Results
Establishing the coupling strength and direction using an entropic approach
Our framework for extraction of coupling rests on four steps. In the first step of the framework, a pair of animals, , is selected from the group, and their respective time-stamped trajectories are converted into a paired sequence of displacements, , that is into time series. These displacements can be either in one axis of motion only, or within the plane itself (see the Observables subsection in the Methods).
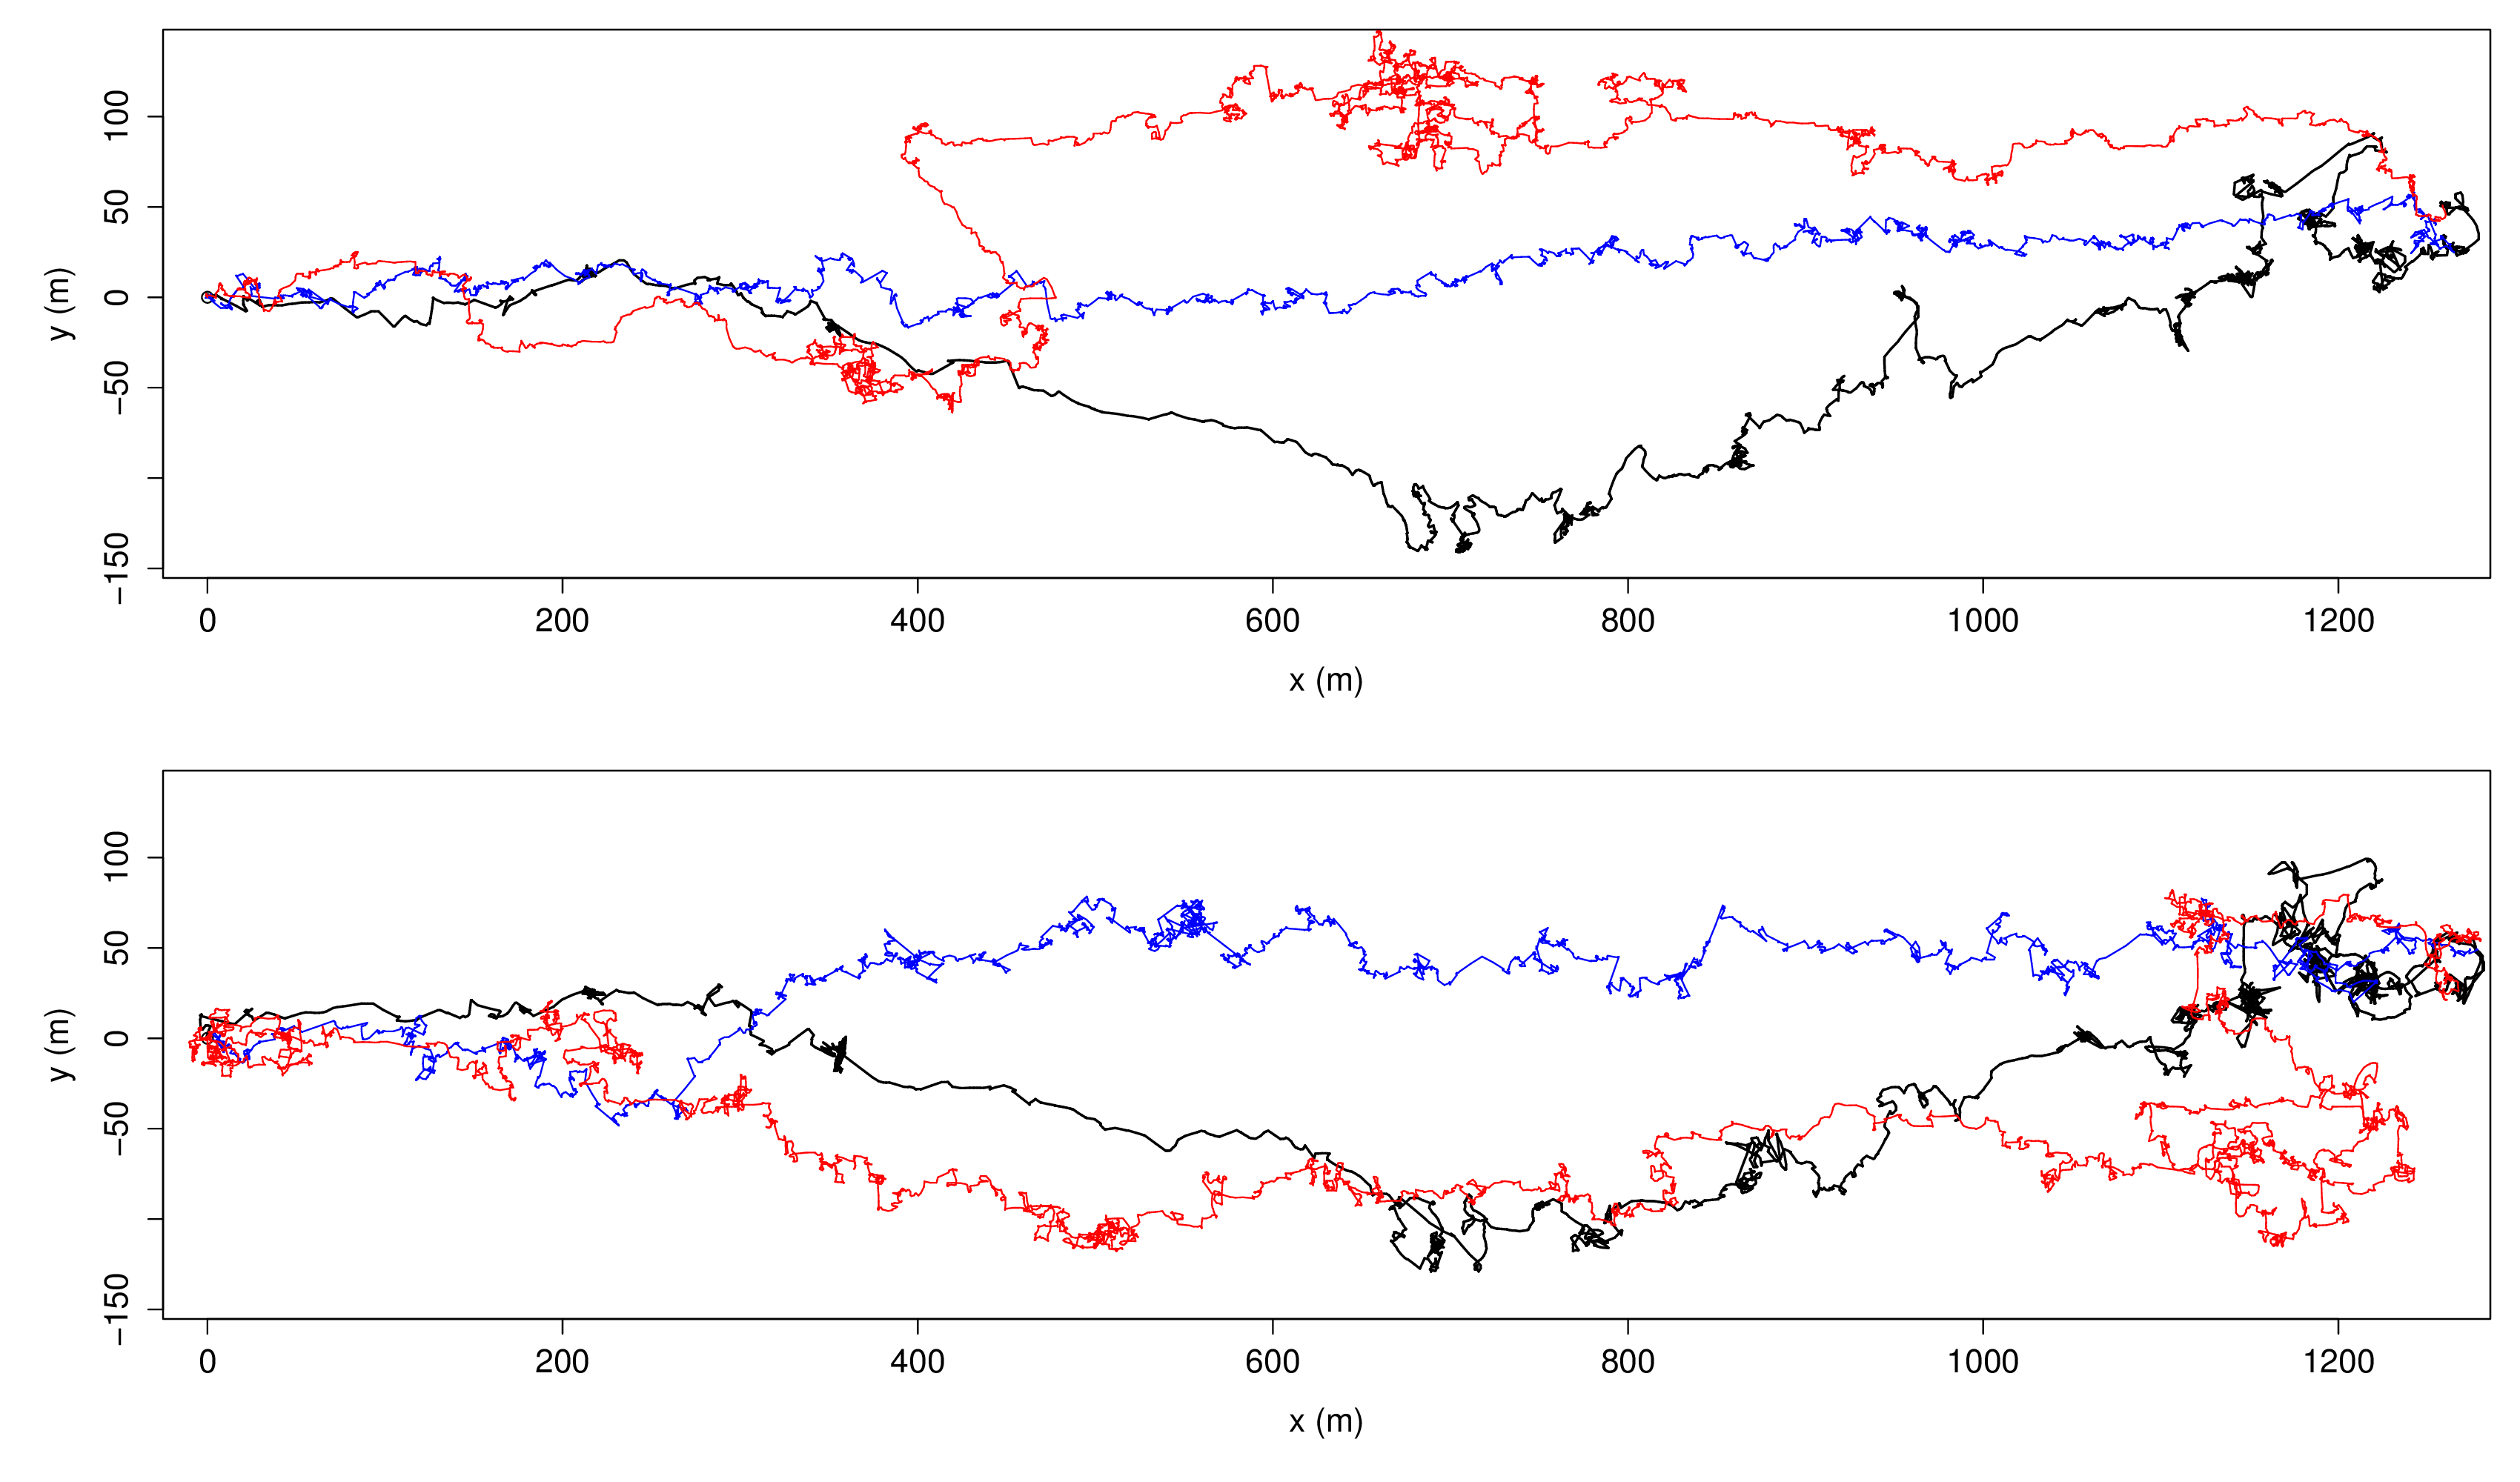
In the second step, we generate pairs of statistically realistic null-model trajectories which start and end at the same locations as observed, but which are otherwise statistically independent of one another. To do so, we turn to a class of constrained randomisations termed surrogate data techniques to generate synthetic trajectories [64, 65, 66]. The primary advantage of data surrogates over standard shuffling methods is that they conserve within-trajectory correlations – such as those within the sequence of displacements that make up each trajectory – and so produce more realistic trajectories (Fig. 1, see Supplemental Information for further details).
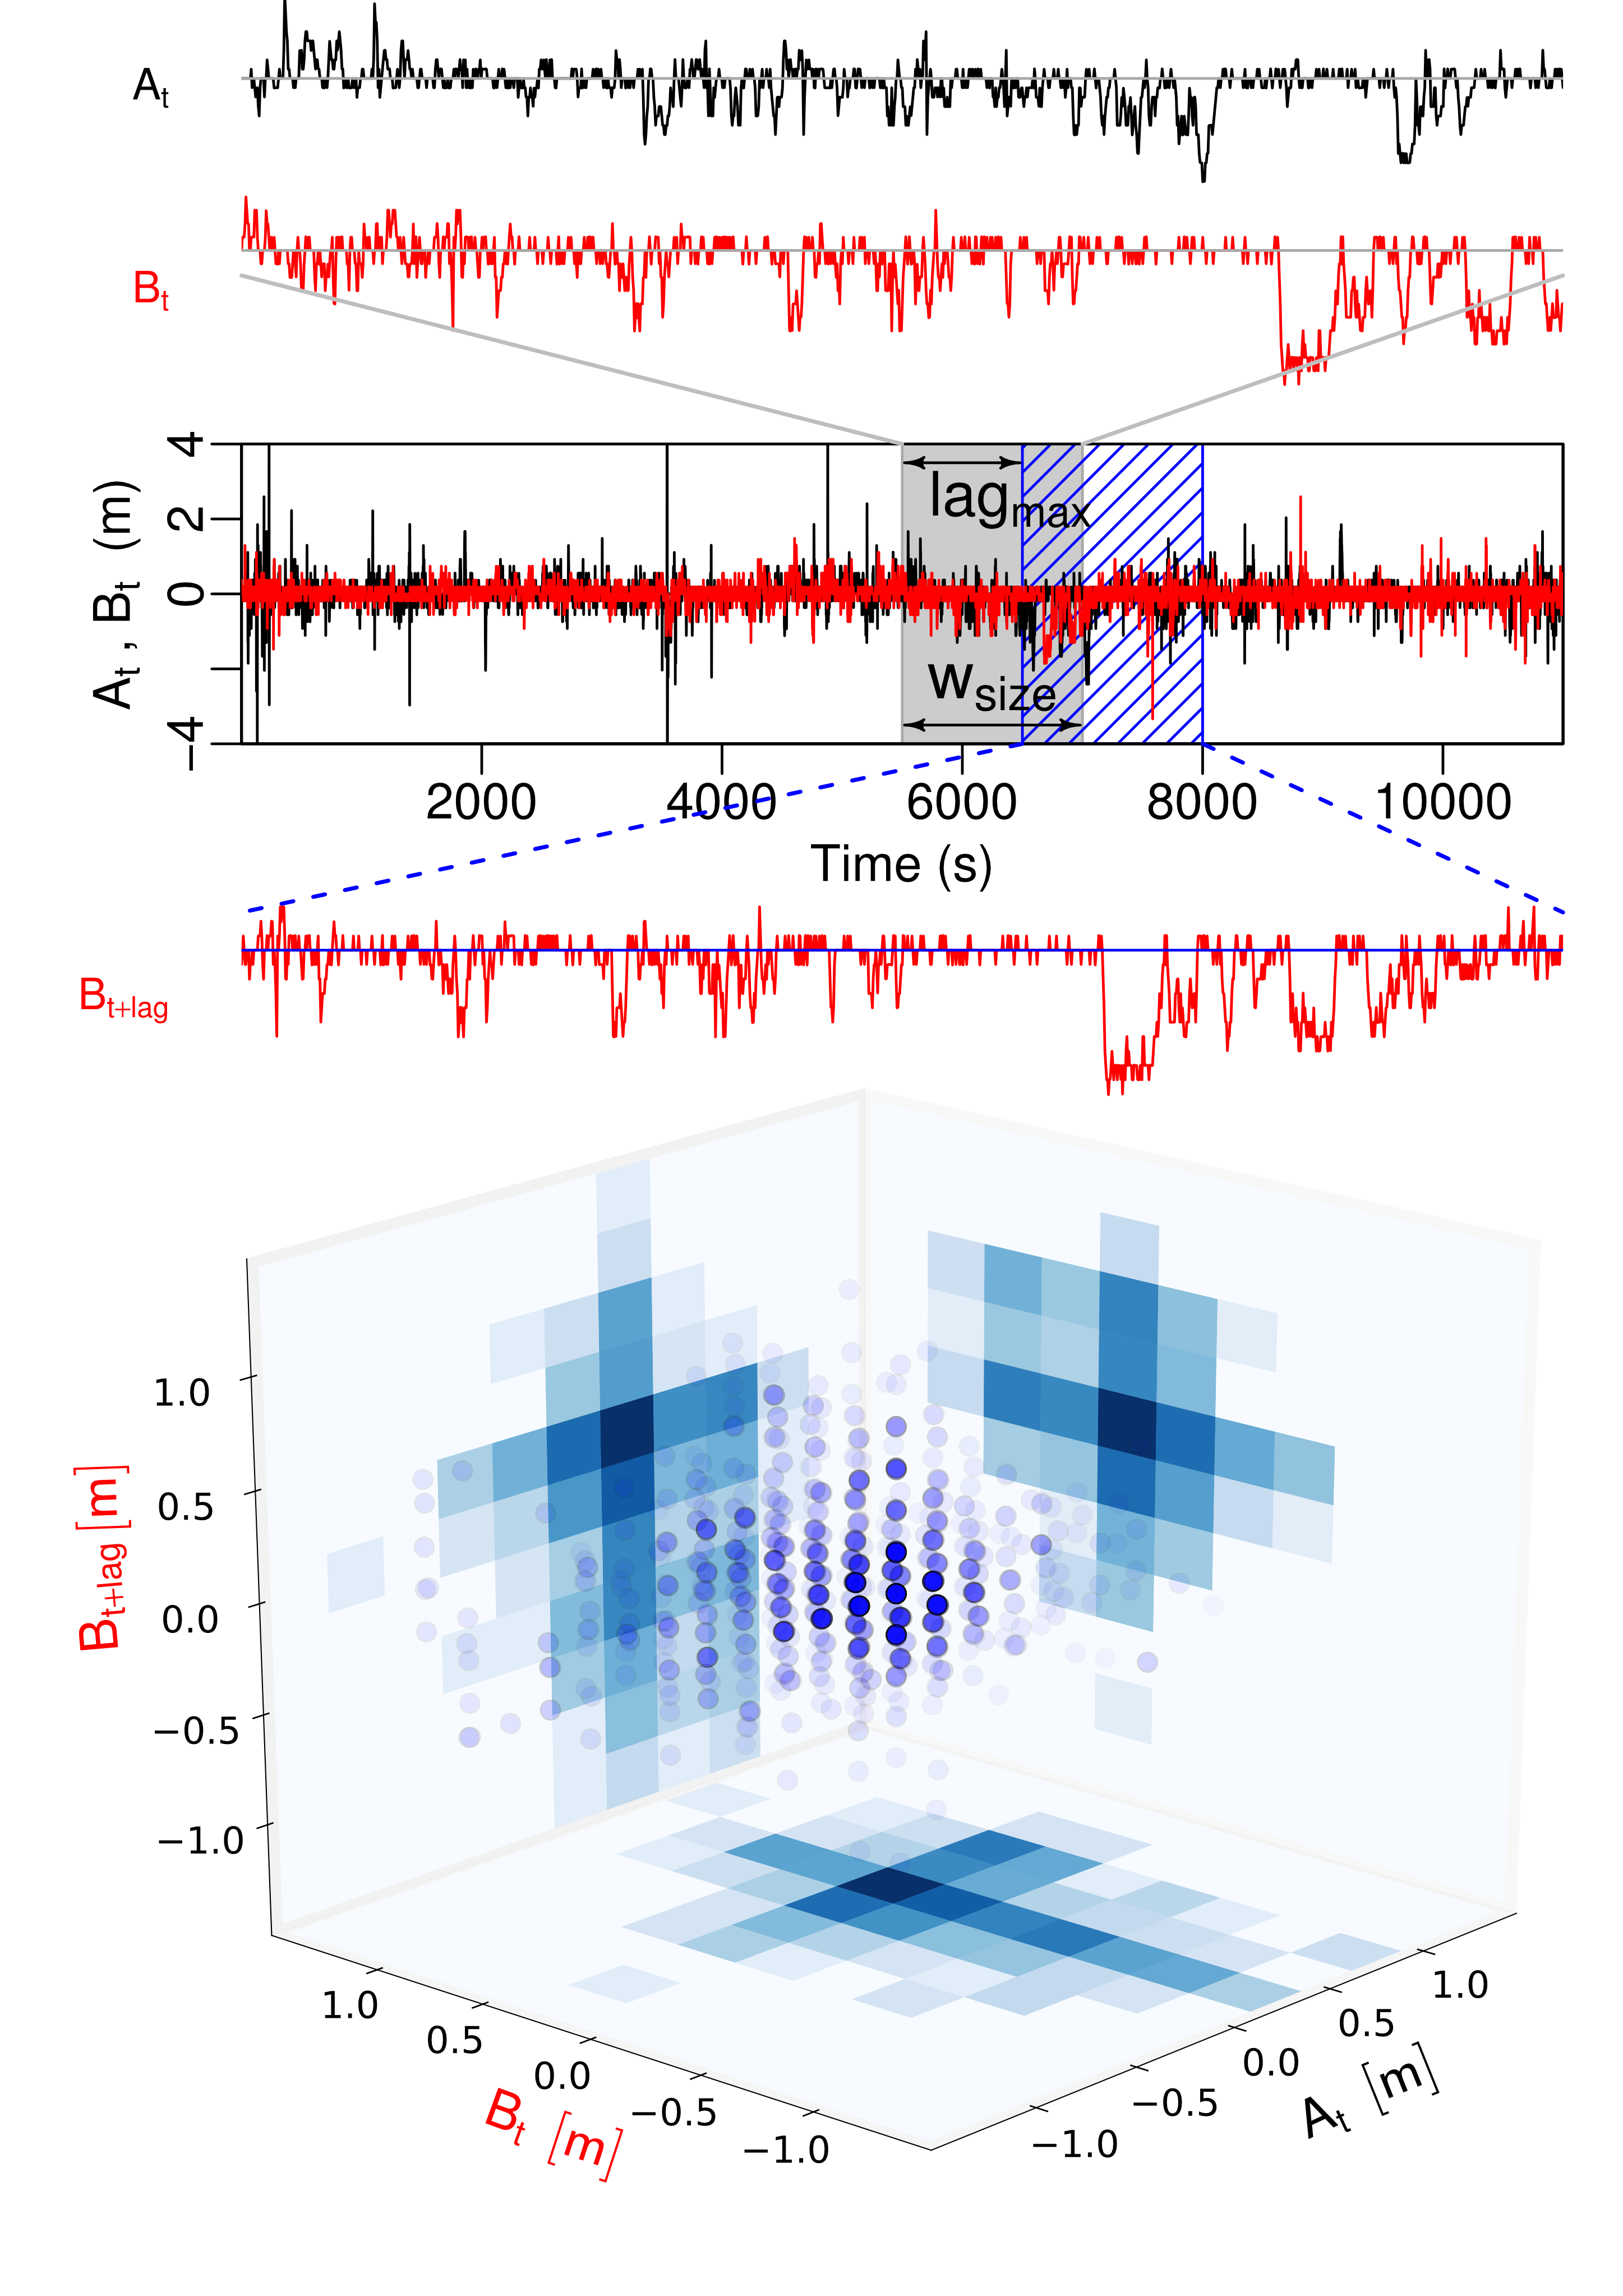
In the third step, the net coupling direction and the coupling magnitude between and are obtained by comparing the directional information flows between the paired time series, , and , from which we assign a causal direction to their interactions; if the aggregate information flow is predominantly , then the movement of is driven by the prior actions of , hence influences . To quantify directional information flows we calculated the Mutual Information and the Conditional Mutual Information (henceforth, MI & CMI) between the two trajectories [36, 37].
Although inference of the coupling direction can be made using time-lagged correlations, such as Pearson’s , such approaches inherently assume a linear drive-response relation. As we do not wish to make any a priori assumptions regarding the functional form of the dependency between the displacements of the putative driver and those of the responder, we use entropic measures [67, 68] of the dependence between paired (bivariate) distributions which, unlike correlations, do not make assumptions about the functional form (e.g. linearity) of the dependence (Fig. S2). In contrast with parametric and non-parametric measures of correlation, information-theoretic measures of dependence unveil relationships not between paired values of predictor and response, but instead compare the information held within their joint (bivariate) distribution that cannot be derived from their marginal distributions.
In short, the MI quantifies how much the current state of a given time series, (the putative driver) reduces the uncertainty in the future state of a partner, (the putative follower), and so provides an estimate of the coupling strength between paired time series. This coupling is denoted . However, as the MI from the present to the future is symmetrical to MI from the future B to the present A, , the MI contains no inherent direction information. For a directional measure of information transmission from one time series to another, or in other words, how much the first influences the second, we use the CMI, . Like the MI, the CMI measures information transmission from to , whilst also including a conditional term describing the current actions of the putative follower, . This removes any self-influence of the putative follower upon its future actions, with the residual measure quantifying the influence of the current actions of the putative driver upon the putative follower. This process is illustrated in Fig. 2. For simplicity, the CMI from to will be written . An important outcome of the conditionality term in the CMI is that, unlike the MI, the information flow is no longer symmetrical; . Hence, by comparing the asymmetry of the two directional CMI flows within a pair with the summed flow in both directions, thus,
we obtain the net normalised information flow, termed directionality (Rosenblum & Pikovsky, 2001). This measure thus allows the inference of the causal role of ‘drivers’ by measuring the degree to which their movements influence the future movements of others (‘responders’), rather than through their relative spatial position within the moving group.
Lastly, in the final stage of the framework the observed and expected directionalities (from the ensembles of surrogate trajectories) are statistically compared using two-tailed randomisation tests. These results are presented in the next section.
Coupling is intermittent and reversible
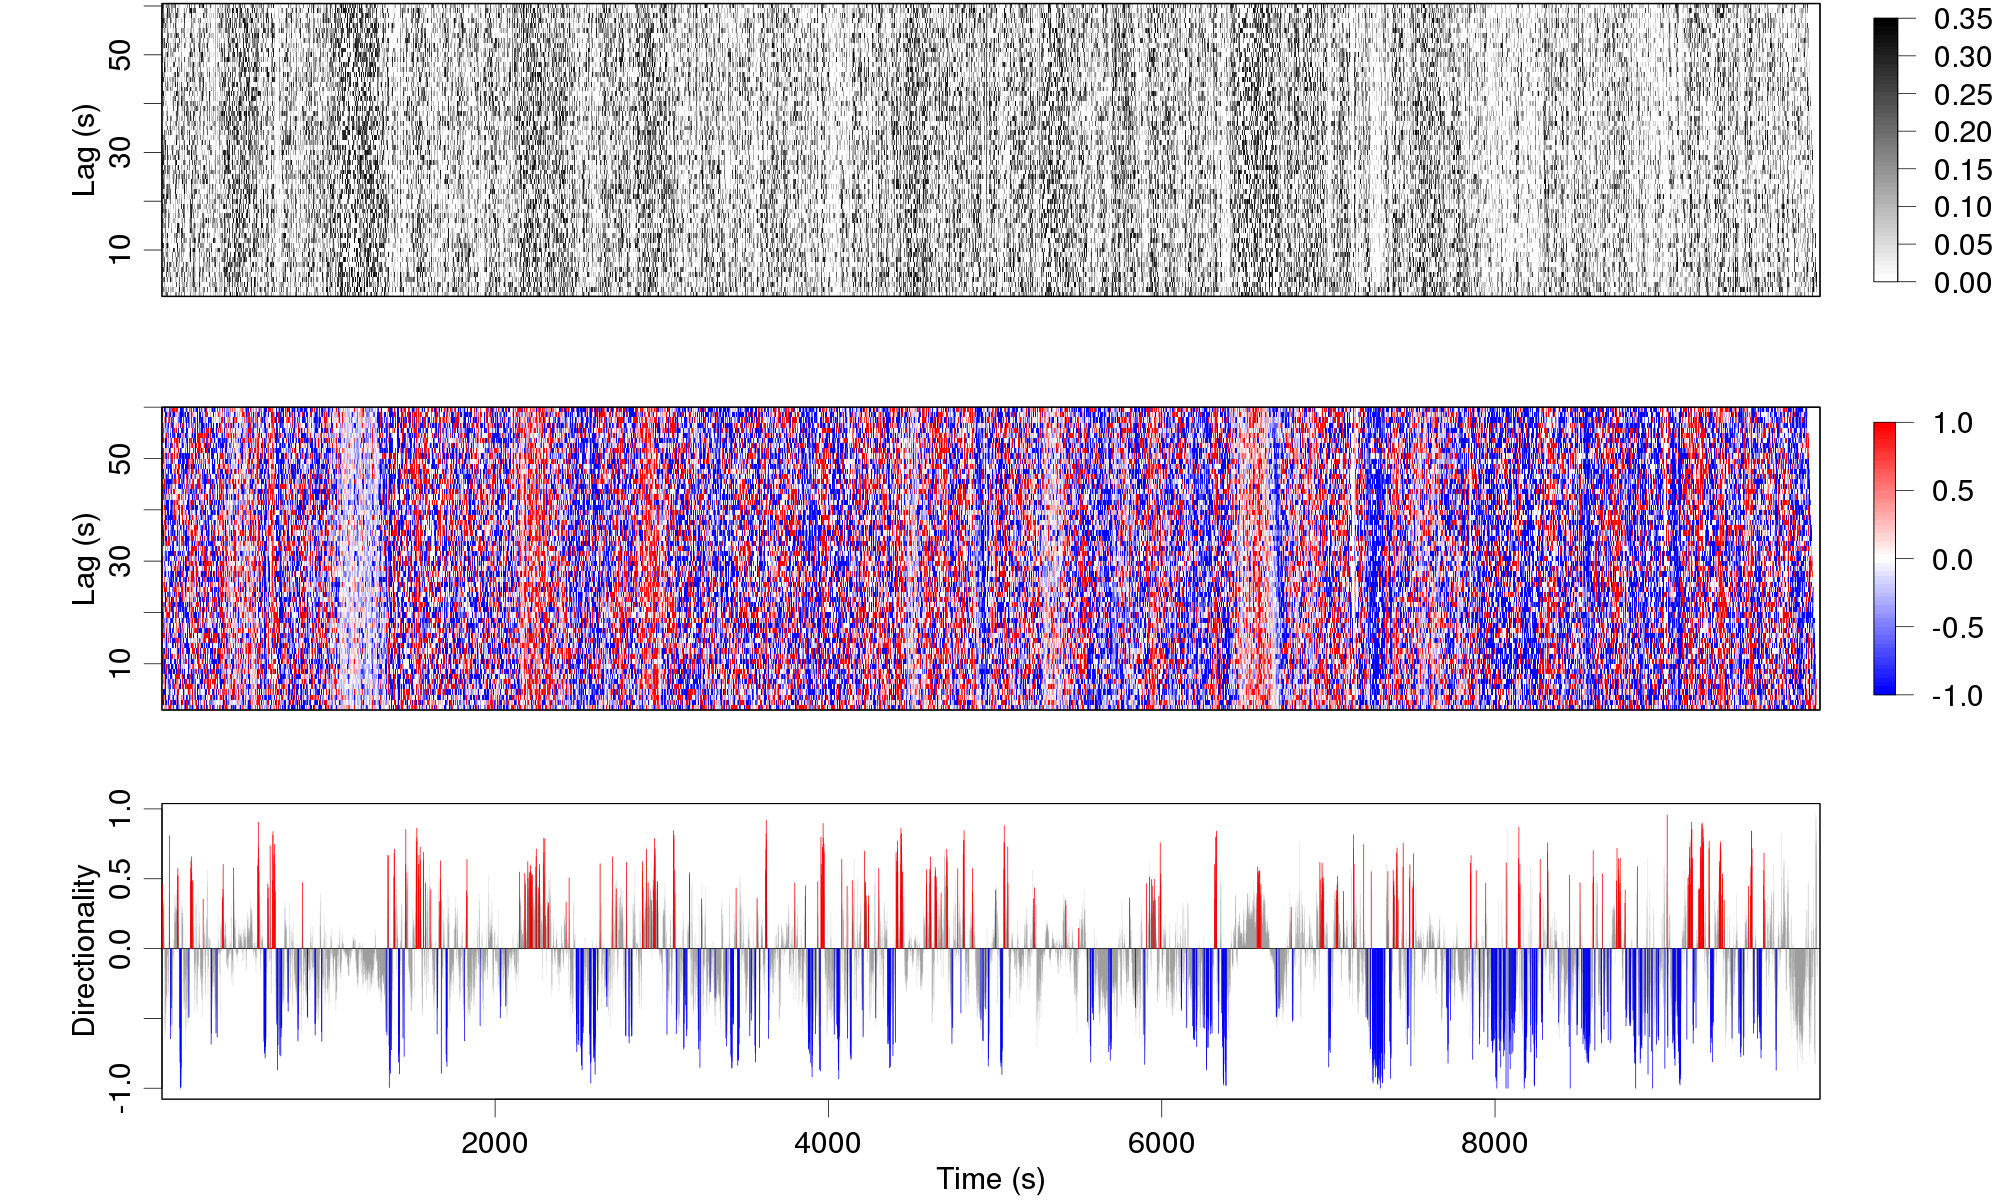
By extracting a near-continuous and signed (rather than binary) dynamical coupling metric for pairs, and in combination with the comparison to the ‘null’ trajectory pairs generated by the data surrogates procedures, we are able to test the first null hypothesis; that within a single foraging bout, pairwise coupling does not alternate. This hypothesis would be rejected in one of two cases, (i) if only one individual in the pair exhibited periods of statistically significant coupling which were interspersed by periods of no coupling, and (ii) if statistically significant coupling alternates from one individual to the other. We used a two-tailed randomisation test to compare the observed directionality at each time step with the distribution of directionalities obtained from the surrogate pairs, to establish whether the observed directionality represented a statistically significant coupling event. For each session we then found the overall proportion of time steps in which statistically significant coupling was observed (Table 1). As for all sizes of sliding window (except the smallest), this proportion was above chance levels (5%), the null hypothesis of time-constant coupling between the members of the pair could be rejected. In sum, for pairs of foraging meerkats, the causal drive-response relationship was neither of fixed magnitude, nor constant in direction (Fig. 3). In other words, both the strength of influence the driver exerts over the responder and the identity of the driver itself vary over time.
Rapid decay of information flow with increasing time delay
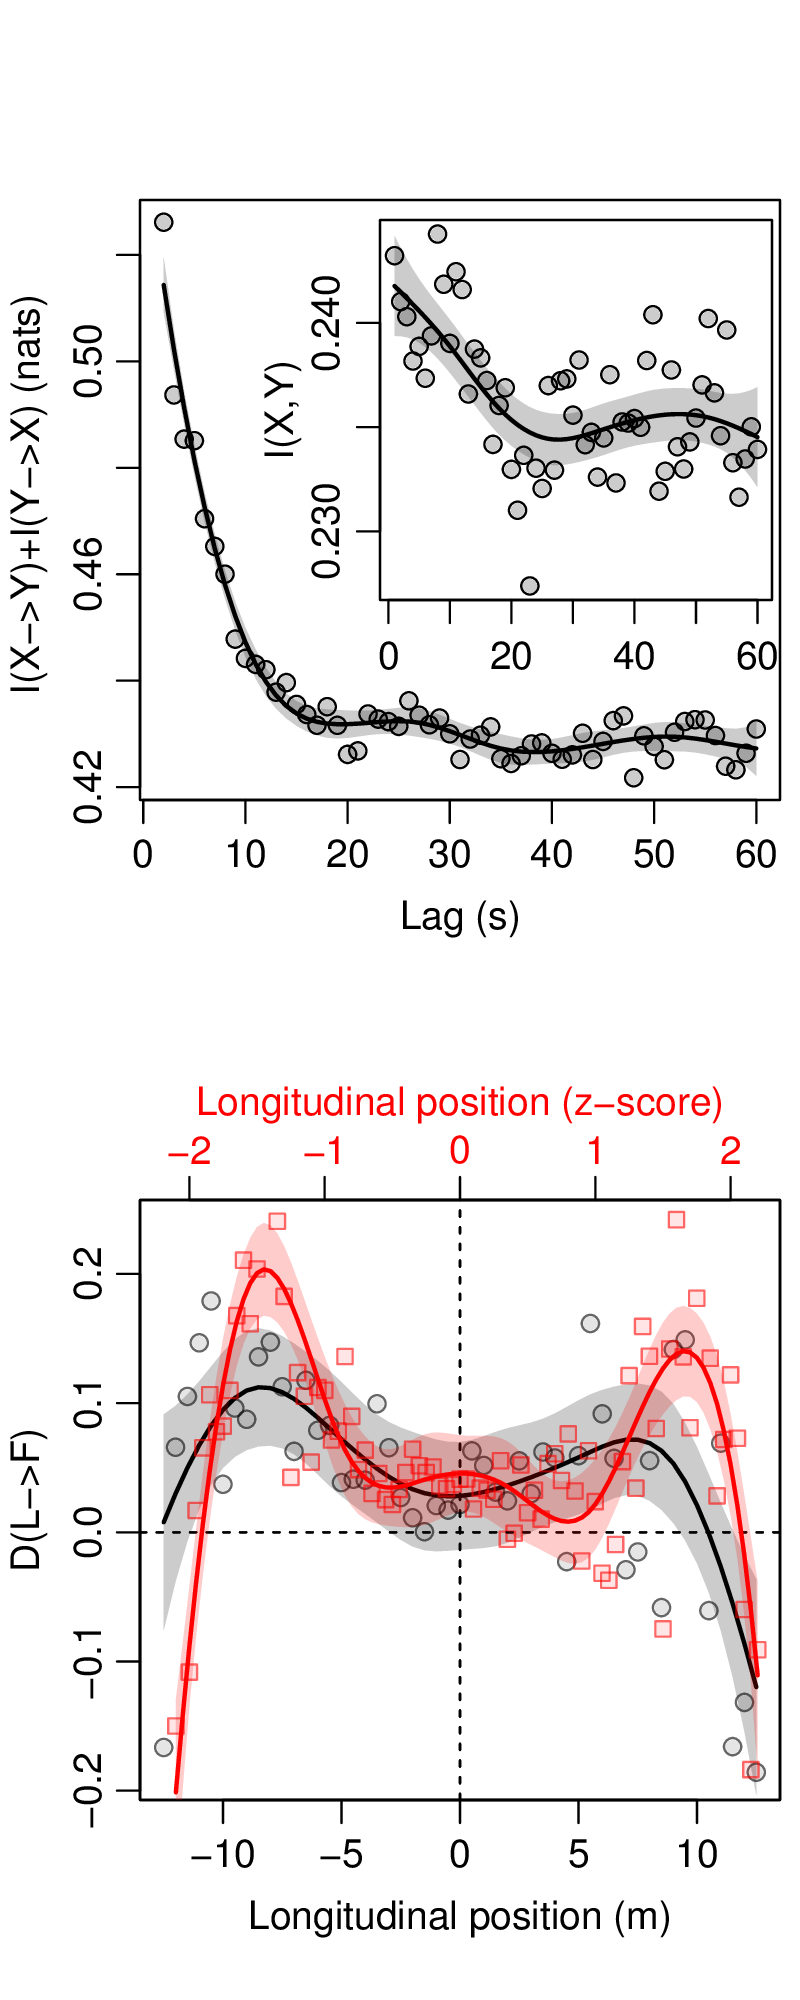
We observe a fairly rapid decay in the MI as a function of the time lag, which indicates the absence of long term correlations between the pair; all evidence of coupling is lost after a delay greater than about 20 seconds. However, the relationship is subject to considerable noise (inset of Fig. 4a). For the reasons described at the beginning of this section, the MI alone is insufficient for a complete description of the net influence of one animal upon the other. Hence to measure the net information flow of each animal upon its partner (excluding the self-influence of each recipient upon itself), we measured the CMI. As this is not symmetrical, , and as here we are only interested in examining how the total information exchange varies according to the time-delay between the cause and effect, we sum the two directional CMIs (Fig. 4a), which shows a much cleaner decay. The decay of the information transmission with increasing time-lag indicates that a foraging meerkat responding to another individual may react to the movements of that driver up to about 15 seconds in the past, but that movements beyond this time horizon have no influence, and hence are probably not remembered.
Driving from the rear
We now turn to our second hypothesis; that the predominant direction of information flow is from the individual at the front to the one in the rear [20, 21, 24]. Were this the case, we should find that an individual towards the front of the moving group should transfer information to those behind, and relative longitudinal position (LP) alone would be the sole determinant of the coupling direction. Then one would expect that as animal A moves from rear to frontal positions (LP distance 0 to LP distance 0), also shows a monotonic increase from negative (responding) to positive (driving). By contrasting the driver-responder designations given by the relative spatial position with those derived from the causative relationships, we are able to explicitly measure the information each animal transmits to the others in the group, as a function of its relative spatial position. For each pair we calculate the mean directionality across the entire trajectory, and use the sign of this average to identify one member of the pair as the overall driver, . By implication we define the other as the overall responder, (here we use L and F in analogy with driver and responder to avoid potential confusion of the driver with the directionality, D). The second null hypothesis – that the directionality is greatest when the driver is at the leading edge of the moving group – could then be tested. The observed relationship of as a function of the relative longitudinal position of was neither positive nor linear (Fig. 4b). To characterise these non-linear relationships, we used penalised splines because of their flexibility, and because they provide a data-driven non-parametric estimate of the relationship, without making any prior assumptions about its functional form [69]. Although the spline fits are provided mainly as a guide to the eye, and to highlight discontinuities in the information flow, they did provide statistically reasonable fits; for all plots the smoothed terms were significant at the p0.005 level, and typically explained over half of the variance (mean adjusted R-squared=0.58). The spline fits highlight two peaks in the directionality; one when the driver was at the front – as expected – but also a peak at the rear. The peak at positive LP values shows that, indeed, the individual in the front of the pair does influence the one in the rear, however, this fact alone does not allow us to confirm the second null hypothesis. Rather, the peak at negative LP values indicates that information may also propagate from the rear to the front, which leads to a rejection of the second null hypothesis. Further, we note that at extreme values of the LP, the directionality rapidly switches from positive to negative. More specifically, an individual that is 7.5-10 metres in front of the pair’s centre (that is 15-20 metres ahead of the other individual) strongly influences the trailing partner, yet if it gets any further ahead the roles swap, and it instead becomes reactive to the movements of the trailing individual. The converse is true for a trailing individual that falls too far behind its pair partner. To ascertain whether the observed peaks in are meaningful, we performed the same driver identification process as described above but for each surrogate trajectory pair. We thus operationally define one individual in the surrogate pair to be the driver, , and so obtain the expected directionality of the individual that – in the absence of any coupling – appears to drive, namely, , which can then be directly compared to . We observe that (i) the observed peaks are far outside the value of their surrogate counterparts, and (ii) between -5 m and +5 m from the pair’s centre, is typically not significantly different from , meaning that there is little to no net information flow within this zone. Hence we accept that the influence an individual exerts upon its conspecific strongly depends upon its relative spatial position within the pair (Fig. LABEL:fig:FLOW_VS_FB__DISTb).
Discussion
We have shown the existence of dynamical alternation of pairwise driver-responder roles within moving animal pairs, so we cannot reject the null hypothesis that within-bout pairwise drive-response relationships are fixed. The directionality time series contain periods of significant deviation from the expected value of zero, and visual inspection indicates that the periods in which either one or the other animal showed statistically significant coupling are somewhat clustered. Indeed, the temporal statistics of the directionality (see Supplemental Information) show the presence of non-trivial (positive) temporal correlations, which indicate that the coupling relationship does exhibit non-random temporal persistence. This fluctuation in both the identity of the driver and the strength of its influence upon the other group member should be viewed within the context of the relative spatial position. Within a single foraging bout, an individual meerkat may occupy many different positions within the moving group, hence for any given position there is a considerable turnover of individuals. It is then natural that – given the observed relationship between position and directionality – its influence upon the other group members should wax and wane. The non-linear form of the relationship between relative spatial position and directionality may reflect the existence of an underlying set of “rules of thumb” underlying individual (and therefore also collective) movement [70, 71]. For example, the front and rear directionality peaks represent positions (at the leading or trailing edge of the moving group, respectively), at which the motion of a given individual has the greatest causative influence upon the other member of the pair. Such positions might represent zones within the moving group within which biologically-relevant events occur – such as discovery of new food items (front) or predator attacks (back). Hence, these are zones to which individuals may be dynamically attracted or repelled depending upon the movements of their conspecifics or the occurrence of heterospecifics. Similarly, the switch from being highly influential to becoming highly reactive (positive to negative directionality) that occurs beyond these peaks may be related to an individual tendency to reorient towards the group centre beyond some threshold distance. This phenomenon can be seen as the signature of some underlying interaction mechanism that functions to maintain group cohesion.
Clearly, the social activities of a group-living animal occur within a space consisting of much more than one degree of freedom. Yet the CMI-based approach was able to identify drive-response behaviours solely through examination of paired but univariate time series, namely the sequence of displacements within only a single axis of motion (Table 1). In systems with many interacting degrees of freedom, only a few may be experimentally accessible. In such cases, investigators may acquire a reasonable picture of the overall system dynamics by measuring the information flow on one of those degrees of freedom – something that promises to simplify future investigations (see also [72]). Additionally, the time series used for analysis could in principle come from any source, and one could readily examine the information transmission between various data sources, for example the influence of animal vocalisations on acceleration measurements. The overwhelming majority of studies on information transmission in animal groups, have not measured the information transmission per se, but instead measured the dissemination of some proxy, typically the alignment correlation [73, 41, 38, 74, 21, 24, 42, 43, 53, 75]. Although the presence of such correlations do indeed suggest that information has been transmitted (and hence that claims of coupling based on measures of correlation are legitimate), the presence of information transmission does not always produce a correlation [76]. This means that studies employing classical correlation-based methods may suffer from a bias towards the refutation of information-transmission hypotheses, that is, an increased type-II error rate. Future studies should consider the use of information-theoretic measures to maximise the chances of capturing cause and effect in animal groups.
It is important to bear in mind the caveat that the inferences drawn above are based on measuring the coupling between pairs of individuals within much larger groups. Whilst the pairwise information plots do show strong evidence for directional coupling – that is for the presence of driver and responder roles within pairs – it could also be that other individuals within the group (i.e. untagged meerkats, about which we had no GPS data), or stimuli external to the group (e.g. heterospecific warning calls), were actually driving one or both of the tagged individuals. Nevertheless, interdependencies between individuals far down the group movement chain are still to be expected [22], and what we describe as direct coupling is indeed the sum of both direct and indirect influences. In the present case, it is likely that direct influences prevail, since we observed only dominant pairs (see Methods) and direct interactions within the dominant pair are common (e.g. in the case of mate guarding [77]). Importantly, there are factors affecting group coordination in meerkats that we did not observe, such as interindividual vocalisations [78, 60]. Whilst the discrete and sporadic nature of vocalisations makes them challenging to study in combination with continuous movement data, future work will explore the link between these two dimensions of collective behaviour in meerkat groups.
It is also worth noting that whilst the directionality does capture the asymmetry of information flow between a given pair of animals, it does not imply anything about the routes by which causative influence propagates. For example, it is possible that, rather than representing direct action-reaction interactions between a leader and a follower, many of the statistically significant interactions we detect actually represent unseen and indirect ‘domino’ sequences, that is, chains of intermediaries through which the initial actions of the leader propagate. More explicitly, the effect of sampling single pairwise interactions within larger groups, combined with the presence of possibly indirect causative chains, is that rather than representing a direct causative relationship, from a leader, , to a follower, , (or to ), we instead sample two – potentially downstream – locations within a causative chain. For example, given the chain , we may sometimes measure . A natural extension of the current approach would therefore be to measure the directionality between all unique pairs of individuals in the group, and to then treat these time series as directed and weighted links in a time-explicit social network [21]. Indeed, in cortical neural networks, measures of joint and conditional entropy have proven to be excellent alternatives to classical correlation-based methods for mapping the physical topology of the synaptic connections [61]. Only such a network-based approach can provide a complete mapping of all the pairwise relationships in the group, and only then will it be possible to define the social organisation as characterised by centralised or distributed leadership.
Whilst techniques for determining the directionality of causation based on time-lagged cross-correlations have a strong tradition in neurobiology [52] and economics [45, 79], their use in the behavioural sciences is comparatively infrequent, mainly because in behavioural research hypothesis testing is typically undertaken using controlled experimental manipulations. Using the general framework described herein, one could for example in pilot studies generate working hypotheses that may then be experimentally tested. This work should be seen not as an alternative, but as a supplemental approach to the gold standard of experimental manipulation. We have provided the basic elements for a more complete quantification of pairwise dependencies in groups, which we hope will facilitate mapping of the dynamical patterns of connectivity within animal societies.
Methods
Study system
Individual movement data were acquired from a wild population of meerkats at the Kalahari Meerkat Project, South Africa (2658’S, 2149’E). For a detailed description of the study site see [80]. The GPS collars were attached on a day at least one week prior to data collection, during which the individuals were then caught and anaesthetised according to the protocol described by Jordan et al. [81]. A single GPS recording session involved attaching a GPS tag to the pre-fitted collars worn by the dominant male and female in a group, as dominant individuals have been shown to have the greatest influence on group movement [82]. These individuals were then allowed to forage as usual. The six GPS sessions were acquired from five meerkat groups (Aztecs, DrieDoring, Frisky, Lazuli & Whiskers) comprising 9-14 individuals, between 10th-19th November 2008. Each session commenced at 6:30 a.m., and lasted approximately 2 hours 40 mins (median 9610 seconds). The GPS tags acquired latitude and longitude positions with a frequency of one fix per second; further details on the GPS tagging method are provided in the Supplemental Information.
Using relative spatial position to identify leading individuals
Our second null hypothesis concerns the relation between direction of information transmission and individual spatial position within the moving group. We first describe a technique to estimate the front and rear positions of each member of the focal pair relative to the other, which we term the relative longitudinal position, LP. Specifically, we infer from the two focal trajectories a raw “group” trajectory by computing the barycentric position of the focal pair of individuals. This trajectory consists of alternating quasi-static (e.g. both individuals foraging within a patch) and dynamical periods (e.g. at least one individual moving between patches). Whilst the GPS-inherent measurement error is not a problem during dynamical periods, it results in spurious scatter around the real location of the estimated focal pair barycentre during static periods, which yields erroneous trajectory estimates. In order to extract the global shape of the focal pair trajectory whilst avoiding overfitting of the noise during the static periods, we use a low-order approximation (least-squares fitted B-spline) of the pair’s barycentric trajectory. The degree of the spline is chosen in each session as the minimal degree that reproduces essential components of the trajectory, such as loops and fast direction changes. As such, it varies as a function of the tortuosity of the recorded trajectory (with straighter paths allowing for the selection of lower degrees), with across the 6 sessions. For each time step, we then project the position of the two individuals onto the corresponding segment of the smoothed trajectory. This way, we obtain a longitudinal position estimate (termed “Leadership index” in Fig. S4 and Video S1) from the signed distance separating the individuals from their projections on the smoothed trajectory (Fig. S3-S5, Video S1).
Observables
Until now, most applications of information-theoretic tools to infer drive-response relationships have measured dependencies within a pair of univariate time series (Wickes et al, 2007). However, as each meerkat trajectory is a bivariate time series corresponding to a sequence of paired displacements within the plane, for a given pair of trajectories there are several alternative observables for which the CMI may be measured. The simplest strategy is to consider only the CMI between the two animals’ movements in a single dimension, that is either the or the displacements. Although considering only one degree of freedom discards half of the available data, it need not necessarily discard the same in terms of the information due to correlations between the displacements in each plane [72]. Hence we measured the CMI for displacements along a single axis to determine whether such a minimal approach sufficiently replicates the patterns captured by CMI analyses that utilise the paired displacements along both axes. A more comprehensive approach is to use each animals’ sequence of paired displacements to calculate its displacements within the plance itself, rather than along a single axis. Here, to measure the displacement within the plane, we calculated the familiar Euclidian distance (or Euclidian norm), , and the maximum norm, , also known as the Chebyshev distance. The coupling between these two time series could then be calculated as before.
Use of sliding windows to extract the CMI
The conditional mutual information was extracted from each pair of trajectories using two sliding windows of fixed width, . The first, spanning the interval , was used to define a subsection of the two predictor variables, and . The second window defined the movement of the putative follower at time steps in the future, , and spanned the interval . Then, for each of the individual increments of the first moving window (covering and ), the second window is repeatedly incremented forward from the current time step, , up to some maximum lag in the future, . Thus, for a given lag the second window, defining the future response of the putative follower, covers . This repeated forwards-incrementing of the second window at each increment of the first allows the influence of the putative driver on the future responder follower to be measured over a range of temporal scales (see Fig.2. To best utilise the high GPS recording frequency (1 Hz), both time windows were incremented in steps of one second, . If N represents the number of time steps in a trajectory then the incrementing process produces a matrix of columns representing the increments of the first window, and rows representing the increments of the second (Fig. 3), which we term the lag-specific CMI. To obtain a single value of directional information transmission for each time step, , the mean or ‘lag-averaged’ CMI is taken across all lags considered:
| (1) |
Assigning statistical significance
After obtaining some measure of directional information flow for a given pair of animals, it is desirable to assign some degree of statistical significance to the deviations from the null expectation. That is, if one is to state that any observed deviations from zero directionality are statistically significant (at a given alpha level), one must reject the null hypothesis that the observed directionality is outside the distribution of directionalities. The latter represents an ensemble of directionalities generated from pairs of null trajectories that retain the same start and end coordinates but do not exhibit any coupling.
For our null model, it is necessary to generate an ensemble of ‘random’ trajectory realisations, against which the observed data are compared. For such a null model we generate data surrogate [64, 65] trajectories. Although these random trajectories start and end at the same locations as the observed trajectories, the information transmission between pairs of such surrogate trajectories is zero by construction. Hence they represent an appropriate null model against which to test for the presence of such coupling in the observed trajectories (See Supplemental Information for a detailed description of the creation of surrogate trajectories).
Following [65], for each trajectory pair we generated 100 surrogate trajectory pairs. Then, for each time step, we conducted a two-tailed test of the null hypothesis that the observed value of was drawn from the expected (surrogate) distribution; if the observed value was outside the percentiles of the expected distribution, the null hypothesis was rejected (at the 0.05 level), and the existence of drive-response roles concluded.
Acknowledgements
The authors wish to acknowledge Tim Clutton-Brock for access to habituated animals and long-term records of individual life-histories, and also D. Garcia, A. Garas and T.C-B. for useful comments and discussions. We also wish to thank the Kalahari Research Trust for use of the site, and station managers Robert Sutcliffe and David Bell.
References
- [1] Bazazi S, Bartumeus F, Hale J, Couzin I (2012) Intermittent motion in desert locusts: Behavioural complexity in simple environments. PLoS Comput Biol 8:e1002498.
- [2] Grégoire G, Chaté H, Tu Y (2003) Moving and staying together without a leader. Physica D 181:157–170.
- [3] Rands S, et al. (2003) Spontaneous emergence of leaders and followers in foraging pairs. Nature 423:432–434.
- [4] Rands S, Cowlishaw G, Pettifor R, Rowcliffe J, Johnstone R (2008) The emergence of leaders and followers in foraging pairs when the qualities of individuals differ. BMC Evol Biol 8:51.
- [5] Grégoire G, Chaté H (2004) Onset of collective and cohesive motion. Phys Rev Lett 92:25702.
- [6] Couzin I, Krause J, Franks N, Levin S (2005) Effective leadership and decision-making in animal groups on the move. Nature 433:513–516.
- [7] Conradt L, Krause J, Couzin I, Roper T (2009) “Leading According to Need” in Self-Organizing Groups. Am Nat 173:304–312.
- [8] Sueur C, Deneubourg J, Petit O, Couzin I (2010) Differences in nutrient requirements imply a non-linear emergence of leaders in animal groups. PLoS Comput Biol 6:e1000917.
- [9] McClure M, Ralph M, Despland E (2011) Group leadership depends on energetic state in a nomadic collective foraging caterpillar. Behav Ecol Sociobiol 65:1573–1579.
- [10] Furrer R, Kunc H, Manser M (2012) Variable initiators of group departure in a cooperative breeder: the influence of sex, age, state and foraging success. Anim Behav 85:205–212.
- [11] Tóth Z, Griggio M (2011) Leaders are more attractive: birds with bigger yellow breast patches are followed by more group-mates in foraging groups. PLOS ONE 6:e26605.
- [12] Harcourt J, Ang T, Sweetman G, Johnstone R, Manica A (2009) Social feedback and the emergence of leaders and followers. Curr Biol 19:248–252.
- [13] Nakayama S, Harcourt J, Johnstone R, Manica A (2012) Initiative, personality and leadership in pairs of foraging fish. PLOS ONE 7:e36606.
- [14] Nakayama S, Stumpe M, Manica, A. Johnstone R (2013) Experience overrides personality differences in the tendency to follow but not in the tendency to lead. Proc R Soc Lond B Biol Sci 280:20131724.
- [15] Lewis J, Wartzok D, Heithaus M, Krützen M (2013) Could relatedness help explain why individuals lead in bottlenose dolphin groups? PLOS ONE 8:e58162.
- [16] Reebs S (2000) Can a minority of informed leaders determine the foraging movements of a fish shoal? Anim Behav 59:403–409.
- [17] Pillot M, et al. (2010) Moving together: Incidental leaders and naïve followers. Behav Processes 83:235–241.
- [18] Bousquet CA, Manser MB (2011) Resolution of experimentally induced symmetrical conflicts of interest in meerkats. Animal Behaviour 81:1101–1107.
- [19] Stroeymeyt N, Franks N, Giurfa M (2011) Knowledgeable individuals lead collective decisions in ants. J Exp Biol 214:3046–3054.
- [20] Bumann D, Krause J (1993) Front individuals lead in shoals of three-spined sticklebacks (gasterosteus aculeatus) and juvenile roach (rutilus rutilus). Behaviour 125:3–4.
- [21] Nagy M, Ákos Z, Biro D, Vicsek T (2010) Hierarchical group dynamics in pigeon flocks. Nature 464:890–893.
- [22] Sueur C, Petit O, Deneubourg JL (2009) Selective mimetism at departure in collective movements of macaca tonkeana: an experimental and theoretical approach. Anim Behav 78:1087–1095.
- [23] Sueur C, Petit O (2010) Signals use by leaders in macaca tonkeana and macaca mulatta: group-mate recruitment and behaviour monitoring. Anim Cogn 13:239–248.
- [24] Katz Y, Tunstrøm K, Ioannou C, Huepe C, Couzin I (2011) Inferring the structure and dynamics of interactions in schooling fish. Proc Natl Acad Sci USA 108:18720–18725.
- [25] King A, Johnson D, Van Vugt M (2009) The origins and evolution of leadership. Curr Biol 19:R911–R916.
- [26] Smith J, Foti R (1998) A pattern approach to the study of leader emergence. The Leadership Quarterly 9:147 – 160.
- [27] Dumont B, Boissy A, Achard C, Sibbald A, Erhard H (2005) Consistency of animal order in spontaneous group movements allows the measurement of leadership in a group of grazing heifers. Appl Anim Behav Sci 95:55–66.
- [28] Leca JB, Gunst N, Thierry B, Petit O (2003) Distributed leadership in semifree-ranging white-faced capuchin monkeys. Anim Behav 66:1045 – 1052.
- [29] Squires V, Daws G (1975) Leadership and dominance relationships in Merino and Border Leicester sheep. Appl Anim Eth 1:263–274.
- [30] Peterson R, Jacobs A, Drummer T, Mech L, Smith D (2002) Leadership behavior in relation to dominance and reproductive status in gray wolves, canis lupus. Can J Zool 80:1405–1412.
- [31] Kurvers R, et al. (2009) Personality differences explain leadership in barnacle geese. Anim Behav 78:447–453.
- [32] Thierry B (2007) Unity in diversity: lessons from macaque societies. Evol Anthropol 16:224–238.
- [33] Sueur C, Petit O (2008) Shared or unshared consensus decision in macaques? Behav Processes 78:84–92.
- [34] Jacobs A, Maumy M, Petit O (2008) The influence of social organisation on leadership in brown lemurs (eulemur fulvus fulvus) in a controlled environment. Behav Processes 79:111–113.
- [35] Rosenblum M, Pikovsky A (2001) Detecting direction of coupling in interacting oscillators. Phys Rev E 64:45202–45202.
- [36] Paluš M, Vejmelka M (2007) Directionality of coupling from bivariate time series: How to avoid false causalities and missed connections. Phys Rev E 75:056211.
- [37] Vejmelka M, Paluš M (2008) Inferring the directionality of coupling with conditional mutual information. Phy Rev E 77:026214.
- [38] Cavagna A, et al. (2010) Scale-free correlations in starling flocks. Proc Natl Acad Sci USA 107:11865–11870.
- [39] Janson S, Middendorf M, Beekman M (2005) Honeybee swarms: how do scouts guide a swarm of uninformed bees? Anim Behav 70:349–358.
- [40] Prins H (1995) Ecology and behaviour of the African buffalo: social inequality and decision making (Springer) Vol. 1.
- [41] Buhl J, et al. (2006) From disorder to order in marching locusts. Science 312:1402–1406.
- [42] Herbert-Read JE, et al. (2011) Inferring the rules of interaction of shoaling fish. Proc Natl Acad Sci USA 108:18726–18731.
- [43] Ward AJW, Herbert-Read JE, Sumpter DJT, Krause J (2011) Fast and accurate decisions through collective vigilance in fish shoals. Proc Natl Acad Sci USA 108:2312–2315.
- [44] Wiener N (1956) in Modern Mathematics for the Engineer, ed Beckenback E (McGraw-Hill, New York).
- [45] Granger C (1969) Investigating causal relations by econometric models and cross-spectral methods. Econometrica 37:424–438.
- [46] Suppes P (1970) A probabilistic theory of causality (North-Holland Publishing Company, Amsterdam).
- [47] Michelsen A, Andersen B, Storm J, Kirchner W, Lindauer M (1992) How honeybees perceive communication dances, studied by means of a mechanical model. Behav Ecol Sociobiol 30:143–150.
- [48] Faria J, et al. (2010) A novel method for investigating the collective behaviour of fish: introducing ‘robofish’. Behav Ecol Sociobiol 64:1211–1218.
- [49] Tarcai N, et al. (2011) Patterns, transitions and the role of leaders in the collective dynamics of a simple robotic flock. J Stat Mech: Theory Exp 2011:P04010.
- [50] Marras S, Porfiri M (2012) Fish and robots swimming together: attraction towards the robot demands biomimetic locomotion. J R Soc Interface 9:1856–1868.
- [51] Kampichler C, van der Jeugd H (2012) Determining patterns of variability in ecological communities: time lag analysis revisited. Environ Ecol Stat pp 1–14.
- [52] Knox C (1981) Detection of neuronal interactions using correlation analysis. Trends Neurosci 4:222–225.
- [53] Bode NW, Wood AJ, Franks DW (2011) The impact of social networks on animal collective motion. Anim Behav 82:29 – 38.
- [54] Stueckle S, Zinner D (2008) To follow or not to follow: decision making and leadership during the morning departure in chacma baboons. Anim Behav 75:1995–2004.
- [55] Sueur C (2011) Group decision-making in chacma baboons: leadership, order and communication during movement. BMC Ecol 11:26.
- [56] Burns A, Herbert-Read J, Morrell L, Ward A (2012) Consistency of leadership in shoals of mosquitofish (gambusia holbrooki) in novel and in familiar environments. PLOS ONE 7:e36567.
- [57] Van Belle S, Estrada A, Garber PA (2012) Collective group movement and leadership in wild black howler monkeys (alouatta pigra). Behav Ecol Sociobiol October 2012:1–11.
- [58] Guttal V, Couzin I (2010) Social interactions, information use, and the evolution of collective migration. Proc Natl Acad Sci USA 107:16172–16177.
- [59] Franks N, Richardson T (2006) Teaching in tandem-running ants. Nature 439:153–153.
- [60] Bousquet C, Sumpter D, Manser M (2011) Moving calls: a vocal mechanism underlying quorum decisions in cohesive groups. Proc R Soc Lond B Biol Sci 278:1482–1488.
- [61] Garofalo M, Nieus T, Massobrio P, Martinoia S (2009) Evaluation of the performance of information theory-based methods and cross-correlation to estimate the functional connectivity in cortical networks. PLOS ONE 4:e6482.
- [62] Wibral M, et al. (2011) Transfer entropy in magnetoencephalographic data: Quantifying information flow in cortical and cerebellar networks. Prog Biophys Mol Biol 105:80–97.
- [63] Wang X, Miller J, Lizier J, Prokopenko M, Rossi L (2012) Quantifying and tracing information cascades in swarms. PLOS ONE 7:e40084.
- [64] Prichard D, Theiler J (1994) Generating surrogate data for time series with several simultaneously measured variables. Phys Rev Lett 73:951–954.
- [65] Schreiber T, Schmitz A (2000) Surrogate time series. Physica D 142:346–382.
- [66] Pereda E, Quiroga R, Bhattacharya J (2005) Nonlinear multivariate analysis of neurophysiological signals. Prog Neurobiol 77:1–37.
- [67] Shannon C (1948) A mathematical theory of communication. The Bell System Technical Journal 27.
- [68] Mann R, et al. (2011) Objectively identifying landmark use and predicting flight trajectories of the homing pigeon using gaussian processes. J R Soc Interface 8:210–219.
- [69] Ruppert D, Wand M, Carroll R (2003) Semiparametric regression (Cambridge University Press) Vol. 12.
- [70] Couzin I, Krause J, James R, Ruxton G, Franks N (2002) Collective memory and spatial sorting in animal groups. J Theor Biol 218:1–11.
- [71] Rands S (2011) Approximating optimal behavioural strategies down to rules-of-thumb: energy reserve changes in pairs of social foragers. PLOS ONE 6:e22104.
- [72] Wicks R, Chapman S, Dendy R (2007) Mutual information as a tool for identifying phase transitions in dynamical complex systems with limited data. Phys Rev E 75:051125.
- [73] Radakov D, Mills H (1973) Schooling in the ecology of fish (J. Wiley New York).
- [74] Cavagna A, Giardina I (2010) Large-scale behaviour in animal groups. Behav Processes 84:653–656.
- [75] Bialek W, et al. (2012) Statistical mechanics for natural flocks of birds. Proc Natl Acad Sci USA.
- [76] Sugihara G, et al. (2012) Detecting causality in complex ecosystems. Science 338:496–500.
- [77] Spong GF, Hodge SJ, Young AJ, Clutton-Brock T (2008) Factors affecting the reproductive success of dominant male meerkats. Molecular Ecology 17:2287–2299.
- [78] Townsend SW, Zöttl M, Manser MB (2011) All clear? meerkats attend to contextual information in close calls to coordinate vigilance. Behavioral Ecology and Sociobiology 65:1927–1934.
- [79] Podobnik B, Wang D, Horvatic D, Grosse I, Stanley HE (2010) Time-lag cross-correlations in collective phenomena. Europhys Lett 90:68001.
- [80] Clutton-Brock T, et al. (2001) Predation, group size and mortality in a cooperative mongoose, suricata suricatta. J Anim Ecol 68:672–683.
- [81] Jordan NR, Cherry MI, Manser MB (2007) Latrine distribution and patterns of use by wild meerkats: implications for territory and mate defence. Anim Behav 73:613–622.
- [82] Perony N, Townsend SW (2013) Why did the meerkat cross the road? flexible adaptation of phylogenetically-old behavioural strategies to modern-day threats. PLOS ONE 8:e52834.
- [83] Paluš M, Komárek V, Hrnčíř Z, Štěrbová K (2001) Synchronization as adjustment of information rates: detection from bivariate time series. Phys Rev E 63:046211.
| (%) | (%) | (%) | |
|---|---|---|---|
| 5 | 2.7 | 4.6 | 2.8 |
| 10 | 5.6 | 7.9 | 5.7 |
| 15 | 8.9 | 13.1 | 9.7 |
| 25 | 12.7 | 19.5 | 15.6 |
See pages 1-15 of Supplemental_Information.pdf