Magnetization distribution and orbital moment in the non-Superconducting Chalcogenide Compound K0.8Fe1.6Se2
Abstract
We have used polarized and unpolarized neutron diffraction to determine the spatial distribution of the magnetization density induced by a magnetic field of 9 T in the tetragonal phase of K0.8Fe1.6Se2. The maximum entropy reconstruction shows clearly that most of the magnetization is confined to the region around the iron atoms whereas there is no significant magnetization associated with either Se or K atoms. The distribution of magnetization around the Fe atom is slightly nonspherical with a shape which is extended along the direction in the projection. Multipolar refinement results show that the electrons which give rise to the paramagnetic susceptibility are confined to the Fe atoms and their distribution suggests that they occupy 3d t2g-type orbitals with around 66% in those of xz/yz symmetry. Detail modeling of the magnetic form factor indicates the presence of an orbital moment to the total paramagnetic moment of Fe2+.
pacs:
75.25.-j, 74.70.Xa, 61.05.F-I Introduction
The discovery of iron-based superconductors Kamihara et al. (2008) a few years ago has stimulated tremendous research interests worldwide in unconventional high-T superconductivity. The new excitement in this field has been generated very recently due to the discovery of the new superconducting compound KxFe2-ySe2 with superconducting transition temperature, T, above 30 K Guo et al. (2010). Isostructural AxFe2-ySe2 compounds (A = Rb, Cs, and Tl Wang et al. (2011); Krzton-Maziopa et al. (2011); Fang et al. (2011)) with similar T have been found soon after. One of the fascinating properties of the KxFe2-ySe2 superconductors, in contrast to the previously discovered pnictide or chalcogenide superconductors, is the absence of the hole Fermi surface at the Brillouin zone center or the presence of electronic Fermi surface at the zone center Zhang et al. (2011); Wang et al. (2011); Qian et al. (2011); Mou et al. (2011). This poses a serious challenge to the well accepted theories of the prevailing s± pairing symmetry driven by the interband scattering as suggested in many weak coupling theories Mazin and Schmalian (2009). Another unusual feature of the KxFe2-ySe2 superconductors is the presence of an antiferromagnetic order with a large moment ( 3.3 ) and very high transition temperature ( 600 K) Bao et al. (2011) which is in contrast to the parent compound of the pnictide superconductors where Fe moments order antiferromagnetically at considerably lower temperature (150 K) and with the small ordered magnetic moment ( 0.5-0.8 ) de la Cruz et al. (2008); Johnston (2010). Initially it was suggested that the superconductivity and antiferromagnetism coexist and compete within the same phase of the KxFe2-ySe2 Bao et al. (2011). However, subsequent detailed investigations concluded a phase separation between the vacancy ordered antiferromagnetic phase and a superconducting phase. Based on the observation of the superlattice in the vacancy ordered antiferromagnetic phase, optimal composition of A2Fe4Se5 has been suggested for the parent phase Bao et al. (2011); Ye et al. (2011). The nature of the superconducting phase is still not settled yet. Both a vacancy free phase with composition KFe2Se2 Ricci et al. (2011); Yuan et al. (2012); Li et al. (2012); Ding et al. (2013) and a phase A2Fe7Se8 Ding et al. (2013) with Fe vacancies have been found and was assigned to the superconducting phase.
Orbital composition of Fermi surface is very important regarding the pairing mechanism and pairing strength for the Fe-based superconductors. It has been shown theoretically that the strong interorbital interaction is very efficient to achieve superconductivity due to magnetic fluctuations in iron pnictides owing to the distinct orbital character of the Fermi surface Zhang et al. (2009). Besides the superconducting properties, physical properties of the Fe-based superconductors are also strongly dependent on the orbital character and occupancies of the Fe d-orbitals. Indeed, for the superconducting KxFe2-ySe2 (, ) compounds, a crossover from a low temperature metallic state to an orbital selective Mott phase at high temperature has been observed using Angle-Resolved Photoemission Spectroscopy (ARPES) measurements Yi et al. (2013). ARPES measurements clearly show that the spectral weight of the Fe dxy orbital near the Fermi surface is diminished at high temperature while the ddyz orbitals remain metallic. In order to obtain direct information about the electronic states near the Fermi surface we have undertaken magnetization distribution study of the non-superconducting compound K0.8Fe1.6Se2 using polarized neutron diffraction.
II Experimental Details
A good quality single crystal with approximate mass of 300 mg was grown by the Bridgman method Landsgesell et al. (2012). The structural parameters were determined from unpolarized neutron diffraction measurement using the four-circle diffractometer D9 equipped with a Cu (2 2 0) monochromator to produce a monochromatic neutron beam of 0.838 Å. The flipping ratios were measured using the polarized neutron diffractometer D3 with neutron wavelength of 0.825 Å obtained with a Heusler alloy monochromator with polarization of the incident neutron beam P0 = 0.907(5). Both these instruments are installed on the hot neutron source of the high-flux reactor of the Institute Laue-Langevin in Grenoble. The sample was held at constant temperature in a closed-cycle refrigerator on D9 whereas on D3 it was oriented with a axis parallel to the vertical field direction of a 9 T cryomagnet. The crystallographic notations used here and in the rest of the paper are according to the high temperature tetragonal phase with the I4/mmm symmetry. The flipping ratios from the K0.8Fe1.6Se2 crystal were measured in the paramagnetic tetragonal phase at T = 600 K. In a flipping ratio measurement, one measures the ratio , where I+ and I- are the scattered neutron intensities with neutron polarizations parallel and antiparallel to the applied magnetic field directions, respectively. Because the induced moment is small in K0.8Fe1.6Se2, in the limit (1, the flipping ratio, R, can be expressed as Lester et al. (2011)
| (1) |
where, m and is the Bohr magneton. F and F are the nuclear and the magnetic structure factors at the reciprocal lattice vector Q. Since, F and are known from the unpolarized and polarized neutron diffractions, respectively, F can be calculated.
III Experimental Results
III.1 Macroscopic Characterizations
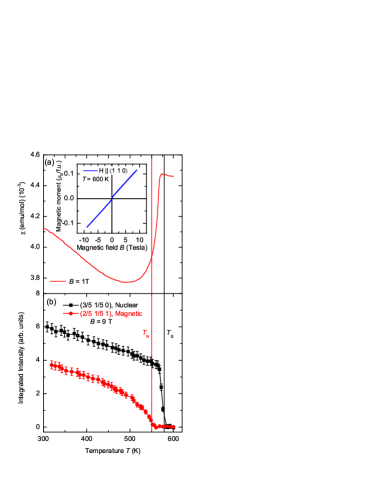
Figure 1 (a) shows magnetic susceptibility of a single crystal of K0.8Fe1.6Se2 measured using a Quantum Design vibrating sample magnetometer (VSM). For the magnetization measurements a sample from the same batch as the diffraction measurements was used. Magnetic susceptibility shows a clear kink at 572 K, indicating a phase transition from the high temperature vacancy disordered phase to the low temperature vacancy ordered phase. Inset to the Fig. 1 (a) shows M-H measured at T = 600 K. The linear behavior of the M-H curve confirms the paramagnetic nature of the sample at this temperature. The magnetization induced by a field of 9 T applied along the direction at 600 K was measured as 0.101(2) /f.u. 111In this paper, we have used one formula unit as one crystallographic unit cell. Therefore, in one formula unit, on the average there are 3.6 Fe atoms considering the Fe vacancies in the high temperature phase. after subtracting very small ferromagnetic contribution of 0.003(2) /f.u. due to impurities (probably pure Fe) Felner et al. (2011). It is the sum of a paramagnetic part due to magnetic excitation of electrons near the Fermi surface and a diamagnetic part to which all electrons contribute. The diamagnetic volume susceptibility is given by the Langevin equation,
| (2) |
The sum is over all the atoms in the unit cell of volume V, i is the mean-square radius of the ith atom’s electron wave function, and Zi denotes atomic number. The diamagnetic contribution to the magnetization calculated using Eq. 2 equals to −0.014 / f.u., the paramagnetic part of the magnetization therefore equals to 0.101(2)-(-0.014) = 0.115(2) / f.u. which is indicated by the diamond symbol in Fig. 2 222The obtained value is slightly larger than the interpolated Q (0) value of the magnetic form factor. This difference might be due to the presence of large diffuse scattering at T = 600 K or might be due to over-estimation of the diamagnetic contribution since it is apparently calculated for free atoms. Therefore, we have not included the Q (0) value for the form factor refinement and maximum entropy calculation..
III.2 Unpolarized neutron diffraction
| Atom | Position in I4/mmm | , | n | |||||
| site | x | y | z | |||||
| K | 2a | 0 | 0 | 0 | 0.13(2) | 0.010 (1) | 0 | 0.82(4) |
| Fe | 4d | 0 | 0.056(2) | 0.0059(3) | 0 | 0.81(1) | ||
| Se | 4e | 0 | 0 | 0.3532(2) | 0.060(3) | 0.0052(3) | 0 | 1 |
| Extinction g (rad-1) = 22, R, R, RF, 2: 6.8, 7.3, 6.2, 3.0 | ||||||||
| a = 3.945 (2) Å, c = 14.163(4) Å | ||||||||
| Definitions: Thermal factor T (h k l) = exp{-(+)} | ||||||||
| , , , | ||||||||
| Where the index n runs over the observations and the index k runs over the reflections contributing to the obsevation n. | ||||||||
| G2 is the square of the structure factor. , is the weight where is the variance of Gobs,n. | ||||||||
In order to characterize the structural and magnetic phase transitions, we have measured the temperature dependence of the nuclear ( 0) and magnetic ( 1) superstructure peaks at a vertical magnetic field of 9 T oriented along the direction as shown in Fig. 1 (b). The rapid increase of the intensity of the nuclear ( 0) peak below T = 580(3) K indicates the structural phase transition from the high-temperature Fe-vacancy-disordered phase with I4/mmm symmetry into the low-temperature Fe-vacancy ordered phase with I4/m symmetry. The transition temperature is broadly consistent with that determined from magnetic susceptibility measurement. The intensity of the magnetic peak ( 1) vanishes above the antiferromagnetic ordering temperature, T = 553(3) K, of the Fe moments. All the measurements for the determination of magnetization distribution were performed at T = 600 K which is well above both the structural and magnetic phase transitions. Sets of experimental structure factors containing 80 independent reflections within sin/ 0.80 Å-1 were obtained from the integrated intensities measured on D9 after averaging the intensities over equivalent reflections with a weighted R 333The weighted R factor for the equivalent reflections is defined as : . , is the weight where is the variance of I. factor of 4%. These data were used in least-squares refinements of the crystal structure using FullProf Rodríguez-Carvajal (2012) in which the variable parameters were the z coordinate of Se, the anisotropic temperature factors for the three sites, a single extinction parameter g representing the mosaic spread of the crystal and the site occupancies of the K and Se. The results are summarized in Table 1. The small value obtained for g, which is less than its estimated error, shows that any extinction, if present, is very small. The results are consistent with the neutron powder diffraction results of Bao et al. on a similar chemical composition Bao et al. (2011).
III.3 Polarized neutron diffraction studies
The flipping ratios were measured at an applied magnetic field of 9 T at 600 K at D3. Since the susceptibility of K0.8Fe1.6Se2 is small ( 0.1 /f.u.) all the flipping ratios R are close to unity. Therefore, every reflection was measured for more than one hour to have reasonable counting statistics. The flipping ratios measured for equivalent reflections and for repeated measurements of the same reflection were averaged together to give a mean value of R, which was used to calculate the magnetic structure factors F using Cambridge Crystallographic Subroutine Library (CCSL) Brown and Matthewman (1993). Both the observed flipping ratios and the calculated F are listed in Table 2. The nuclear structure factor, F, was calculated using the parameters obtained from the integrated intensity measurements which are given in Table 1.
The diamagnetic contribution to the magnetic structure factor in an applied magnetic field B is
| (3) |
where f is the atomic form factor of the ith atom and ri its position in the unit cell Maslen et al. (2006). The constant C has the value 1.5210-5 T-1Å2 Stassis (1970). The diamagnetic contributions to the magnetic structure factors were calculated using Eq. 3 and are given in Table 2. The values Fdia were subtracted from the magnetic structure factors FM to obtain the paramagnetic structure factors Fpara which are also listed in Table 2. The geometric structure factor of Fe atoms for the (h k l) reflections can be written as:
| (4) |
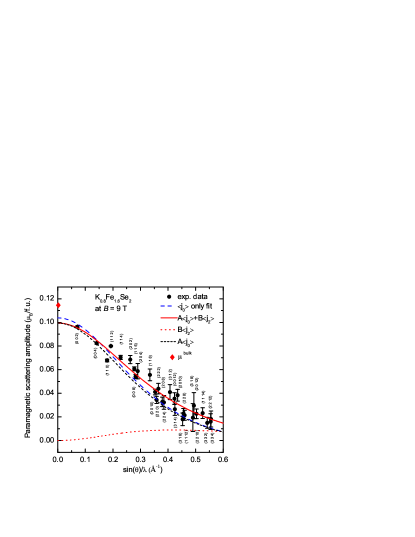
which is either +4 or -4 depending on the values of h, k, l assuming full occupancy of the Fe site. In Fig. 2, we show the effective paramagnetic scattering amplitude, obtained by dividing each Fpara by and multiplied by the number of Fe atoms in the unit cell. It can be seen that most of the paramagnetic scattering amplitude lies reasonably close to theoretical spherical form factor of Fe2+ Brown (2006). This result signifies that most of the paramagnetic scattering amplitude is associated with the Fe2+ moments.
| / | (1-R) | FM | Fdia | Fpara | Fcalc444using a constrained multipole model with an orbital moment. | |||
|---|---|---|---|---|---|---|---|---|
| h | k | l | Å-1 | m/f.u. | m/f.u. | m/f.u. | m/f.u. | |
| 0 | 0 | 2 | 0.0706 | 26.8 0.3 | -92.9 1.2 | 1.13 | -94.0 1.2 | -94.0 |
| 0 | 0 | 4 | 0.1412 | 97.92.2 | 74.9 1.6 | -0.02 | 74.9 1.6 | 77.0 |
| 1 | 1 | 0 | 0.1791 | -101.8 2.9 | -61.1 1.8 | -0.46 | -60.6 1.8 | -69.0 |
| 1 | 1 | 2 | 0.1925 | 28.6 0.5 | 69.3 1.1 | -0.42 | 69.8 1.1 | 66.0 |
| 1 | 1 | 4 | 0.2281 | 12.5 0.6 | -56.6 2.6 | 0.61 | -57.2 2.6 | -55.0 |
| 2 | 0 | 2 | 0.2630 | 10.3 0.9 | -53.1 4.4 | 0.27 | -53.4 4.4 | -45.0 |
| 1 | 1 | 6 | 0.2774 | 9.8 0.5 | 43.2 2.4 | -0.53 | 43.8 2.4 | 42.0 |
| 0 | 0 | 8 | 0.2824 | 10.2 0.6 | 36.6 2.3 | -0.43 | 37.4 2.3 | 37.0 |
| 2 | 0 | 4 | 0.2900 | 47.5 7.8 | 42.6 7.7 | -0.04 | 42.6 7.7 | 39.0 |
| 1 | 1 | 8 | 0.3345 | 49.4 7.8 | -33.9 5.2 | 0.03 | -33.9 5.2 | -29.0 |
| 0 | 0 | 10 | 0.3531 | 6.5 0.8 | -22.3 2.6 | 0.28 | -22.6 2.6 | -22.0 |
| 2 | 2 | 0 | 0.3583 | 5.0 0.8 | 21.6 3.3 | -0.32 | 21.9 3.3 | 27.0 |
| 2 | 2 | 2 | 0.3651 | 12.0 2.1 | -27.2 4.7 | 0.14 | -27.3 4.7 | -26.0 |
| 2 | 0 | 8 | 0.3794 | 5.0 1.1 | 17.6 3.7 | -0.20 | 17.8 3.7 | 22.0 |
| 2 | 2 | 4 | 0.3851 | 45.9 13.6 | 18.7 5.4 | -0.01 | 18.7 5.4 | 23.0 |
| 3 | 1 | 2 | 0.4067 | 12.8 3.3 | 22.7 5.9 | -0.07 | 22.8 5.9 | 18.0 |
| 0 | 0 | 12 | 0.4237 | 9.6 2.3 | 14.9 3.7 | -0.10 | 15.0 3.7 | 11.0 |
| 3 | 1 | 4 | 0.4247 | 3.9 1.3 | -13.6 4.4 | 0.16 | -13.8 4.4 | -16.0 |
| 2 | 0 | 10 | 0.4345 | 5.1 1.2 | -16.7 3.8 | 0.16 | -16.9 3.8 | -14.0 |
| 3 | 1 | 6 | 0.4531 | 2.6 1.3 | 8.1 4.0 | -0.13 | 8.2 4.0 | 14.0 |
| 2 | 2 | 8 | 0.4562 | 4.6 1.5 | 9.9 3.1 | -0.11 | 10.0 3.1 | 14.0 |
| 1 | 1 | 12 | 0.4600 | 8.1 2.8 | -8.0 2.8 | 0.05 | -8.1 2.8 | -13.0 |
| 3 | 1 | 8 | 0.4901 | 12.5 21.7 | -7.5 13.0 | 0.01 | -7.5 13.0 | -10.0 |
| 2 | 0 | 12 | 0.4936 | 7.0 6.5 | 9.9 8.6 | -0.05 | 10.0 8.6 | 8.0 |
| 2 | 2 | 10 | 0.5030 | 3.6 1.1 | -7.8 2.5 | 0.10 | -7.9 2.5 | -10.0 |
| 1 | 1 | 14 | 0.5257 | 3.3 1.2 | 6.3 2.2 | -0.08 | 6.4 2.2 | 5.0 |
| 3 | 3 | 2 | 0.5420 | 6.0 3.1 | 5.3 2.7 | -0.02 | 5.3 2.7 | 8.0 |
| 2 | 2 | 12 | 0.5548 | 4.5 3.1 | 4.3 2.9 | -0.03 | 4.3 2.9 | 6.0 |
| 3 | 3 | 4 | 0.5556 | 3.2 1.9 | -6.0 3.6 | 0.06 | -6.0 3.6 | -7.0 |
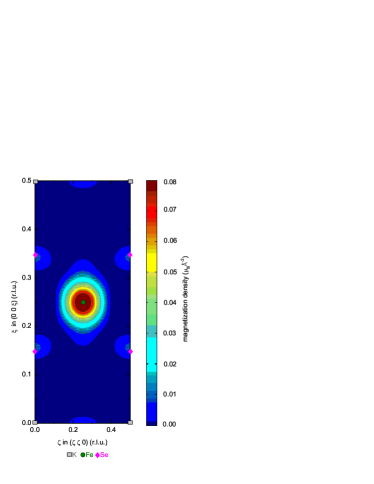
To have a model free reconstruction of magnetization density, we have used maximum entropy method using MEMSYS III subroutine library Gull and Skilling . This method has been shown to give more reliable results from sparse and noisy data compared to conventional Fourier analysis Papoular and Gillon (1990). We have used this method to clarify the shape of the distribution. Figure 3 shows maximum entropy reconstruction of the magnetization distribution projected down to the [1 1 0] plane using the measured magnetic structure factors for the [H H L] type of reflections. The reconstruction shows clearly that the majority of magnetization is confined to the region around the iron atoms. However, a very small magnetization ( Å can be seen around the Se atoms signifying a possible hybridization between the Fe and Se. The magnetization around the Fe atom is slightly nonspherical with a shape that appears to extend in the direction of the projection.
| Model | (+ | Rw | ||
| in /Fe | in /Fe | |||
| dipole | 0.0320(5) | 0 | 3.3 | 12.6% |
| 0.0306(4) | 0.014(4) | 2.0 | 7.9% | |
| multipole555Multipole parameters constrained to give only t2g type orbitals. | 0.0319(4) | 0 | 3.4 | 12.5% |
| 0.0306(4) | 0.014(4) | 2.2 | 7.7% | |
| . , is | ||||
| the weight where is the variance of | ||||
Further analysis of the measured paramagnetic scattering amplitude was obtained by fitting the magnetic structure factors to a multipole model in which they are expressed as
| (5) | |||||
where, is the total magnetic moment of Fe. and are the spin and orbital contributions respectively. are the form factor for a Fe2+ and Y are the real combinations of spherical harmonic functions written as,
| (6) |
The point group symmetry of Fe site, limits the nonzero coefficients alm to a a40 and a44. Different models have been considered for fitting the paramagnetic scattering amplitude in Fig. 2, namely, (a) a dipole model with only first two terms in the Eq. 5, and (b) a multipole model when all the terms in the Eq. 5 are retained. Both the dipole and multipole models have been considered with and without the orbital moment. The results of different fitting models have been summarized in Table 3. It can be easily seen that the inclusion of orbital part increases the quality of fit in both the low and high Q regions of the form factor and the agreement factors significantly. The obtained ratio of signifies dominant contribution of the orbital moment to the total paramagnetic scattering amplitude of Fe2+.
In a site with fourfold symmetry the d orbitals split into the singlet states: and and a doublet combination of and . The first two singlet states are derived from the cubic eg functions and the third singlet and the doublet from the t2g ones. The occupancies of these four nondegenerate orbitals can be derived directly from the coefficients Brown et al. (2010). However, the parameters obtained from the unconstrained fit lead to unphysical, negative occupancies for the orbital with large estimated standard deviations for all the orbitals as can be seen from Table 4. Band structure calculations as well as photoemission spectroscopy measurements indicate that the t2g orbitals dominate at the Fermi surface Yi et al. (2013); Qian et al. (2011); Zhang et al. (2011); Liu et al. (2012). Therefore, a constrained fit Brown et al. (2010) in which the ratio between the alm was fixed to correspond to occupancy of the t2g-type orbitals only, gave equally good agreement factor as well as less standard deviation of the fitted parameters as shown in Table 4. The refinement shows that 66% of the electrons occupy doubly degenerate dxz/dyz orbitals and 34% of those are in the dxy orbital. The magnetic structure factors calculated for this constrained multipole model are given together with the measured values and the diamagnetic corrections in Table 2.
There have been a few reports of magnetization distribution for the superconducting and non superconducting Fe based compounds Brown et al. (2010); Prokeš et al. (2011); Lester et al. (2011); Ratcliff et al. (2010); Lee et al. (2010). Of particular interest are the results of BaFe2As2 by Brown et al. Brown et al. (2010) who have shown that most of the magnetization is associated with the Fe atoms and the distribution is non-spherical with an extension along the direction. For the superconducting Ba(Fe1-xCox)2As2 samples both Prokeš et al. Prokeš et al. (2011) and Lester et al. Lester et al. (2011) have concluded that the magnetization is rather extended along the direction. The change in distribution between the doped and undoped samples is due to the doping induced modifications of the relevant bands near the Fermi surface as suggested by Lester et al. Lester et al. (2011). In contrast to all of the investigated Fe-pnictides, K0.8Fe1.6Se2 shows distribution elongated along the direction. The results of the present experiment show that at least 96% of the electrons in K0.8Fe1.6Se2, which give rise to the paramagnetic susceptibility, are localized on the Fe atoms with a radial distribution similar to that of a Fe2+. Their angular distribution shows that they occupy the t2g-type orbitals with a strong preference for the doubly degenerate xz/yz type which is in agreement with the slight elongation observed along the direction for the maximum entropy map in Fig. 3. For the BaFe2As2, the xy ( 52%) orbitals are more occupied than the xz/yz ( 48%) orbitals which is opposite to the results for the K0.8Fe1.6Se2 as shown in Table 4. This difference in occupancy for the t2g orbitals and the corresponding magnetization distribution in different compounds might be due to the subtle interplay between the crystal field effects and Hund’s rule coupling Yin et al. (2011).
Most surprising result of the present study is the presence of an orbital moment to the total paramagnetic moment of K0.8Fe1.6Se2. Previous studies also hinted existence of orbital moment Prokeš et al. (2011); Lester et al. (2011). For the superconducting Ba(Fe1-xCox)2As2 samples, Lester et al. Lester et al. (2011) have found that at least of the normal state susceptibility does not vanish at the lowest achievable temperature of 2 K. They have attributed the remaining susceptibility to the orbital contribution of Van Vleck type or due to the presence of residual quasiparticle density of states at the Fermi surface. Our very accurate form factor measurement allows us to quantify the orbital contribution relative to the spin contribution. The observed form factor of Fe2+ is best fitted using 46% orbital and 54% spin contributions to the total magnetization. The amount of orbital contribution is unusually high keeping in mind that the orbital moment is generally quenched in a 3d-orbital system due to the crystal field effects. Nevertheless, similarly large orbital contribution has been found for the Vanadium d-electrons in classical s-wave superconductor V3Si using polarized neutrons Shull and Wedgwood (1966). For the Fe-based superconductors, band structure calculations also predicted that the orbital contribution is larger than the spin contribution Su and Li . Our results provide first experimental hint of non-negligible orbital contribution to the total paramagnetic susceptibility of K0.8Fe1.6Se2. Strongly anisotropic and weakly temperature dependent magnetic susceptibility observed in the AxFe2-ySe2 (A = K, Rb, Cs) systems Lei and Petrovic (2011); Liu et al. (2011) might be related to the presence of large orbital contribution since the spin contribution is strongly temperature dependent.
| Amplitudes (in /Fe) | |||
| Function | coefficient | all d666All multipole parameters allowed by the point group symmetry. | t2g only777Multipole parameters constrained to give only t2g type orbitals. |
| Y(00) | a0 | 0.0306(5) | 0.0306(4) |
| Y(20) | a20 | 0.04(10) | -0.03(9) |
| Y(40) | a40 | -0.20(40) | -0.39(6) |
| Y(44+) | a44 | 0.48(58) | -0.37(7) |
| 0.017(4) | 0.014(4) | ||
| 2.2 | 2.2 | ||
| Occupancies (%) | |||
| orbital | all da | t2g onlyb | |
| 3z2-r2 | 12(24) | 0 | |
| x | 40(35) | 0 | |
| xy | -6(35) | 34(7) | |
| xz, yz | 54(30) | 66(7) | |
IV Conclusion
In summary, we have determined magnetization distribution in K0.8Fe1.6Se2 using polarized neutron diffraction. Magnetic structure factors derived from the polarization dependence of the intensities of the Bragg reflections were used to make a maximum-entropy reconstruction of the distribution projected on the [1 1 0] plane. The reconstruction shows clearly that the magnetization is confined to the region around the iron atoms. A very small magnetization around the Se atoms hints towards a possible hybridization between the Fe and Se. The distribution of magnetization around the Fe atom is slightly nonspherical with a shape which is extended in the direction in the projection. These results show that the electrons which give rise to the paramagnetic susceptibility are confined to the Fe atoms and their distribution suggests that they occupy 3d t2g-type orbitals with 66% in those of xz/yz symmetry. Orbital moment contributes significantly to the total paramagnetic moment of Fe and might be responsible for the anisotropic properties of the Fe-based superconductors.
Acknowledgements.
S. N. likes to acknowledge M. Angst for helpful discussions and M. Vial and A. John for technical assistance.References
- Kamihara et al. (2008) Y. Kamihara, T. Watanabe, M. Hirano, and H. Hosono, J. Am. Chem. Soc. 130, 3296 (2008).
- Guo et al. (2010) J. Guo, S. Jin, G. Wang, S. Wang, K. Zhu, T. Zhou, M. He, and X. Chen, Phys. Rev. B 82, 180520 (2010).
- Wang et al. (2011) A. F. Wang, J. J. Ying, Y. J. Yan, R. H. Liu, X. G. Luo, Z. Y. Li, X. F. Wang, M. Zhang, G. J. Ye, P. Cheng, et al., Phys. Rev. B 83, 060512 (2011).
- Krzton-Maziopa et al. (2011) A. Krzton-Maziopa, Z. Shermadini, E. Pomjakushina, V. Pomjakushin, M. Bendele, A. Amato, R. Khasanov, H. Luetkens, and K. Conder, J. Phys.: Condens. Mat. 23, 052203 (2011).
- Fang et al. (2011) M.-H. Fang, H.-D. Wang, C.-H. Dong, Z.-J. Li, C.-M. Feng, J. Chen, and H. Q. Yuan, Europhys. Lett. 94, 27009 (2011).
- Zhang et al. (2011) Y. Zhang, L. X. Yang, M. Xu, Z. R. Ye, F. Chen, C. He, H. C. Xu, J. Jiang, B. P. Xie, J. J. Ying, et al., Nat. Mater. 10, 273 (2011).
- Qian et al. (2011) T. Qian, X.-P. Wang, W.-C. Jin, P. Zhang, P. Richard, G. Xu, X. Dai, Z. Fang, J.-G. Guo, X.-L. Chen, et al., Phys. Rev. Lett. 106, 187001 (2011).
- Mou et al. (2011) D. Mou, S. Liu, X. Jia, J. He, Y. Peng, L. Zhao, L. Yu, G. Liu, S. He, X. Dong, et al., Phys. Rev. Lett. 106, 107001 (2011).
- Mazin and Schmalian (2009) I. I. Mazin and J. Schmalian, Physica C 469, 614 (2009).
- Bao et al. (2011) W. Bao, Q. Huang, G. F. Chen, M. A. Green, D. M. Wang, J. B. He, X. Q. Wang, and Y. Qiu, Chin. Phys. Lett. 28, 086104 (2011).
- de la Cruz et al. (2008) C. de la Cruz, Q. Huang, J. W. Lynn, J. Li, W. Ratcliff II, J. L. Zarestky, H. A. Mook, G. F. Chen, J. L. Luo, N. L. Wang, et al., Nature (London) 453, 899 (2008).
- Johnston (2010) D. C. Johnston, Adv. Phys. 59, 803 (2010).
- Ye et al. (2011) F. Ye, S. Chi, W. Bao, X. F. Wang, J. J. Ying, X. H. Chen, H. D. Wang, C. H. Dong, and M. Fang, Phys. Rev. Lett. 107, 137003 (2011).
- Ricci et al. (2011) A. Ricci, N. Poccia, G. Campi, B. Joseph, G. Arrighetti, L. Barba, M. Reynolds, M. Burghammer, H. Takeya, Y. Mizuguchi, et al., Phys. Rev. B 84, 060511 (2011).
- Yuan et al. (2012) R. H. Yuan, T. Dong, Y. J. Song, P. Zheng, G. F. Chen, J. P. Hu, J. Q. Li, and N. L. Wang, Sci. Rep. 2, 221 (2012).
- Li et al. (2012) W. Li, H. Ding, P. Deng, K. Chang, C. L. Song, K. He, L. L. Wang, X. C. Ma, J. P. Hu, X. Chen, et al., Nat. Phys. 8, 126 (2012).
- Ding et al. (2013) X. Ding, D. Fang, Z. Wang, H. Yang, J. Liu, Q. Deng, G. Ma, C. Meng, Y. Hu, and H.-H. Wen, Nat. Commun. 4, 1987 (2013).
- Zhang et al. (2009) J. Zhang, R. Sknepnek, R. M. Fernandes, and J. Schmalian, Phys. Rev. B 79, 220502 (2009).
- Yi et al. (2013) M. Yi, D. H. Lu, R. Yu, S. C. Riggs, J.-H. Chu, B. Lv, Z. K. Liu, M. Lu, Y.-T. Cui, M. Hashimoto, et al., Phys. Rev. Lett. 110, 067003 (2013).
- Landsgesell et al. (2012) S. Landsgesell, D. Abou-Ras, T. Wolf, D. Alber, and K. Prokeš, Phys. Rev. B 86, 224502 (2012).
- Lester et al. (2011) C. Lester, J.-H. Chu, J. G. Analytis, A. Stunault, I. R. Fisher, and S. M. Hayden, Phys. Rev. B 84, 134514 (2011).
- Felner et al. (2011) I. Felner, S. Jin, G. Wang, S. Wang, K. Zhu, and T. Zhou, J. Supercond. Nov. Magn. 24, 2033 (2011).
- Rodríguez-Carvajal (2012) J. Rodríguez-Carvajal (2012), program FULLPROF, Version: May-2012, ILL, Grenoble, France.
- Freeman and Watson (1961) A. J. Freeman and R. E. Watson, Acta Crystallogr. 14, 231 (1961).
- Brown (2006) P. J. Brown, in International Tables for Crystallography, edited by E. Prince (International Union of Crystallography, 2006), vol. C, chap. 4.4, pp. 454–461.
- Brown and Matthewman (1993) P. J. Brown and J. Matthewman, in Cambridge Cristallography Subroutine Library, Rutherford Appleton Laboratory Report No. RAL93-009. (1993).
- Maslen et al. (2006) E. N. Maslen, A. Fox, and M. A. O’Keefe, in International Tables for Crystallography, edited by E. Prince (International Union of Crystallography, 2006), vol. C, chap. 6.1, pp. 578–580.
- Stassis (1970) C. Stassis, Phys. Rev. Lett. 24, 1415 (1970).
- (29) S. F. Gull and J. Skilling, MEMSYS III Quantified Maximum Entropy Subroutine Library, Meldreth, U.K., 1989.
- Papoular and Gillon (1990) R. J. Papoular and B. Gillon, Europhys. Lett. 13, 429 (1990).
- Brown et al. (2010) P. J. Brown, T. Chatterji, A. Stunault, Y. Su, Y. Xiao, R. Mittal, T. Brückel, T. Wolf, and P. Adelmann, Phys. Rev. B 82, 024421 (2010).
- Liu et al. (2012) D.-Y. Liu, Y.-M. Quan, Z. Zeng, and L.-J. Zou, Physica B 407, 1139 (2012).
- Prokeš et al. (2011) K. Prokeš, A. Gukasov, D. N. Argyriou, S. L. Bud’ko, P. C. Canfield, A. Kreyssig, and A. I. Goldman, Europhys. Lett. 93, 32001 (2011).
- Ratcliff et al. (2010) W. Ratcliff, P. A. Kienzle, J. W. Lynn, S. Li, P. Dai, G. F. Chen, and N. L. Wang, Phys. Rev. B 81, 140502 (2010).
- Lee et al. (2010) Y. Lee, D. Vaknin, H. Li, W. Tian, J. L. Zarestky, N. Ni, S. L. Bud’ko, P. C. Canfield, R. J. McQueeney, and B. N. Harmon, Phys. Rev. B 81, 060406 (2010).
- Yin et al. (2011) Z. P. Yin, K. Haule, and G. Kotliar, Nat. Mater. 10, 932 (2011).
- Shull and Wedgwood (1966) C. G. Shull and F. A. Wedgwood, Phys. Rev. Lett. 16, 513 (1966).
- (38) Y. Su and T. Li, arXiv:1103.1056v2 (unpublished).
- Lei and Petrovic (2011) H. Lei and C. Petrovic, Phys. Rev. B 83, 184504 (2011).
- Liu et al. (2011) R. H. Liu, X. G. Luo, M. Zhang, A. F. Wang, J. J. Ying, X. F. Wang, Y. J. Yan, Z. J. Xiang, P. Cheng, G. J. Ye, et al., Europhys. Lett. 94, 27008 (2011).