11email: gsacco@arcetri.inaf.it 22institutetext: Center for Imaging Science and Laboratory for Multiwavelength Astrophysics, Rochester Institute of Technology, 54 Lomb Memorial Drive, Rochester, NY 14623, USA 33institutetext: Laboratoire d’Astrophysique de Grenoble, Université Joseph Fourier-CNRS, BP 53, 38041 Grenoble Cedex France 44institutetext: Department of Physics and Astronomy, Vanderbilt University, Nashville, TN 37235, USA 55institutetext: Department of Physics and Astronomy, University of California Los Angeles 90095, CA, USA
Molecules in the transition disk orbiting T Cha††thanks: Based
on submillimeter and X-ray observations. Submillimeter observations have been collected at the European Organisation for Astronomical
Research in the Southern Hemisphere, Chile, with the Atacama Pathfinder Experiment APEX
(Prog. ID 088.C-0441 and E-089.C-0518A). X-ray archival observations used in this paper have been obtained with XMM-Newton, an
ESA science mission with instruments and contributions directly funded by ESA member states and NASA.
Abstract
Aims. We seek to establish the presence and properties of gas in the circumstellar disk orbiting T Cha, a nearby (d110 pc), relatively evolved (age 5-7 Myr) yet actively accreting 1.5 M⊙ T Tauri star.
Methods. We used the Atacama Pathfinder Experiment (APEX) 12 m radiotelescope to search for submillimeter molecular emission from the T Cha disk, and we reanalyzed archival XMM-Newton imaging spectroscopy of T Cha to ascertain the intervening absorption due to disk gas along the line of sight to the star ().
Results. We detected submillimeter rotational transitions of 12CO, 13CO, HCN, CN and HCO+ from the T Cha disk. The 12CO line (and possibly the 13CO line) appears to display a double-peaked line profile indicative of Keplerian rotation; hence, these molecular line observations constitute the first direct demonstration of the presence of cold molecular gas orbiting T Cha. Analysis of the CO emission line data indicates that the disk around T Cha has a mass () similar to, but more compact ( 80 AU) than, other nearby, evolved molecular disks (e.g. V4046 Sgr, TW Hya, MP Mus) in which cold molecular gas has been previously detected. The HCO+/13CO and HCN/13CO, line ratios measured for T Cha appear similar to those of other evolved circumstellar disks (i.e. TW Hya and V4046 Sgr). The CN/13CO ratio appears somewhat weaker, but due to the low signal-to-noise ratio of our detection, this discrepancy is not strongly significant. Analysis of the XMM-Newton X-ray spectroscopic data shows that the atomic absorption toward T Cha is 1-2 orders of magnitude larger than toward the other nearby T Tauri with evolved disks, which are seen with much lower inclination angles. Furthermore, the ratio between atomic absorption and optical extinction toward T Cha is higher than the typical value observed for the interstellar medium and young stellar objects in the Orion Nebula Cluster. This may suggest that the fraction of metals in the disk gas is higher than in the interstellar medium. However, a X-ray absorption model appropriate for the physical and chemical conditions of a circumstellar disk is required to address this issue.
Conclusions. Our results confirm that pre-main sequence stars older than 5 Myr, when accreting, retain cold molecular disks, and that those relatively evolved disks display similar physical and chemical properties.
Key Words.:
protoplanetary disks, Submillimeter: stars, Stars: pre Main-sequence, Stars: individual: T Cha1 Introduction
Circumstellar disks serve both as sources of material for accreting stars and as the sites of nascent planetary systems. Observations that can establish the physical conditions and evolution of the gaseous components of such disks are essential to understand the accretion process and the processes involved in planet formation. Observation of emission lines from molecular species (e.g. CO, HCN, CN, HCO+) in the submillimeter represents a powerful tool for studying cold (10-100 K) gas located in the outer regions (R10 AU) of circumstellar disks. Submillimeter observations of molecular emission from disks orbiting young stars have been carried out in the last two decades, using both single dish and interferometric facilities; many of these studies have focused on relatively evolved pre-main sequence (pre-MS) star/disk systems that are located away from dark clouds and, hence, are free of potential contaminating cloud CO line emission (e.g. Dutrey et al. 1994, 1997, 2008; Kastner et al. 1997, 2008; Thi et al. 2004; Qi et al. 2004, 2006, 2008; Piétu et al. 2007; Rodriguez et al. 2010; Öberg et al. 2010, 2011; Andrews et al. 2012 and references therein).
In the last few years, our group initiated a campaign of multiwavelength observations of young, roughly solar-mass pre-main sequence (pre-MS) stars within 100 pc that are still accreting gas from their circumstellar disks. Only four pre-MS stars (TW Hya, V4046 Sgr, MP Mus and T Cha), all located in the southern hemisphere, are known to share all of these properties. Thanks to their proximity and ages, these stars are particularly suitable for studies of star and planet formation processes: they are close enough for detailed study of the spatial structure of their disks with high spatial resolution facilities; they are old enough (ages 5-20 Myr) that their disks may already have spawned giant protoplanets; and their disks still retain significant amounts of gas, as demonstrated by signatures of stellar accretion in the optical through X-ray regimes (e.g. Alencar & Batalha 2002; Argiroffi et al. 2012; Curran et al. 2011).
The archetype of these young stars is TW Hya. The presence of molecular gas orbiting TW Hya was first established via single-dish CO observations by Zuckerman et al. (1995); subsequently, its disk has been scrutinized via both single-dish molecular line surveys (Kastner et al. 1997; Thi et al. 2004) and interferometric imaging (Qi et al. 2004, 2006, 2008; Hughes et al. 2011; Rosenfeld et al. 2012b). More recently, we detected molecular emission from disks orbiting two additional nearby, accreting pre-MS stars, V4046 Sgr and MP Mus (Kastner et al. 2008, 2010). Like TW Hya, the former system has been investigated in multiple molecular tracers (Kastner et al. 2008; Öberg et al. 2011) and has been mapped interferometrically (Rodriguez et al. 2010; Öberg et al. 2011; Andrews et al. 2012; Rosenfeld et al. 2012a), whereas thus far the MP Mus molecular disk has only been detected via single-dish spectroscopy of 12CO. Given simple assumptions concerning disk CO abundance, the CO submillimeter emission and mid-infrared and submillimeter continuum observations suggest gas-to-dust ratios close to unity for all three disks — suggesting either that these disks are have already depleted a large part of their primordial gas (as initially proposed by Dutrey et al. 1997) or that the [CO]/H2 number ratio is much smaller than the value of 10-4 usually adopted for purposes of estimating molecular gas masses from CO data. Furthermore, certain radio molecular lines measured for V4046 Sgr and TW Hya suggest that the chemistry of the circumstellar gas is influenced by the strong high-energy (UV and/or X-ray) radiation fields of the stars (Kastner et al. 2008; Salter et al. 2011).
T Cha is a K0 V star of 1.5 M⊙ that is likely a member of the Chamaeleontis Association, on the basis of its kinematic properties (Torres et al. 2008; Olofsson et al. 2011; Murphy et al. 2013). Kinematic data have been used to derive the distances to the Association and its members, with two recent studies finding distances in the range 107-110 pc, both to the Association and T Cha itself (Torres et al. 2008; Murphy et al. 2013). Hence, in this paper, we adopt the distance of 110 pc to T Cha. The age of the Association is more uncertain. Torres et al. (2008) proposed an age of 6-7 Myr, while Murphy et al. (2013) recently suggested a younger age (3-5 Myr). According to its position in the HR diagram relative to theoretical pre-MS sequence evolutionary tracks, T Cha appears to be older than the rest of the Association (10-12 Myr from Kastner et al. 2012 and Murphy et al. 2013). However, Murphy et al. (2013) argue that evolutionary models imply ages for solar mass stars that are older than their actual ages due to a systematic error in the models or in inferred values of temperature and luminosity.
T Cha is characterized by highly variable optical brightness (3 mag in V band) as well as broad emission lines (e.g. H, H, O I at 6300 Å) indicative of active accretion onto the star (Schisano et al. 2009; Kastner et al. 2012). The variability of the optical magnitude, emission line intensities, and extinction measured toward the star are likely associated with a circumstellar disk seen at relatively high inclination angle; based on modeling of near-infrared interferometric data, Olofsson et al. (2013) estimate that the disk inclination is (where would be edge-on). Such a disk viewing geometry is further supported by the relatively large absorbing column of gas toward the star that is inferred from X-ray spectroscopy ( cm-2; Güdel et al. 2010). The spectral energy distribution (SED) of T Cha from optical to millimeter wavelengths has been studied by several authors (Brown et al. 2007; Olofsson et al. 2011, 2013; Cieza et al. 2011). These studies indicate that the T Cha disk has an optically thick inner disk (radius 0.13-0.17 AU) and an outer disk of radius AU (see below) separated by a cavity. Infrared adaptive optics imaging hints at the potential presence of a substellar (perhaps even planetary mass) companion at 7 AU, which may be responsible for excavating the cavity in the T Cha dust disk (Huélamo et al. 2011); however, a recent reanalysis of these data indicates the excess infrared flux indicative of this close companion may instead be due to anisotropic scattering in the disk (Olofsson et al. 2013). An analysis of the SED from the far-IR to mm-wave shows that the outer disk only extends from 10 to 30 AU, with very little mass outside (Cieza et al. 2011). Line profiles of [Ne ii] emission from T Cha, obtained via high spectral resolution mid-IR spectroscopy, indicate that the gaseous component of the inner disk is photoevaporating due to high-energy irradiation by the star (Pascucci & Sterzik 2009; Sacco et al. 2012).
In this paper, we report the detection of submillimeter emission from the circumstellar disk orbiting T Cha in transitions of 12CO, its most abundant isotopologue 13CO, and three other trace molecular species (HCO+, HCN, CN). In Sec. 2, we describe the new submillimeter observations; in Sec. 3 we describe the submillimeter data analysis as well as the properties of X-ray emission from T Cha as determined from a reanalysis of archival data; in Sec. 4 we discuss our results by comparing the properties of the disk around T Cha with the other nearby transition disks TW Hya, V4046 Sgr and MP Mus; and in Sec. 5 we draw our conclusions.
| day | Lines | Time | pwv |
|---|---|---|---|
| (dd-mm-yyyy) | (h) | (mm) | |
| 18-09-2011 | 12CO (3-2), 13CO (3-2) | 4.2 | 0.6-0.8 |
| 21-09-2011 | 12CO (3-2) | 2.2 | 0.3-0.9 |
| 22-09-2011 | 12CO (3-2) | 2.2 | 0.3-0.9 |
| 14-05-2012 | 13CO (3-2) | 2.7 | 0.8-1.1 |
| 20-05-2012 | 13CO (3-2) | 5.2 | 0.6-1.1 |
| 21-05-2012 | HCO+ (4-3), HCN (4-3) | 3.0 | 0.5-0.7 |
| 27-07-2012 | HCO+ (4-3), HCN (4-3) | 5.3 | 0.7-1.0 |
| 04-08-2012 | CN (3-2) | 2.2 | 1.4-1.8 |
| 10-08-2012 | CN (3-2) | 2.8 | 1.0-1.2 |
| 11-08-2012 | CN (3-2) | 2.0 | 0.9-1.8 |
2 Submillimeter Observations
We observed T Cha (J2000 coordinates = 11:57:13.550, = -79:21:31.54) with the Atacama Pathfinder Experiment (APEX) 12 m telescope (Güsten et al. 2006) in service mode for a total time of 31.8 h (including overheads) over the course of 11 nights in 2011–2012 (Table 1). The first observation, in 2011 September, yielded detection of 12CO emission; following this detection, in May, July and August 2012, we observed (and detected emission from) 13CO , HCO, HCN and CN .
All observations used the SHFI/APEX-2 receiver and XFFTS spectral backend. The half-power beamwidth and main-beam efficiency of the APEX 12 m at the frequency range of the Table 1 observations (330–357 GHz) are and , respectively111See http://www.apex-telescope.org/telescope/efficiency/.. During the first observing run in September 2011, we began by using beam-switching mode with the wobbling secondary for background subtraction. These initial observations yielded detection of circumstellar CO from T Cha, but with an apparent strong, narrow 12CO “absorption” feature superimposed.
We determined that this narrow CO feature could be attributed to imperfect subtraction of emission from a background molecular cloud (Dcld 300.2–16.9; Nehmé et al. 2008). To properly subtract the emission of the cloud, we used position-switching mode during the second and third nights, taking as reference positions four points offset 30″ to the east, west, north and south of the position of T Cha. This approach allowed us to effectively subtract the cloud emission from the spectrum of circumstellar CO emission. Furthermore, to measure the emission from the cloud, we obtained position-switched spectra using a distant off-source reference point located well outside the compact cloud. The emission from the cloud is well fitted with a gaussian profile at central velocity (with respect to the local standard of rest, LSR), with a peak temperature and . Emission from the cloud did not affect the observations of the other molecular transitions so, during the run performed in 2012, we used beam-switching mode for background subtraction.
3 Data Analysis
3.1 Molecular line emission
To reduce and analyze the data, we used the CLASS222See http://iram.fr/IRAMFR/GILDAS/ radio spectral line data reduction package and our own IDL-based analysis tools. Specifically, we used CLASS to co-add spectral scans, correct for the beam efficiency, and subtract baselines, while line fitting was performed by IDL scripts.
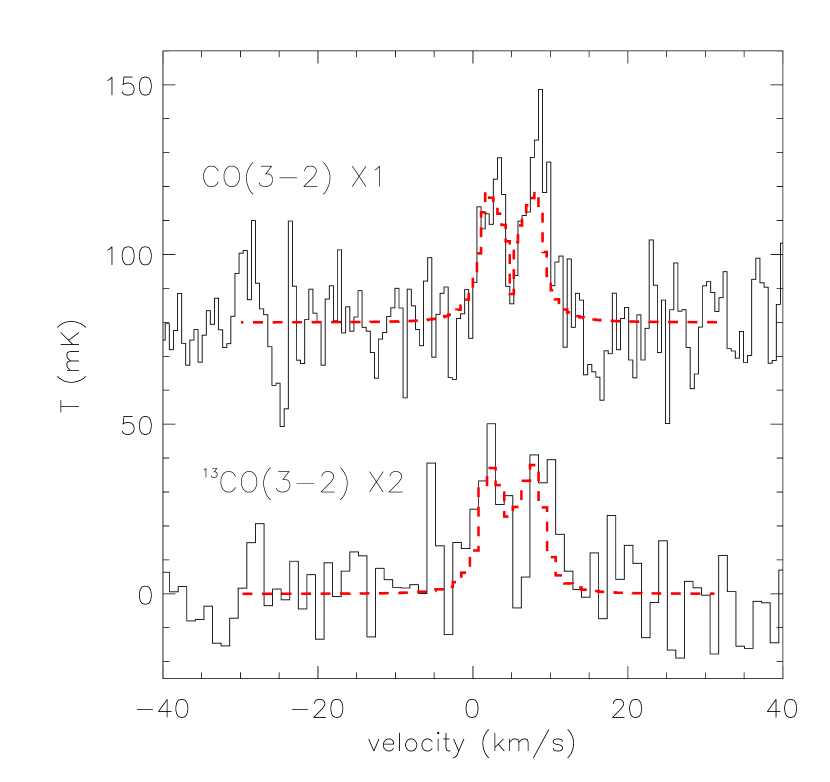
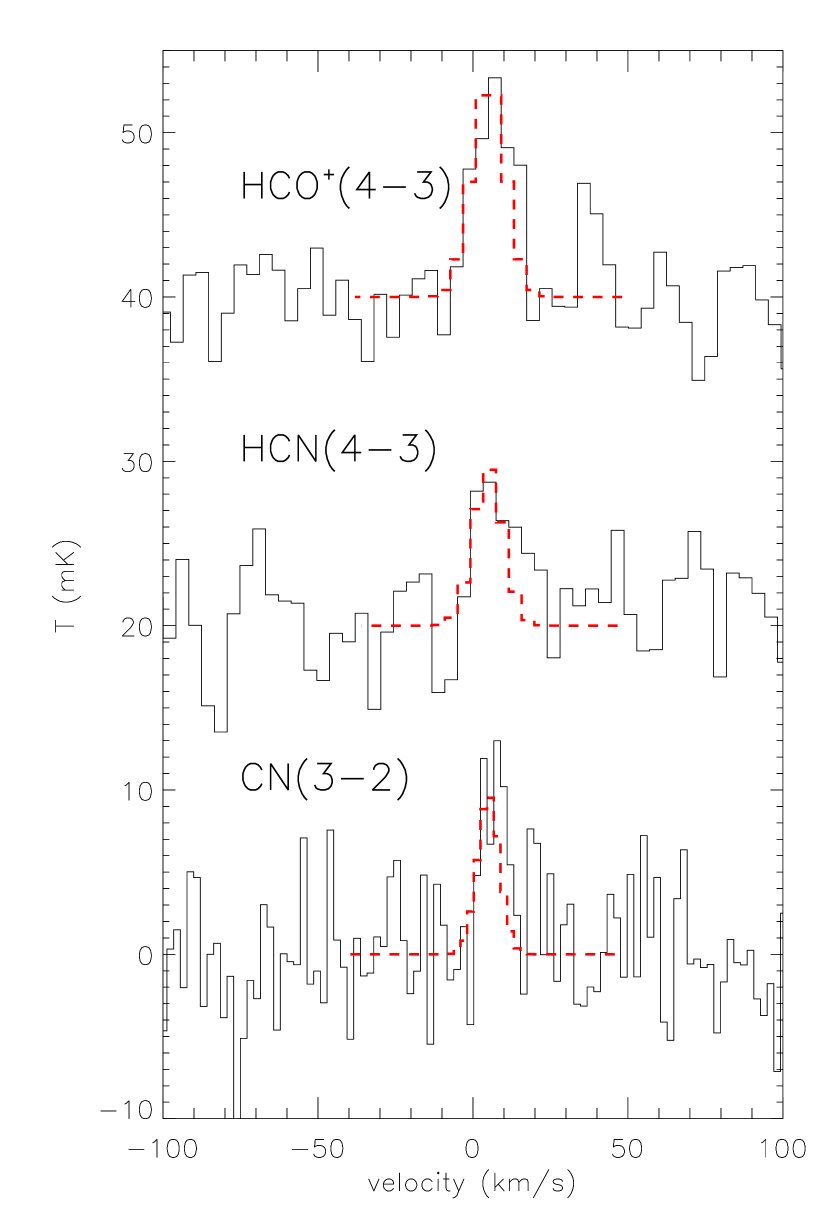
In Figures 1 and 2 we display the results for emission from the T Cha disk in the 12CO (3-2), 13CO (3-2), HCO+ (4-3), HCN (4-3) and CN (3-2) transitions. Although somewhat noisy, the 12CO(3-2) line profile (and, possibly, the 13CO(3-2) line profile) appears to exhibit steep sides and a double-peaked shape, as expected in the case of emission from an orbiting molecular disk (e.g. Beckwith & Sargent 1993). Therefore, we fit the 12CO(3-2) line with a parametric representation of the line profile predicted by a Keplerian disk model, as described in Beckwith & Sargent (1993). This parametric model was used by Kastner et al. (2008, 2010) to analyze the molecular emission detected from V4046 Sgr and MP Mus. The parameters of this model are: the peak temperature ; the shift of the line centroid with respect to LSR, ; the half-value of the velocity separation between the two line peaks , which is equal to the radial velocity of the outer disk; the slope of the line wings ; and the slope of the central trough between the two peaks . The parameter describes the disk radial temperature profile , while , in the case of an edge-on disk, indicates the definition of the disk outer edge (i.e., for a nearly edge-on disk, =1 would correspond to a sharp outer edge, and a value indicates the lack of a sharp edge).
| Transition | Tpeak | vd | a𝑎aa𝑎aPower law index of the radial temperature profile within the disk. Fixed at a canonical value. | pdb𝑏bb𝑏bParameter that describes the outer disk cutoff. | Fluxc𝑐cc𝑐cConverted from to , using the conversion factor for APEX reported at the website http://www.apex-telescope.org/telescope/efficiency/ | |
|---|---|---|---|---|---|---|
| (GHz) | (mK) | () | () | |||
| 12CO (3-2) | 345.796000 | 38.12.3 | 3.50.2d𝑑dd𝑑dOne half of the differences between red and blue peak velocities. | 0.5 | 0.270.03 | 12.71.2 |
| 13CO (3-2) | 330.587960 | 20.05.4 | 3.5d,e𝑑𝑒d,ed,e𝑑𝑒d,efootnotemark: | 0.5 | 0.27e𝑒ee𝑒eAssumed equal to the value derived from the fit of the 12CO (3-2) line. | 7.02.1 |
| HCO+ (4-3) | 356.734242 | 13.23.6 | 5.51.2f𝑓ff𝑓f of the best fit Gaussian. | - | - | 7.42.5 |
| HCN (4-3) | 354.505469 | 9.53.9 | 4.91.6f𝑓ff𝑓f of the best fit Gaussian. | - | - | 4.92.5 |
| CN (3-2) | 340.247781 | 9.53.4 | 3.61.1f𝑓ff𝑓f of the best fit Gaussian. | - | - | 3.71.6 |
The best-fit parameters and the line fluxes determined from the model (with 1 errors) are reported in Table 2. To fit the 12CO(3-2) profile, we left all parameters free with the exception of the slope of the outer wings, , which was fixed to the canonical value 0.5 (Beckwith & Sargent 1993); to fit the 13CO(3-2) line, all parameters with the exception of were kept fixed at the values determined from the best fit to the 12CO(3-2) profile. The velocity of the line centroid ( km s-1, LSR) determined from the 12CO profile is in agreement with the radial velocity of T Cha (, after conversion to LSR), as measured by Guenther et al. (2007) via optical spectroscopy. However, our measurement is more accurate, since multiple optical spectroscopic observations of T Cha show that the radial velocity derived from the photospheric absorption lines is variable due either the presence of a low-mass companion or very strong stellar activity (Schisano et al. 2009).
The value of is consistent with the values determined for the gaseous disks orbiting V4046 Sgr and MP Mus (Kastner et al. 2008, 2010).
Due to the weakness of the line fluxes with respect to the noise, it is not possible to determine reliable Keplerian model parameter values from the line profiles of the other three transitions observed (HCO+, HCN and CN). Hence, we rebinned these data to coarser spectral resolution and fit all three lines with Gaussians whose central velocity was fixed to the value determined from 12CO, i.e., . The resulting best-fit Gaussian parameters and line fluxes (with errors) for HCO+, HCN, and CN are reported in Table 2.
3.2 X-ray emission
T Cha was observed with XMM-Newton on March 16, 2009 (ID 0550120601; P.I. M. Güdel). The star was well detected in this observation (as was a candidate wide-separation, low-mass companion; Kastner et al. 2012). Cursory results of spectral analysis performed on the XMM European Photon Imaging Camera (EPIC) detection of T Cha — specifically, an inferred intrinsic 0.3-10 keV X-ray luminosity of erg s-1 (assuming a distance of 66 pc) and intervening absorbing column of cm-2 — were reported by Güdel et al. (2010). Since T Cha lies well in the foreground of the Cha dark clouds (Torres et al. 2008), the large value of determined by Güdel et al. (2010) is evidently dominated by gas in the disk along the line of sight to the star. In light of our detection of cold molecular gas in the T Cha disk — and the likelihood that this cold gas is mainly responsible for the absorption of soft X-rays from T Cha — we have independently reduced and analyzed the archival XMM-Newton observation of T Cha, so as to re-examine the determination of and its dependence on assumed X-ray source spectral model parameters.
Standard SAS (v. 11.0) tasks were used to filter events and extract
EPIC pn, MOS1, and MOS2 spectra and spectral responses for T Cha.
The star was detected with all three instruments, with respective
count rates of 0.134, 0.064, and 0.062 counts s-1 over effective exposure
times of 3.06, 10.07, and 10.67 ks. We used XSPEC (v. 12.6) to fit the
filtered 0.15–8.0 keV X-ray spectra with a model consisting of a
two-component, optically thin thermal plasma (XSPEC model
vapec; Smith et al. 2001; Foster et al. 2012) suffering intervening
absorption (model wabs; Morrison & McCammon 1983). Plasma
model abundances were initially uniformly set to
0.8 times solar; this uniform-abundance model yielded an acceptable
fit to the EPIC spectra ( for 140 degrees of
freedom) for parameters of , ,
and an intrinsic assuming a distance
of 110 pc. However, this model fails
to reproduce a strong spectral feature near 1 keV
that would appear to be due to a blend of Ne ix and Ne x emission lines.
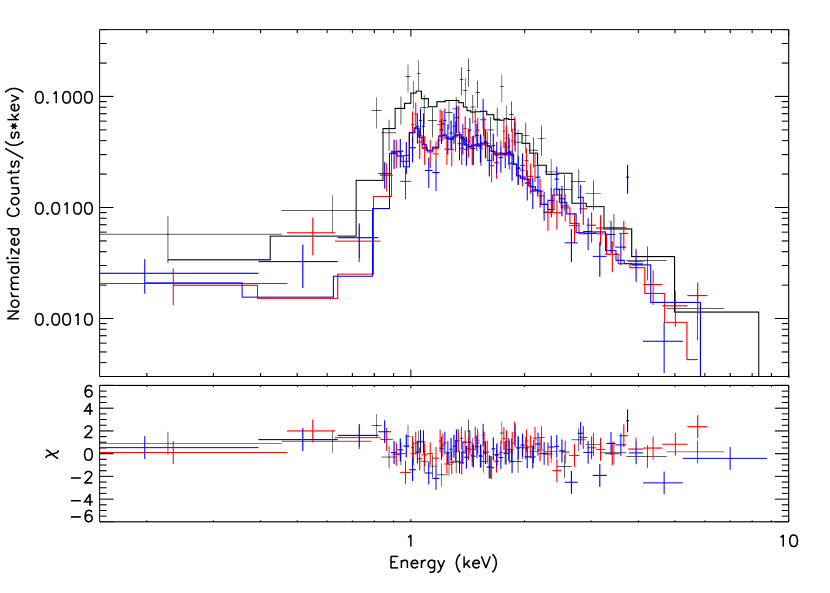
Hence, guided by the likelihood that the intrinsic X-ray spectrum of the T Cha source bears a strong resemblance to those of the weakly accreting (and more nearly pole-on) transition disk objects TW Hya (Kastner et al. 2002; Brickhouse et al. 2010) and V4046 Sgr (Günther et al. 2006), we chose a model abundance pattern determined for the former star’s X-ray source (specifically, Model C in Brickhouse et al. 2010). The pn and MOS spectra, overlaid with this best-fit model, are displayed in Fig. 3. We find best-fit temperatures of keV and keV and an intervening absorbing column of . It would appear that the T Cha EPIC spectra — including the 1 keV feature — are well described by this heavily-absorbed but otherwise “TW Hya-like” model (reduced 1.1 for 140 degrees of freedom). As the precise values of and are somewhat degenerate, their 90% confidence ranges were determined via a two-parameter analysis. Although this analysis indicates that the best-fit values are relatively robust, it is important to note that the fit results remain sensitive to the assumed X-ray source atomic abundances (see also discussion in §4.3).
The foregoing best-fit two-component model with “TW Hya-like” abundances yields integrated (0.15–8.0 keV) observed (absorbed) and intrinsic (unabsorbed) fluxes of and , respectively, where the large correction from to is due to the combination of large and relatively low soft-component temperature () required for the best model fit. Adopting a distance of 110 pc for T Cha, the value corresponds to an intrinsic X-ray luminosity of , implying (given from Schisano et al. 2009, assuming a distance of 110 pc).
4 Discussion
| Star | SpT | age | incl. | a𝑎aa𝑎aDerived from the fit of the 12CO line profile with a Keplerian disk model, using methods and assumptions described in Sect. 4.1, unless otherwise noted. | b𝑏bb𝑏bCalculated from the 13CO line flux, using methods and assumptions described in Sect. 4.1, unless otherwise noted. | b𝑏bb𝑏bCalculated from the 13CO line flux, using methods and assumptions described in Sect. 4.1, unless otherwise noted. | Ref | ||||
|---|---|---|---|---|---|---|---|---|---|---|---|
| () | (pc) | (Myr) | (∘) | (AU) | () | () | () | () | |||
| T Cha | K0 | 1.5 | 110 | 5-7 | 60 | 80 | 0.08 | 80 | 19715 | 7 | 1, 2, 3, 4 |
| MP Mus | K1 | 1.2 | 103 | 7 | 30 | 120 | 0.06c𝑐cc𝑐cCalculated from 12CO line flux, assuming the same flux ratio 12CO (3-2)/13CO (3-2) observed for T Cha (i.e ). | 60 | 4.61.8d𝑑dd𝑑dDerived from XMM-Newton high resolution spectroscopic observations. | 20 | 1, 5, 6, 7 |
| V4046 Sgr | K5+K7 | 1.75e𝑒ee𝑒eTotal mass of central binary. | 73 | 12-20 | 35 | 370f𝑓ff𝑓fDisk CO radius based on interferometric mapping. | 0.1 | 100 | 2-4g𝑔gg𝑔gRange of variability within a one week monitoring. | 20 | 8, 9, 10, 11, 12 |
| TW Hya | K7 | 0.7 | 54 | 8 | 6-7 | 200f𝑓ff𝑓fDisk CO radius based on interferometric mapping. | 0.02 | 20hℎhhℎhBergin et al. (2013) estimated from the Hydrogen deuteride a disk mass 3 orders of magnitude larger than our estimation from CO. | 4-30i𝑖ii𝑖iRange of values measured from different lines using high resolution Chandra data. | 60 | 13, 14, 15, 16 |
(1) Torres et al. (2008); (2) Olofsson et al. (2011); (3) this work; (4) Cieza et al. (2011); (5) Kastner et al. (2010) and refs. therein; (6) Argiroffi et al. (2007); (7) Carpenter et al. (2005); (8) Rodriguez et al. (2010); (9) Rosenfeld et al. (2012a) and refs. therein; (10) Binks & Jeffries (2013); (11) Kastner et al. (2008); (12) Argiroffi et al. (2012); (13) Rosenfeld et al. (2012b) and refs. therein; (14) Thi et al. (2004); (15) Brickhouse et al. (2010); (16) Thi et al. (2010). 444
4.1 Disk structure, mass, and gas/dust ratio
Given some simple assumptions, high spectral resolution observations of circumstellar 12CO and 13CO can be used to estimate the radius of the molecular disk, and the mass contained in the disk (see, e.g., Zuckerman et al. 2008; Kastner et al. 2010 and references therein). Under the assumption of pure Keplerian rotation, we can derive the disk radius from the best-fit value for the outer disk radial velocity (). Adopting a stellar mass (Olofsson et al. 2011) and an inclination angle (Olofsson et al. 2013), we estimate a disk radius AU. As can be noted from Table 3, this result for is similar to (though somewhat smaller than) the radius estimated via similar CO line profile analysis for MP Mus ( AU), and is much smaller than the CO disk outer radii measured for V4046 Sgr and TW Hya (370 and 200 AU, respectively) from interferometric observations of CO (Rodriguez et al. 2010; Qi et al. 2004; Rosenfeld et al. 2012b, a). However, the CO disk radius inferred for T Cha is not as small as its dust disk radius as determined from SED fitting, i.e., 30 AU (also assuming ; Cieza et al. 2011). This apparent discrepancy between molecular and dust disk dimensions is similar to that found via interferometric imaging for other similarly evolved disks (e.g., Andrews et al. 2012; Rodriguez et al. 2010; Rosenfeld et al. 2012a). We note that the radii of the molecular disks at V4046 Sgr and TW Hya estimated from the their CO line profiles (250 and 165 AU from Kastner et al. 2008 and Thi et al. 2004, respectively) were both smaller than the radii subsequently measured from interferometers (see preceding paragraph), but still larger than our estimate of the radius of the disk orbiting T Cha.
We estimated the disk mass from the 13CO line flux using equation A9 in Scoville et al. (1986), which has been used to derive masses of circumstellar disks by Zuckerman et al. (2008) and Kastner et al. (2008, 2010). To obtain the disk CO mass, we assume negligible 13CO optical depth, a CO excitation temperature (as measured for the TW Hya disk using interferometric observations of CO lines; Qi et al. 2004), a distance (Torres et al. 2008), and an isotopic ratio 13CO/12CO=69 (appropriate for the local ISM; Wilson 1999). To convert from CO to H2 mass, we then adopt a relative CO abundance of (inferred for the Taurus molecular cloud; Dutrey et al. 1997, and references therein).
The resulting disk H2 gas mass, , corresponds to a gas to dust mass ratio 12, adopting the dust mass derived by Cieza et al. (2011) from SED fitting. If compared with the canonical ISM value 100, this result would indicate that the circumstellar gas has dissipated faster than the dust component. However, we caution that the foregoing (CO-based) estimated mass and gas-to-dust mass ratio may be underestimated by a few orders of magnitude, given the uncertainties associated with our many assumptions. Specifically: (a) 13CO may not be optically thin; (b) the 13CO temperature may be lower than 20 K, as this temperature has been estimated from the optically thick 12CO emission that traces the upper, warmer layers of the disk; and (c) the CO abundance is likely , due to photodissociation of CO or freeze-out of CO into dust grains.
In Table 3, we compare the foregoing results for the disk gas mass of T Cha with the disk gas (CO and H2) masses of the other nearby (d100) accreting T Tauri stars TW Hya, V4046 Sgr and MP Mus, as recalculated from single-dish measurements of their submillimeter CO emission555For these disk mass calculations, we used the 13CO (3-2) and 13CO (2-1) line fluxes for TW Hya and V4046 Sgr, respectively; while for MP Mus, we estimated the 13CO (3-2) flux from the measured 12CO (3-2) line flux, assuming the same 13CO (3-2)/12CO (3-2) flux ratio observed for T Cha, which corresponds to an optical depth under the assumption that the 13CO (3-2) emission is optically thin. using the same method and assumptions666Values reported in Table 3 are slightly different from the values reported in Kastner et al. (1997, 2008, 2010) due to different assumptions for gas temperature, 12CO/13CO isotopic ratio, CO optical thickness, and CO abundance. as for T Cha. The disk around T Cha has a mass similar to those of the MP Mus and V4046 Sgr disks and about 3.5 times the mass of the TW Hya disk even though, as previously noted, the molecular disk radius estimated from the T Cha line profile is smaller than in the case of the three other, nearby T Tauri star disks listed in Table 3. Therefore, our observations of the gaseous disk component appear to confirm that the disk orbiting T Cha is small and dense, as suggested by Cieza et al. (2011) based on their analysis of mid- to far-IR continuum emission from dust. According to our estimates, the TW Hya disk is less massive and, therefore, less dense than the other disks; this is consistent with its 12CO optical depth, , which is smaller than the optical depths estimated for T Cha and V4046 Sgr ( and , respectively) using the same method. It is interesting that the disk masses of the four stars are correlated with the mass of the central stars, as already observed for the dust masses on a much larger sample of stars (Williams & Cieza 2011). However, more accurate interferometric observations of 13CO (3-2), 12CO and other isotopologues (i.e. C18O and C17O) are required to better investigate the structures of these circumstellar disks and thereby obtain more accurate estimates of their disk gas masses. Indeed, recent observations of the disks orbiting TW Hya and V4046 Sgr, combined with the results of detailed, self-consistent disk structure and radiative transfer modeling, indicate that their disk H2 gas masses (i.e., 0.05–0.1 ; Bergin et al. 2013; Rosenfeld et al. 2013) are 2–3 orders of magnitude larger than the CO-line-based values. Furthermore, in both cases, there are indications of significant variations in gas/dust mass ratio with disk radius (Andrews et al. 2012; Rosenfeld et al. 2013).
4.2 HCN, CN, HCO+ vs. 13CO: comparison with other transition disks
Our detection of T Cha in emission from HCN, CN, and HCO+, in addition to the two CO isotopologues, indicates that the chemical composition of cold gas in the T Cha disk is similar to that of other, similarly evolved disks. Specifically, the relative emission line fluxes we have measured for T Cha in the 0.8 mm regime (see Table 2) are generally similar to those measured for TW Hya and V4046 Sgr in the 1.3 mm and 0.8 mm regimes, respectively (Kastner et al. 1997, 2008), with the exception that T Cha appears to display somewhat weaker CN line emission relative to 13CO (and, as noted by Kastner et al. 2008, TW Hya displays anomalously strong emission from HCO+ relative to 13CO).
Kastner et al. (2008) compared line ratios of HCN, CN, and HCO+ emission with respect to 13CO for a small sample of (mostly) isolated T Tauri disks, finding correlations among the three ratios. These correlations were subsequently confirmed by Salter et al. (2011) on the basis of a larger sample of stars, including young stellar objects in Taurus. Kastner et al. (2008) pointed out that the relative abundances of HCN, CN, and HCO+ are expected to be enhanced in molecular gas that is irradiated by high-energy (ionizing) photons; the fact that TW Hya and V4046 Sgr appear particularly strong in all three of these tracers may then be indicative of their disks’ cumulative “doses” of X-ray ionization, due to irradiation by the central stars over their (relatively long) disk lifetimes. Although our results for T Cha are less than definitive in this regard, due to the low significance of our detections of 13CO, HCN, CN, and HCO+, it would appear that T Cha shows a similar pattern of enhanced HCN and HCO+ (if not CN) abundance, indicative of disk X-ray irradiation. Clearly, additional, higher-quality measurements of emission from the T Cha disk in these and other potential tracers of disk irradiation are warranted.
4.3 Implications of X-ray spectral analysis
In our X-ray spectral analysis (see Sect. 3.2), we confirm the basic result, previously obtained by Güdel et al. (2010), that the T Cha X-ray source is subject to an intervening absorbing column of order cm-2. We find, furthermore, that the inferred value of is not very sensitive to the adopted intrinsic X-ray source model. This column density is much larger than the values of determined for MP Mus, V4046 Sgr and TW Hya (see Table 3). This large discrepancy suggests that in stars harbouring disks seen at an high inclination angle, like T Cha (), the molecular disk is the main contributor to the X-ray absorption, while in the other stars which are viewed more nearly pole-on, like MP Mus, V4046 Sgr and TW Hya (see Table 3), atomic absorption can be due to material located much closer to the star (e.g. accretion columns connecting the inner disk to the stellar photosphere).
The ratio between atomic absorption and optical extinction lies in the range (1.2-4.6 mag). This is a factor 2–7 larger than the ratio observed in the ISM (, Ryter 1996), and larger than ratios observed for young stellar objects in the Orion Nebula Cluster (Feigelson et al. 2005). The ratio depends on the dust grain properties, but as discussed by Schisano et al. (2009) and Cieza et al. (2011), the dust grains within the T Cha disk are larger than ISM grains; hence, the extinction curve is flatter than characteristic of the ISM (i.e., for T Cha; Schisano et al. 2009) and, as a result, we would expect the ratio to be lower than the ISM value (Draine 2003). Thus, the relatively large value of appears to indicate that the fraction of metals in the gas phase is higher than in the dust phase, since metals (especially C, N, and O) are the main contributors to X-ray absorption (Morrison & McCammon 1983; Vuong et al. 2003).
We caution, however, that the standard X-ray absorption model we and others employ to determine has been developed for physical conditions appropriate to the ISM (e.g., 20% of H in molecular form; Wilms et al. 2000). Hence, application of this same ISM-based model to the evolved circumstellar disk orbiting T Cha — in which the gas is likely predominantly molecular, and the gas/dust mass ratio may vary significantly along the line of sight (e.g., Andrews et al. 2012; Rosenfeld et al. 2013) — implies there may be large systematic uncertainties in the results for . Development of an X-ray absorption model appropriate for the molecular-to-atomic gas fractions and molecular abundances characteristic of circumstellar disks would reduce these uncertainties, although such an effort is clearly beyond the scope of this paper.
Significantly, given the assumption that the abundance patterns in X-ray-emitting plasma are “TW Hya-like”, the X-ray spectral model fitting provides evidence for the presence of a soft plasma component, with characteristic temperature K. A similarly soft plasma component has been observed in several classical (actively accreting) T Tauri stars — most notably (for present purposes), the other three stars in Table 3, i.e., TW Hya, V4046 Sgr, and MP Mus (Kastner et al. 2002; Argiroffi et al. 2007, 2012). As in these cases, the presence of such a component in the T Cha X-ray spectrum could be indicative of soft X-ray emission produced by shocks at the base of accretion columns.
On the other hand, as a consequence of the large inferred value of , the intrinsic X-ray luminosity implied by the presence of such a soft component would make T Cha unusually X-ray luminous among T Tauri stars. Specifically, our model fitting implies , i.e., roughly an order of magnitude larger than typical of T Tauri stars (e.g., Kastner et al. 2012, and refs. therein). Again, however, we caution that the inference of luminous, soft X-ray emission from T Cha rests in large part on the accuracy of the model describing X-ray absorption within its circumstellar disk. Furthermore, as discussed in Brickhouse et al. (2010) and Sacco et al. (2010), any soft component attributed to accretion shocks may be affected by chromospheric absorption, depending on the location of the post-shock zone. X-ray gratings spectroscopy observations of T Cha are therefore required to more conclusively demonstrate the presence of accretion-shock-generated X-ray emission from the star.
Interestingly, our X-ray spectral fitting results are very similar to those obtained by Skinner & Güdel (2013) for the transition disk system LkCa 15 — which, like T Cha, is viewed at relatively high inclination (; Piétu et al. 2007). In particular, both the T Cha and LkCa 15 X-ray spectral analyses reveal evidence for a ”cool” ( K) plasma component that dominates the total X-ray flux but is heavily absorbed, due (presumably) to intervening disk material.
5 Conclusions
We have performed a series of submm observations of T Cha with the APEX 12 m radiotelescope, and we reanalyzed the available XMM-Newton archival X-ray data for this star, with the aim of studying the physical and chemical properties of its circumstellar disk. We obtained the following main results:
-
1.
We detected molecular emission from the T Cha disk, providing the first evidence for the presence of cold gas out to large radii from the star (i.e., 10 AU). Specifically, we detected and measured the fluxes of the 12CO (3-2), 13CO (3-2), HCO+ (4-3), HCN (4-3) and CN (3-2). The 12CO (3-2) line profile (and, possibly, 13CO (3-2) line profile) is double-peaked, indicative of Keplerian rotation.
-
2.
T Cha joins TW Hya, V4046 Sgr, and MP Mus as the fourth nearby ( pc) classical T Tauri star of roughly solar mass and age of at least 5 Myr, that is known to harbour a molecular disk. Its detection in radio molecular line emission further strengthens the connection between the presence of a cold, gaseous disk and signatures of stellar accretion, even in stars in an advanced stage of the pre-main sequence phase (Kastner et al. 2010).
-
3.
From a parametric fit of a Keplerian disk model line profile to the measured 12CO (3-2) line profile, we find an outer disk projected rotational velocity of km s-1. Under the assumption of pure Keplerian rotation and a disk inclination angle , this value of implies an outer disk radius AU. This CO disk radius is smaller than the radii measured interferometrically for other, similar transition disks, such as TW Hya and V4046 Sgr. However, the CO radius we infer for the T Cha disk is significantly larger than the dust disk radius previously deduced from its infrared SED. Submillimeter interferometric observations of T Cha that can provide direct measurements of the disk’s geometrical properties are clearly warranted.
-
4.
From the 13CO (3-2) line flux, we estimate a total disk gas mass and a gas-to-dust mass ratio , where the latter is based on a disk dust mass estimate from the literature (Cieza et al. 2011). These values are similar to those obtained for other disks of similar age. However, we caution that such (single-dish, CO-based) estimates may suffer from large uncertainties, most of which may lead to severe underestimates in disk gas mass.
-
5.
From a reanalysis of archival XMM-Newton X-ray observations, we find T Cha has an intrinsic X-ray luminosity , with an intervening atomic absorbing column of . The X-ray spectral analysis yields evidence for a strong soft component, possibly indicative of accretion shocks. The relatively large value of is indicative of absorption due to intervening gas that resides in the (highly inclined) T Cha disk. The resulting inferred ratio between atomic absorption and visual extinction for the T Cha disk lies in the range 4–16. This is somewhat larger than the ratios characteristic of the ISM and star-forming clouds, indicating that the disk gas is rich in metals. However, a X-ray absorption model appropriate for the physical and chemical conditions of a circumstellar disk is required to address this issue.
-
6.
The intensities of HCO+ and HCN emission relative to 13CO measured for T Cha are similar to the relative HCO+ and HCN line intensities of the (similarly evolved) disks orbiting TW Hya and V4046 Sgr. The relative intensity of CN line emission appears somewhat weaker in the case of T Cha, but due to the low signal-to-noise ratio of our detection, this discrepancy is not strongly significant. Additional, more sensitive measurements of the T Cha disk in these tracers may clarify whether the disk displays chemical signatures of the ionizing effects of X-ray irradiation — as would be expected given the clear indications, from XMM-Newton X-ray spectroscopy, of a large X-ray absorbing column due to intervening disk material.
Acknowledgements.
We would like to thank the anonymous referee for useful and constructive comments and S. Murphy for the discussion about the distance and the age of T Cha. This publication is based on data acquired with the Atacama Pathfinder Experiment (APEX). APEX is a collaboration between the Max-Planck-Institut fur Radioastronomie, the European Southern Observatory, and the Onsala Space Observatory. This research was supported in part by U.S. National Science Foundation grant AST-1108950 to RIT.References
- Alencar & Batalha (2002) Alencar, S. H. P. & Batalha, C. 2002, ApJ, 571, 378
- Andrews et al. (2012) Andrews, S. M., Wilner, D. J., Hughes, A. M., et al. 2012, ApJ, 744, 162
- Argiroffi et al. (2012) Argiroffi, C., Maggio, A., Montmerle, T., et al. 2012, ApJ, 752, 100
- Argiroffi et al. (2007) Argiroffi, C., Maggio, A., & Peres, G. 2007, A&A, 465, L5
- Beckwith & Sargent (1993) Beckwith, S. V. W. & Sargent, A. I. 1993, ApJ, 402, 280
- Bergin et al. (2013) Bergin, E. A., Cleeves, L. I., Gorti, U., et al. 2013, Nature, 493, 644
- Binks & Jeffries (2013) Binks, A. S. & Jeffries, R. D. 2013, MNRAS, in press
- Brickhouse et al. (2010) Brickhouse, N. S., Cranmer, S. R., Dupree, A. K., Luna, G. J. M., & Wolk, S. 2010, ApJ, 710, 1835
- Brown et al. (2007) Brown, J. M., Blake, G. A., Dullemond, C. P., et al. 2007, ApJ, 664, L107
- Carpenter et al. (2005) Carpenter, J. M., Wolf, S., Schreyer, K., Launhardt, R., & Henning, T. 2005, AJ, 129, 1049
- Cieza et al. (2011) Cieza, L. A., Olofsson, J., Harvey, P. M., et al. 2011, ApJ, 741, L25
- Curran et al. (2011) Curran, R. L., Argiroffi, C., Sacco, G. G., et al. 2011, A&A, 526, A104
- Draine (2003) Draine, B. T. 2003, ARA&A, 41, 241
- Dutrey et al. (1997) Dutrey, A., Guilloteau, S., & Guelin, M. 1997, A&A, 317, L55
- Dutrey et al. (2008) Dutrey, A., Guilloteau, S., Piétu, V., et al. 2008, A&A, 490, L15
- Dutrey et al. (1994) Dutrey, A., Guilloteau, S., & Simon, M. 1994, A&A, 286, 149
- Feigelson et al. (2005) Feigelson, E. D., Getman, K., Townsley, L., et al. 2005, ApJS, 160, 379
- Foster et al. (2012) Foster, A. R., Ji, L., Smith, R. K., & Brickhouse, N. S. 2012, ApJ, 756, 128
- Güdel et al. (2010) Güdel, M., Lahuis, F., Briggs, K. R., et al. 2010, A&A, 519, A113
- Guenther et al. (2007) Guenther, E. W., Esposito, M., Mundt, R., et al. 2007, A&A, 467, 1147
- Günther et al. (2006) Günther, H. M., Liefke, C., Schmitt, J. H. M. M., Robrade, J., & Ness, J.-U. 2006, A&A, 459, L29
- Güsten et al. (2006) Güsten, R., Nyman, L. Å., Schilke, P., et al. 2006, A&A, 454, L13
- Huélamo et al. (2011) Huélamo, N., Lacour, S., Tuthill, P., et al. 2011, A&A, 528, L7
- Hughes et al. (2011) Hughes, A. M., Wilner, D. J., Andrews, S. M., Qi, C., & Hogerheijde, M. R. 2011, ApJ, 727, 85
- Kastner et al. (2010) Kastner, J. H., Hily-Blant, P., Sacco, G. G., Forveille, T., & Zuckerman, B. 2010, ApJ, 723, L248
- Kastner et al. (2002) Kastner, J. H., Huenemoerder, D. P., Schulz, N. S., Canizares, C. R., & Weintraub, D. A. 2002, ApJ, 567, 434
- Kastner et al. (2012) Kastner, J. H., Thompson, E. A., Montez, R., et al. 2012, ApJ, 747, L23
- Kastner et al. (2008) Kastner, J. H., Zuckerman, B., Hily-Blant, P., & Forveille, T. 2008, A&A, 492, 469
- Kastner et al. (1997) Kastner, J. H., Zuckerman, B., Weintraub, D. A., & Forveille, T. 1997, Science, 277, 67
- Morrison & McCammon (1983) Morrison, R. & McCammon, D. 1983, ApJ, 270, 119
- Murphy et al. (2013) Murphy, S. J., Lawson, W. A., & Bessell, M. S. 2013, MNRAS, 435, 1325
- Nehmé et al. (2008) Nehmé, C., Gry, C., Boulanger, F., et al. 2008, A&A, 483, 471
- Öberg et al. (2010) Öberg, K. I., Qi, C., Fogel, J. K. J., et al. 2010, ApJ, 720, 480
- Öberg et al. (2011) Öberg, K. I., Qi, C., Fogel, J. K. J., et al. 2011, ApJ, 734, 98
- Olofsson et al. (2011) Olofsson, J., Benisty, M., Augereau, J.-C., et al. 2011, A&A, 528, L6
- Olofsson et al. (2013) Olofsson, J., Benisty, M., Le Bouquin, J.-B., et al. 2013, A&A, 552, A4
- Pascucci & Sterzik (2009) Pascucci, I. & Sterzik, M. 2009, ApJ, 702, 724
- Piétu et al. (2007) Piétu, V., Dutrey, A., & Guilloteau, S. 2007, A&A, 467, 163
- Qi et al. (2004) Qi, C., Ho, P. T. P., Wilner, D. J., et al. 2004, ApJ, 616, L11
- Qi et al. (2008) Qi, C., Wilner, D. J., Aikawa, Y., Blake, G. A., & Hogerheijde, M. R. 2008, ApJ, 681, 1396
- Qi et al. (2006) Qi, C., Wilner, D. J., Calvet, N., et al. 2006, ApJ, 636, L157
- Rodriguez et al. (2010) Rodriguez, D. R., Kastner, J. H., Wilner, D., & Qi, C. 2010, ApJ, 720, 1684
- Rosenfeld et al. (2013) Rosenfeld, K. A., Andrews, S. M., Wilner, D. J., Kastner, J. H., & McClure, M. K. 2013, ApJ, submitted
- Rosenfeld et al. (2012a) Rosenfeld, K. A., Andrews, S. M., Wilner, D. J., & Stempels, H. C. 2012a, ApJ, 759, 119
- Rosenfeld et al. (2012b) Rosenfeld, K. A., Qi, C., Andrews, S. M., et al. 2012b, ApJ, 757, 129
- Ryter (1996) Ryter, C. E. 1996, Ap&SS, 236, 285
- Sacco et al. (2012) Sacco, G. G., Flaccomio, E., Pascucci, I., et al. 2012, ApJ, 747, 142
- Sacco et al. (2010) Sacco, G. G., Orlando, S., Argiroffi, C., et al. 2010, A&A, 522, A55
- Salter et al. (2011) Salter, D. M., Hogerheijde, M. R., van der Burg, R. F. J., Kristensen, L. E., & Brinch, C. 2011, A&A, 536, A80
- Schisano et al. (2009) Schisano, E., Covino, E., Alcalá, J. M., et al. 2009, A&A, 501, 1013
- Scoville et al. (1986) Scoville, N. Z., Sargent, A. I., Sanders, D. B., et al. 1986, ApJ, 303, 416
- Skinner & Güdel (2013) Skinner, S. L. & Güdel, M. 2013, ApJ, 765, 3
- Smith et al. (2001) Smith, R. K., Brickhouse, N. S., Liedahl, D. A., & Raymond, J. C. 2001, ApJ, 556, L91
- Thi et al. (2010) Thi, W., Mathews, G., Ménard, F., et al. 2010, A&A, 518, L125+
- Thi et al. (2004) Thi, W.-F., van Zadelhoff, G.-J., & van Dishoeck, E. F. 2004, A&A, 425, 955
- Torres et al. (2008) Torres, C. A. O., Quast, G. R., Melo, C. H. F., & Sterzik, M. F. 2008, Young Nearby Loose Associations, ed. Reipurth, B., 757
- Vuong et al. (2003) Vuong, M. H., Montmerle, T., Grosso, N., et al. 2003, A&A, 408, 581
- Williams & Cieza (2011) Williams, J. P. & Cieza, L. A. 2011, ARA&A, 49, 67
- Wilms et al. (2000) Wilms, J., Allen, A., & McCray, R. 2000, ApJ, 542, 914
- Wilson (1999) Wilson, T. L. 1999, Reports on Progress in Physics, 62, 143
- Zuckerman et al. (1995) Zuckerman, B., Forveille, T., & Kastner, J. H. 1995, Nature, 373, 494
- Zuckerman et al. (2008) Zuckerman, B., Melis, C., Song, I., et al. 2008, ApJ, 683, 1085