Evidence for an Interaction in the nearest
Starbursting Dwarf Irregular Galaxy IC 10
Abstract
Using deep 21-cm H I data from the Green Bank Telescope we have detected an 18.3 kpc–long gaseous extension associated with the starbursting dwarf galaxy IC 10. The newly-found feature stretches 1.3to the northwest and has a large radial velocity gradient reaching to 65 km slower than the IC 10 systemic velocity. A region of higher column density at the end of the extension that possesses a coherent velocity gradient (10 km sacross 26′) transverse to the extension suggests rotation and may be a satellite galaxy of IC 10. The H I mass of IC 10 is 9.5107 (/805 kpc)2 Mand the mass of the new extension is 7.1105 (/805 kpc)2 M⊙. An IC 10–M31 orbit using known radial velocity and proper motion values for IC 10 show that the H I extension is inconsistent with the trailing portion of the orbit so that an M31–tidal or ram pressure origin seems unlikely. We argue that the most plausible explanation for the new feature is that it is the result of a recent interaction (and possible late merger) with another dwarf galaxy. This interaction could not only have triggered the origin of the recent starburst in IC 10, but could also explain the existence of previously-found counter-rotating H I gas in the periphery of the IC 10 which was interpreted as originating from primordial gas infall.
Subject headings:
galaxies: dwarf — galaxies: individual (IC 10) — galaxies: interactions — galaxies: kinematics and dynamics — galaxies: starburst — Local Group1. Introduction
IC 10 is a blue compact dwarf (BCD; Richer et al., 2001) galaxy in the Local Group (LG) and is the closest known starburst galaxy. It is one of the more distant satellite galaxies in the M31 group (250 kpc) and lies in the thin plane of M31 corotating satellite galaxies (Ibata et al., 2013; Tully, 2013). IC 10 is believed to be currently isolated from other known galaxies (Hunter & Elmegreen, 2004), but studies of its youngest stars show that the starburst is only 10 Myr old (Massey et al., 2007).
What regulates star formation in BCDs, and dwarf galaxies in general, is not well understood. BCDs have high star formation rates that give rise to bluer colors than for other dwarf galaxies (Kunth, 1995) and were originally singled out for their compact stellar appearance on photographic plates (Zwicky, 1966). BCDs cannot long sustain a starburst; they should deplete their gas reservoirs in years without additional gas accretion (Gil de Paz & Madore, 2005). Thus, it is likely that something has recently triggered this burst of star formation (Schulte-Ladbeck et al., 2001; Crone et al., 2002).
It has often been speculated that most BCDs are the result of a recent dwarf-dwarf merger or a gravitational interaction (Noeske et al., 2001; Pustilnik et al., 2001b; Bekki, 2008), but studies show that there are still many BCDs found with no nearby companions (van Zee, 2001; Zitrin et al., 2009; Koulouridis et al., 2013), making a merger or recent interaction unlikely. In cases such as these other possible triggers have been adopted, for example: faint companions, past mergers, intergalactic gas accretion, dark matter satellites, and gas sloshing about in dark matter potentials (Helmi et al., 2012; Simpson et al., 2011; Noeske et al., 2001). IC 10’s proximity (805 kpc; Sanna et al., 2008) and apparent isolation make it an excellent candidate for studying star formation and alternative triggers in starburst dwarf galaxies.
Previous atomic hydrogen (H I) studies of IC 10 found a wide H I envelope (Huchtmeier, 1979), an inner rotating disk, and counter-rotating gas in the periphery often thought to be caused by infalling primordial gas (e.g., Shostak & Skillman, 1989; Wilcots & Miller, 1998). The inner region of IC 10 contains H I holes and shells thought to be shaped by stellar winds (Wilcots & Miller, 1998) from the burst of star formation in IC 10.
Wilcots & Miller (1998) analyzed high resolution H I data of IC 10 and concluded that IC 10 could be the result of an interaction or merger, but that IC 10’s gas is so chaotic that it is more likely a galaxy still in formation, accreting cosmological gas around it. Still, the possibility that IC 10 is the result of a merger or interaction could not be ruled out.
If an interaction or merger has recently occurred in IC 10, then there should be signatures of that event in the H I, such as tidal tails or bridges (Toomre & Toomre, 1972), or components of a previously unknown companion, that may be too tenuous or large to have been seen in previous studies. Single dish H I observations of IC 10 by Huchtmeier (1979) have shown that the H I pool of IC 10 extends to seven times its optical diameter at a column density of with no obvious signatures of a tidal interaction or merger. However, signatures of environmental influences may be hidden at sensitivities as low as (e.g., Johnson, 2013).
In this Letter, we present new results from the combination of two Green Bank Telescope surveys in the vicinity of IC 10 that reveal a long gaseous northern extension. In Section 2, we present the observations and their reduction. In Section 3, we give results of our analysis of these data, and, finally, in Section 4 we discuss the origin of the newly-found H I extension and its significance.
| Parameter | Value |
|---|---|
| GBT Observations: | |
| Resolution | 9.1′ |
| RMS noise | 21 mK per channel |
| 3 sensitivity over 20 km s-1 | 6.51017 atoms cm-2 |
| IC 10 galaxy: | |
| Coordinates (J2000) | =00:20:23.16, =+59:17:34 |
| Coordinates (Galactic) | =118.97°, =3.334° |
| Distance | 805 kpc |
| 9.5107 M | |
| New northern extension: | |
| Length | 1.3°, 18.3 kpc |
| Width | 0.37°, 5.2 kpc |
| Orientation | 25west of north |
| Velocity offset | 65 km sbelow systemic |
| 71017 atoms cm-2 | |
| 7.1105 M |
2. Observations And Data Reduction
Data from two independent Robert C. Byrd Green Bank Telescope (GBT) H I surveys were combined to produce the sensitive datacube of IC 10 used for our analysis: (1) A survey of the tip of the Magellanic Stream (MS) (D. Nidever et al., in prep.), and (2) a survey of a subset of galaxies from the LITTLE THINGS survey111https://science.nrao.edu/science/surveys/littlethings (Hunter et al., 2012).
The MS survey used the GBT to conduct a 300 deg2, 21–cm survey of the MS-tip and map the MS emission across the Milky Way (MW) midplane (proposal IDs: GBT10B-035 and GBT11B-082). The results and more details on our MS-tip GBT survey will be presented in a future paper (D. Nidever et al., in prep.).
The MS-tip observations used the “On-the-Fly” (OTF) mapping mode (scanning in Right Ascension) to obtain frequency-switched, 21-cm spectral line data with the Spectrometer backend at a resolution of 0.32 km s-1. Each integration (spaced by 4.0) was covered twice with a total integration time of 18 seconds on average. The 435 hours of observing were taken throughout 2010 and 2011.
The MS-tip data reduction was perfomed in a similar manner to that described in Nidever et al. (2010, hereafter N10) but with some improvements. We used the GETFS program in GBTIDL222http://gbtidl.nrao.edu/ to obtain calibrated frequency-switched spectra for every position and polarization. To reduce the noise, the reference spectra were smoothed with a 16-channel boxcar smoothing box. Radio frequency interference (RFI) was automatically detected in both the signal and reference spectra. RFI is detected as large positive spikes in the average spectrum (as a function of observed frequency, not velocity) of a scan after a 3-channel median filter has been subtracted to remove real structure. Channels with RFI were flagged in the signal spectra but interpolated over (using neighboring “good” channels) in the reference spectra (so as not to contaminate the signal spectra at these channels). The data were averaged over five velocity bins (giving a velocity resolution of 1.6 km s-1) and then our special-purpose baseline fitting and removal routines (as described in N10) were used. An additional baseline removal step was performed to remove some residual structure by fitting a cubic B-spline (with breakpoints every 50 channels or 80 km s-1) to blocks of 500 integrations with iterative outlier rejection. The final spectra in a region around IC 10 were resampled onto a grid in Galactic coordinates at 4 spacing and multiple passes were combined with exposure time weighting.
Observations for the second survey (proposal ID: GBT13A_430) were obtained in a manner similar to those by the MS-tip survey except that the OTF mapping scanned in Galactic Longitude, the velocity resolution was 0.16 km s-1, and the integrations were spaced by 3.5. The GETFS program was used to obtain calibrated spectra, and RFI were flagged by hand and interpolated over using non-contaminated neighboring channels. The data were boxcar smoothed to a velocity width of 1.6 km sand a 2nd or 3rd-order polynomial baseline was subtracted. The N10 special-purpose baseline fitting and extra B-spline baseline removal procedures were also performed on the data of the second survey. The final spectra were cubic spline interpolated onto the final velocity scale of the MS-tip data. Finally, the spectra were resampled onto the Galactic coordinate grid and combined with the MS-tip data with exposure time weighting.
3. Results
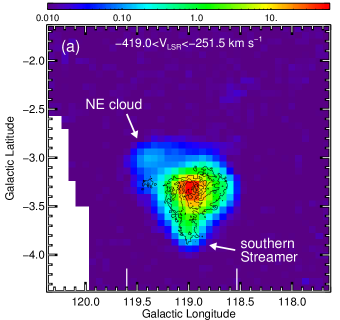
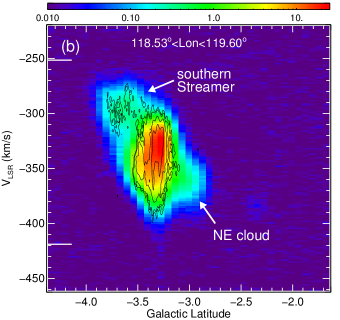
Previous, higher-resolution interferometry data show a regularly rotating inner H I disk extending out to 4′ in radius (Cohen, 1979; Shostak & Skillman, 1989; Wilcots & Miller, 1998; Manthey & Oosterloo, 2008) with a significant inclination (Shostak & Skillman derive 40while Wilcots & Miller find a larger value of 60–90°) and rotation velocity of 30 km s-1. Several extended H I features have been seen with kinematics consistent with either a warped disk (Cohen, 1979) or a counter-rotating disk (Wilcots & Miller, 1998). There are several “spurs,” a southern “streamer” (extending 30′ to the south), and a small gas cloud to the NE (Manthey & Oosterloo, 2008, 30′ to the northeast).
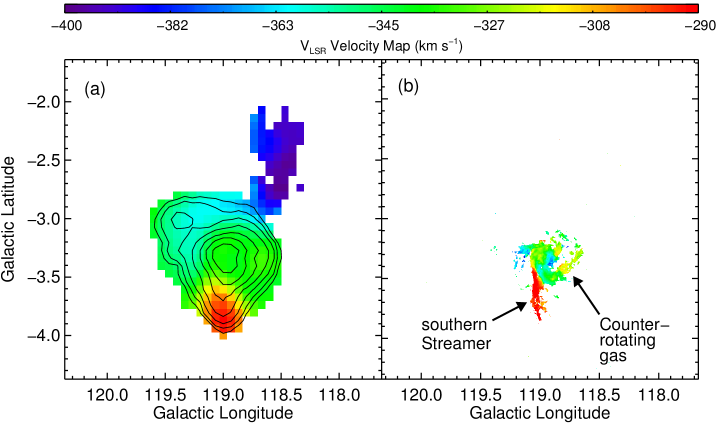
The Figure 1a color image shows the GBT column density map of the entire IC 10 ( km s-1)333Note that at the position of IC 10 the Galactic and equatorial coordinate axes are nearly aligned. with a 3 sensitivity of 1.91018 atoms cm-2, while contours show column density of the Manthey & Oosterloo (2008) WSRT data for comparison. The overall high-resolution morphology is also seen in our GBT data, albeit at lower spatial resolution than in the interferometry data.444A detailed comparison of LITTLE THINGS interferometry data and the GBT data will be presented in a future paper (T. Ashley et al., in preparation). The southern “streamer” stretches 37′ southward of the IC 10 center (Fig. 1a) and reaches the highest velocities in IC 10 at km s(Fig. 1b) . The NE cloud stretches 37′ to the northeast but to the lowest velocities in the main body of IC 10 at km s-1.
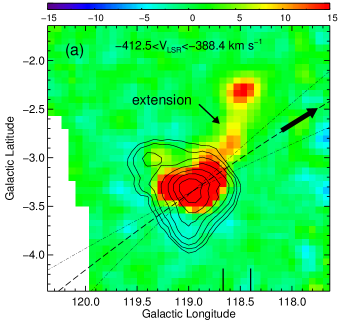
The high sensitivity and low side-bands of the GBT allows us to detect faint H I emission that was not seen (detectable) in previous datasets. Figure 2a shows a smoothed (with 12′ filter, giving an effective 15′ resolution) column density map integrated over velocities km swith a 3 sensitivity of 4.01017 atoms cm-2. This figure reveals a newly-found H I feature extending to the northwest (orientation of 25west of north), hereafter referred to as the “extension”.
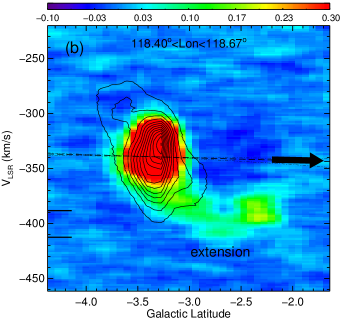
Figure 2b shows the latitude–velocity diagram for the longitude range where the H I extension is prominently seen (118.40118.67°). Contours show the emission from the entire body of IC 10 as shown in Figure 1a. The feature is seen as an arc extending 1.3to the north (°) and to km s(65 km sbelow the IC 10 systemic velocity). At a distance of 805 kpc this corresponds to a projected length of 18.3 kpc. The average width (in ) of the extension is 0.37or 5.2 kpc (at 805 kpc). There is also a higher-density concentration at the end of the feature (as seen in both panels of Fig. 2). It is difficult to discern the extension from the rest of IC 10 near the center of the galaxy, but the extension appears to stretch from near the center of IC 10 to its outskirts. The velocity map (Fig. 3a) shows a smooth velocity gradient from the extension to the edge of IC 10 and continuing into the main body. For the latitudes where the extension is clearly seen we summed spectra across the extension (in longitude) and fit the resulting velocity profiles with a Gaussian. The column density of the extension drops with distance from the center of IC 10 (as also seen in Fig. 2a) but increases near the end. The mean column density of the extension is 71017 atoms cm-2. The mass of the extension is 7.1105 (/805 kpc)2 Mwhich is only 0.75% of the 9.5107 (/805 kpc)2 Mmass of the entire IC 10 galaxy as measured by our GBT data.
In the latitude–velocity diagram (Fig. 2b) the southern streamer and extension appear symmetric (in position and velocity) about the IC 10 center. They are also nearly aligned on the sky (although having different angular lengths) as seen in Figure 2a and the WSRT data in Figure 1b. However, they have column densities that differ by a factor of 70 which makes a connection between these two features tenuous.
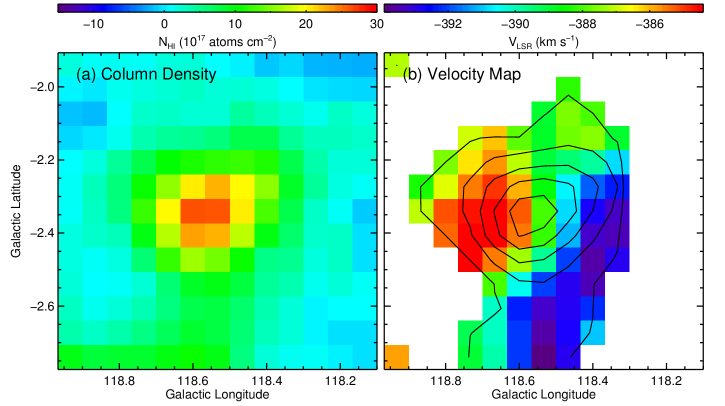
The higher column density region at the end of the extension is azimuthally-symmetric (Fig. 4a), 26′ (6.1 kpc) across, and has a mass of 3.5105 (/805 kpc)2 M⊙. The velocity map in Figure 4b shows a coherent velocity gradient across the region (10 km sfrom one end to the other, or 1.7 km skpc-1) that is perpendicular to the length of the extension (which has a velocity gradient along it).
4. Origin of the H I Extension
There are several possible origins of the newly-found northern extension: interactions of IC 10 with M31 (either tidal or ram pressure), interaction of IC 10 with the diffuse intergalactic medium (IGM), interactions of IC 10 with a companion galaxy, cold accretion, or stellar feedback (a suggested contributing factor in the creation of the Magellanic Stream; Nidever et al. 2008) from the IC 10 starburst itself.
Unlike most LG dwarf galaxies outside the MW, IC 10 has a measured proper motion from VLBA masers (Brunthaler et al., 2007). This allows us to produce a fairly accurate model of the IC 10 orbit. For IC 10 we use our measured GBT radial velocity ( km s-1), the Brunthaler et al. proper motions, and a distance of 805 kpc (Sanna et al., 2008). For M31, we use a distance of 770 kpc (van der Marel & Guhathakurta, 2008), a radial velocity of km s(Courteau & van den Bergh, 1999), and the recent proper motions from van der Marel et al. (2012). A mass of 1.41012 Mis used for M31 (Watkins et al., 2010)555The uncertainties in the M31 mass have little impact on the final IC 10 orbit., modeled as a static Plummer potential with 9 kpc softening parameter, while a 3-component static MW potential is used (Johnston et al., 1995). We adopted =8.29 for the solar radius and =239 km sfor the local standard of rest velocity (McMillan, 2011), as well as the Schönrich et al. (2010) values for the sun’s peculiar velocity. A modified version of the Hut & Makino (2003) Gravitylab N-body integrator code was used to perform the orbit calculations. A Monte Carlo simulation with 1000 mocks sampling the error space for all input parameters was performed and used to calculate the 1 uncertainties in the orbit (dash-dotted lines in Fig. 2).
As seen in Figure 2a the orbit of IC 10 runs diagonally from the southeast to the northwest. While the orientation of the extension is generally aligned with the orbit, it is leading IC 10 in its orbit. Therefore, the new extension cannot be due to ram pressure from the M31 halo gas or the intergalactic medium because ram pressure produces trailing tails. Moreover, the latitude–velocity diagram in Figure 2b shows that the change in velocity of the orbit is very small and cannot reproduce the large velocity gradient along the extension. This is in stark contrast to the Magellanic Stream where the large observed radial velocity gradient is also seen in the LMC’s orbit (e.g., Besla et al., 2010) indicating that the Milky Way’s gravitational force has been an important factor in shaping the velocities of the Stream. In addition, IC 10’s orbital period about M31 is 6.3 Gyr (with no mock periods shorter than 3.8 Gyr and 13% larger than a Hubble time) with the last perigalacticon 1.88 Gyr ago at a distance of 82 kpc. It is, therefore, very unlikely that the newly-found IC 10 H I extension can be explained by an M31–IC 10 tidal interaction.
Could stellar feedback from the starburst have created the H I extension? According to Massey et al. (2007), the high number of Wolf-Rayet stars and lack of young red supergiants indicates that IC 10’s starburst is quite young, roughly 10 Myr. Therefore, to create an 18 kpc–long extension in 10 Myr would require an outflow velocity (in the plane of the sky) of 18 kpc/0.01 Gyr1800 km s-1! This is vastly larger than the extension velocity offset of 65 km sobserved. Due to this timing argument we rule out a starburst origin of the extension.
Nearby primordial gas being accreted onto IC 10 counter to the rotation of the main body could also explain these outer H I features. Cold accretion has been suggested as a possible trigger for isolated starburst dwarf galaxies. The combined mass of the counter-rotating H I in the outskirts of IC 10 (beyond 13′ from the center) and the H I extension from our data is 3.3107 M⊙. However, there is no observational evidence of a population of 107 MH I clouds in intergalactic space that are fueling star formation in galaxies (Sancisi et al., 2008), although smaller clouds or filaments could exist in the IGM and be accreted. Therefore, if the counter-rotating gas and extension are from cold accretion alone, then the gas filament would be fairly massive. The detection of a stellar component would rule out a primordial gas cloud origin.
This leaves us with an interaction origin. If there was an interaction, then where is the companion galaxy? The higher column density region at the end of the H I extension with a coherent velocity gradient is a potential candidate for an interacting dwarf galaxy. If the velocity gradient is due to rotation, then an enclosed mass of 1.74107 Mis required to sustain 5 km scircular orbits at a radius of 3 kpc at the edge of the region (not accounting for any inclination effects). This would imply a massive dark matter or stellar component. We searched the publicly available 2MASS (Skrutskie et al., 2006), WISE (Wright et al., 2010), and POSS (Minkowski & Abell, 1963) images for stellar components of both the extension and the higher density region but found no convincing detection. This close to the MW midplane (=°) the dust extinction is high making a faint stellar component difficult to detect. Moreover, if the companion galaxy is similar to Leo T (Irwin et al., 2007), which contains 3 Mof H I and at a distance of 420 kpc was difficult to detect in SDSS star counts, then we would likely not have seen such a low surface brightness feature in the “shallow” images we inspected. Deep and wide-field photometry, like those obtained by Sanna et al. (2010), would likely be necessary to properly probe any stellar features. Another possibility is that the companion galaxy is located somewhere else and has so far eluded detection.
An interaction origin would naturally explain the starburst (i.e., as triggered by the interaction) and possibly the counter-rotating gas in the outer regions of IC 10 (i.e., by accreted gas from the companion galaxy). Moreover, an interaction origin of the IC 10 starburst would answer a long-standing mystery of how such a small and apparently isolated galaxy could have such a high star formation rate. Therefore, we find that a scenario of a recent dwarf-dwarf interaction is the most likely explanation for the newly-found H I extension.
The present discovery is reminiscent of another BCD, namely NGC 4449. NGC 4449 was proposed to be interacting with a nearby dwarf galaxy (Theis & Kohle, 2001), creating disturbed kinematics and morphology. However, upon further investigation a small, tidally distorted dwarf spheroidal was found nearby (Rich et al., 2012; Martínez-Delgado et al., 2012). This new companion to NGC 4449 would not had been found without deep optical observations. Another example is the starburst galaxy IZw18 that was recently found to have a long H I tail likely produced by an interaction (Lelli et al., 2012). Therefore, some apparently isolated dwarf galaxies may not be isolated at all, but have their bursts of star formation possibly triggered by interactions with undiscovered companions.
References
- Bekki (2008) Bekki, K. 2008, MNRAS, 388, L10
- Besla et al. (2010) Besla, G., Kallivayalil, N., Hernquist, L., et al. 2010, ApJ, 721, L97
- Brunthaler et al. (2007) Brunthaler, A., Reid, M. J., Falcke, H., Henkel, C., & Menten, K. M. 2007, A&A, 462, 101
- Cohen (1979) Cohen, R. J. 1979, MNRAS, 187, 839
- Courteau & van den Bergh (1999) Courteau, S., & van den Bergh, S. 1999, AJ, 118, 337
- Crone et al. (2002) Crone, M. M., Schulte-Ladbeck, R. E., & Greggio, L. 2002, ApJ, 567, 258
- Gil de Paz & Madore (2005) Gil de Paz, A. & Madore, B. F. 2005, ApJS, 156, 345
- Helmi et al. (2012) Helmi, A., Sales, L. V., Starkenburg, E. et al. 2012, ApJ, 758, L5
- Huchtmeier (1979) Huchtmeier, W. K. 1979, A&A, 75, 170
- Hunter (2001) Hunter, D. A. 2001, ApJ, 559, 225
- Hunter & Elmegreen (2004) Hunter, D. A. & Elmegreen, B. G. 2004, AJ, 128, 2170
- Hunter et al. (2012) Hunter, D. A., Ficut-Vicas, D., Ashley, T., et al. 2012, AJ, 144, 134
- Hut & Makino (2003) Hut, P. & Makino, J. 2003, “Moving Stars Around”, Vol.1–3 of “The Art of Computational Science”
- Ibata et al. (2013) Ibata, R. A., Lewis, G. F., Conn, A. R., et al. 2013, Nature, 493, 62
- Irwin et al. (2007) Irwin, M. J., Belokurov, V., Evans, N. W., et al. 2007, ApJ, 656, L13
- Johnson (2013) Johnson, M. 2013, AJ, 145, 146
- Johnston et al. (1995) Johnston, K. V., Spergel, D. N., & Hernquist, L. 1995, ApJ, 451, 598
- Koulouridis et al. (2013) Koulouridis, E., Pilionis, M., Chávez R., Terlevich, E. et al. 2013, A&A, 554, A13
- Kunth (1995) Kunth, D. 1995, Astrophysics, 38, 329
- Lelli et al. (2012) Lelli, F., Verheijen, M., Fraternali, F., & Sancisi, R. 2012, A&A, 537, A72
- Manthey & Oosterloo (2008) Manthey, E., & Oosterloo, T. 2008, The Evolution of Galaxies Through the Neutral Hydrogen Window, 1035, 156
- Martínez-Delgado et al. (2012) Martínez-Delgado, D., Romanowsky, A. J., Gabany, R. J. et al. 2012, ApJ, 784, L24
- Massey et al. (2007) Massey, P., Olsen, K. A. G., Hodge, P. W., et al. 2007, AJ, 133, 2393
- McMillan (2011) McMillan, P. J. 2011, MNRAS, 414, 2446
- Minkowski & Abell (1963) Minkowski, R. L., & Abell, G. O. 1963, Basic Astronomical Data: Stars and Stellar Systems, 481
- Nidever et al. (2008) Nidever, D. L., Majewski, S. R., & Burton, W. B. 2008, ApJ, 679, 432
- Nidever et al. (2010) Nidever, D. L., Majewski, S. R., Butler Burton, W., & Nigra, L. 2010, ApJ, 723, 1618
- Noeske et al. (2001) Noeske, K. G., Inglesias-Páramo, J., Vílchez, J. M., Papderos, P., & Fricke, K. J. 2001, A&A, 371, 806
- Pustilnik et al. (2001b) Pustilnik, S. A., Kniazev, A. Y., Lipovetsky, V. A., & Ugryumov, A. V. 2001b, A&A, 373, 24
- Rich et al. (2012) Rich, R. M., Collins, M. L. M., Black, C. M., et al. 2012, Nature, 482, 192
- Richer et al. (2001) Richer, M. G., Bullejos, A., Borissova, J., et al.2001, A&A, 370, 34
- Sancisi et al. (2008) Sancisi, R., Fraternali, F., Oosterloo, T., & van der Hulst, T. 2008, A&A Rev., 15, 189
- Sanna et al. (2008) Sanna, N., Bono, G., Stetson, P. B., et al. 2008, ApJ, 688, L69
- Sanna et al. (2010) Sanna, N., Bono, G., Stetson, P. B., et al. 2010, ApJ, 722, L244
- Schönrich et al. (2010) Schönrich, R., Binney, J., & Dehnen, W. 2010, MNRAS, 403, 1829
- Schulte-Ladbeck et al. (2001) Schulte-Ladbeck, R. E., Hopp, U., Greggio, L., Crone, M. M., & Drozdovsky, I. O. 2001, AJ, 121, 3007
- Shostak & Skillman (1989) Shostak, G. S., & Skillman, E. D. 1989, A&A, 214, 33
- Simpson et al. (2011) Simpson, C. E., Hunter, D. A., Nordgren, T. E., et al. 2011, AJ, 142, 82
- Skrutskie et al. (2006) Skrutskie, M. F., et al. 2006, AJ, 131, 1163
- Theis & Kohle (2001) Theis, C., & Kohle, S. 2001, A&A, 370, 365
- Toomre & Toomre (1972) Toomre, A. & Toomre, J. 1972, ApJ, 178, 623
- Tully (2013) Tully, R. B. 2013, Nature, 493, 31
- van der Marel & Guhathakurta (2008) van der Marel, R. P., & Guhathakurta, P. 2008, ApJ, 678, 187
- van der Marel et al. (2012) van der Marel, R. P., Fardal, M., Besla, G., et al. 2012, ApJ, 753, 8
- van Zee (2001) van Zee, L. 2001, AJ, 121, 2003
- Watkins et al. (2010) Watkins, L. L., Evans, N. W., & An, J. H. 2010, MNRAS, 406, 264
- Wilcots & Miller (1998) Wilcots, E. M., & Miller, B. W. 1998, AJ, 116, 2363
- Wright et al. (2010) Wright, E. L., Eisenhardt, P. R. M., Mainzer, A. K., et al. 2010, AJ, 140, 1868
- Zitrin et al. (2009) Zitrin, A., Brosch, N., & Bilenko, B. 2009, MNRAS, 399, 924
- Zwicky (1966) Zwicky, F. 1966, ApJ, 143, 192