The merging cluster of galaxies Abell 3376: an optical view. ††thanks: Based on observations taken with the CTIO Blanco and SOAR telescopes. This research has made use of the VizieR and NED data bases.
Abstract
Context. Abell 3376 is a merging cluster of galaxies at redshift . It is famous mostly for its giant radio arcs, and shows an elongated and highly substructured X-ray emission, but has not been analysed in detail at optical wavelengths.
Aims. In order to understand better the effects of the major cluster merger on the galaxy properties, we analyse the galaxy luminosity function (GLF) in the B band in several regions, as well as the dynamical properties of the substructures.
Methods. We have obtained wide field images of Abell 3376 in the B band and derive the GLF applying a statistical subtraction of the background in three regions: a circle of 0.29 deg radius (1.5 Mpc) encompassing the whole cluster, and two circles centered on each of the two brightest galaxies (BCG2, northeast, coinciding with the peak of X-ray emission, and BCG1, southwest) of radii 0.15 deg (0.775 Mpc). We also compute the GLF in the zone around BCG1, which is covered by the WINGS survey in the B and V bands, by selecting cluster members in the red sequence in a (B-V) versus V diagram. Finally, we discuss the dynamical characteristics of the cluster implied by a Serna & Gerbal analysis.
Results. The galaxy luminosity functions (GLFs) are not well fit by a single Schechter function, but satisfactory fits are obtained by summing a Gaussian and a Schechter function. The GLF computed by selecting galaxies in the red sequence in the region surrounding BCG1 can also be fit by a Gaussian plus a Schechter function. An excess of galaxies in the brightest bins is detected in the BCG1 and BCG2 regions. The dynamical analysis based on the Serna & Gerbal method shows the existence of a main structure of 82 galaxies which can be subdivided into two main substructures of 25 and 6 galaxies. A smaller structure of 6 galaxies is also detected.
Conclusions. The B band GLFs of Abell 3376 are clearly perturbed, as already found in other merging clusters. The dynamical properties are consistent with the existence of several substructures, in agreement with a previously published X-ray analysis.
Key Words.:
galaxies: clusters: individual: Abell 3376, Galaxies: luminosity function1 Introduction
The detailed analysis of clusters of galaxies at optical wavelengths allows to investigate their galaxy content and distribution, through the study of the galaxy luminosity function (GLF). Numerous papers have been published on galaxy luminosity functions in “normal” clusters of galaxies as well as in merging clusters. The pioneering works by Rood (1969), Peebles (1969), Rood & Abell (1973), Schechter (1976), or Dressler (1978), were later followed by many others at all wavelengths. More and more distant clusters were also analysed, reaching redshifts z=0.3 (Andreon 2001), z=0.64 (Massarotti et al. 2003), and z (Drory et al. 2003). GLFs are useful to characterize the relative distributions of bright and faint galaxies in various regions of clusters, and their shapes can be affected by merging events: the GLFs of several merging clusters have been found to show dips and wiggles, as well as an excess of bright galaxies (see e.g. Durret et al. 2011 and references therein). Besides, the faint end slopes of GLFs can be influenced by the infall of galaxies along filaments feeding clusters (e.g. Adami et al. 2009).
When a sufficient number of spectroscopic galaxy redshifts is available, it becomes possible to derive the dynamical properties and estimate the mass of the cluster, as well as to characterize substructures, if any. X-ray data, in particular temperature and metallicity maps of the X-ray gas are a natural complement to search for substructures. Coupled with numerical simulations, they can allow for a given cluster to draw a picture of the history of its formation (see e.g. Durret et al. 2011 and references therein).
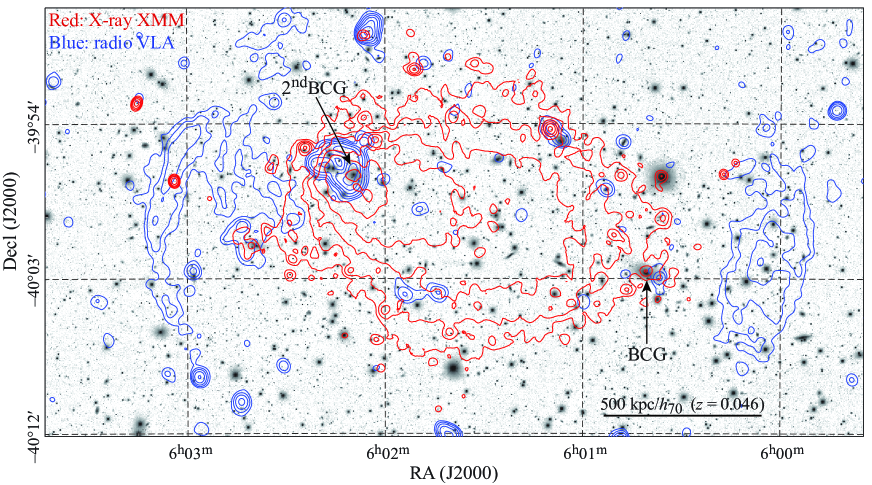
Abell 3376 is a merging cluster of galaxies at redshift z = 0.046 (distance modulus 36.40). Its most remarkable feature is the existence of giant ( Mpc) ring-shaped non-thermal radio emitting structures (“radio relics”) discovered by Bagchi et al. (2006, see their Fig. 1). A recent polarization and radio spectral study of these giant radio relics in Abell 3376 using the Giant Metrewave Radio Telescope (GMRT) and the Very Large Array (VLA) suggested that diffusive shock acceleration of particles in low Mach number (M) shocks produced in energetic cluster merger events are responsible for the synchrotron radio emission (Kale et al. 2012). The large distance ( kpc) between the position of the BCG (BCG1) and that of the X-ray peak is also remarkable and indicative of a major merger.
The fact that Abell 3376 is a merging structure is confirmed in X-rays. Its XMM-Newton image is strongly elongated along the northeast-southwest axis joining the two giant radio arcs, and the temperature and metallicity maps of the X-ray gas show strong inhomogeneities (see Bagchi et al. 2006, Fig. 2). Recent numerical simulations by Machado & Lima Neto (2013) based on the parallel SPH code Gadget-2 have been able to reproduce the X-ray emissivity map, and suggest an approximately head-on collision with a mass ratio of about 3:1, observed about 0.2 Gyr after the instant of central passage, and taking place very close to the plane of the sky. Still another proof for merging resides in the fact that the brightest cluster galaxy (hereafter BCG1) is far from the region with strong X-ray emission, as seen in Fig. 1: its coordinates are , while the brightest galaxy close to the X-ray peak (BCG2) is located at (J2000.0). Note that the direction joining the two BCGs roughly coincides with the direction joining the two giant radio arcs.
Among the few optical studies performed on Abell 3376, we can note that of Escalera et al. (1994) who detected the presence of several substructures in the galaxy distribution. Abell 3376 is part of the WINGS survey (Fasano et al. 2006, Varela et al. 2009), but the WINGS catalogue in the B and V bands is centered on BCG1 and does not cover the entire cluster (see Fig. 8). The existence of substructures was confirmed by Ramella et al. (2007). However, no detailed optical analysis of the entire cluster is available. We will derive here the B band GLF for the overall cluster, as well as for two circular regions centered on each of the BCGs (see Fig. 8).
We will also discuss the dynamical properties of Abell 3376 based on the redshifts and magnitudes available for cluster galaxies, to which we apply the Serna & Gerbal (1996) method. In this way we will see that it is possible to separate and characterize, both spatially and in redshift, several dynamically distinct substructures.
The paper is organized as follows: the observations and data reduction are described in Section 2, the GLFs computed in three regions are presented in Section 3, the dynamical analysis is discussed in Section 4 and a brief discussion of our results together with the main conclusions are given in Section 5.
2 Observations and data reduction
2.1 Optical data
We have obtained optical images in the B band with the CTIO 4m telescope and the MOSAIC2 camera (scale 0.266 arcsec/pixel) on the night of October 12–13, 2010. Four images (to allow dithering) were taken for each of two adjacent regions covering the east and west parts of the cluster (more or less coinciding with the two BCGs), with individual exposure times of 300 s.
Since the cluster was observed at the beginning and at the end of the night, the airmass variations were important from one frame to another, so the images were corrected individually for airmass after the usual bias and flat field corrections. They were then assembled into two images (the east and west images), using the SCAMP (Bertin 2006) and SWarp (Bertin et al. 2002) software packages. Since the seeing varied between the east (1.26 to 1.32 arcsec) and west (1.46 to 1.59 arcsec) images, the two images were analysed separately, and the corresponding catalogues were combined later. For the objects located in the small zone common to both images, we chose to use the measurements coming from the east image for which the seeing was better.
A large image was obtained to analyse the overall structure of the cluster at various wavelengths, as displayed in Fig. 1. This large image covers 1.16065 deg 0.5947 deg = 0.690238 deg2.
In order to obtain a photometric calibration of these images, since no standard stars had been taken during the night of the observation, we reobserved the central region of Abell 3376 the night of September 27–28, 2011 with the SOAR telescope and the SOI camera in the same band. This image was taken in photometric conditions with an exposure time of 600 s, and covered a region of 0.084125 deg 0.08075 deg = 0.0067931 deg2 (scale 0.15 arcsec/pixel) centered on BCG1. It was calibrated photometrically with Landolt standard stars. We then cross-identified objects present in the Blanco and SOAR images, and calibrated the Blanco image.
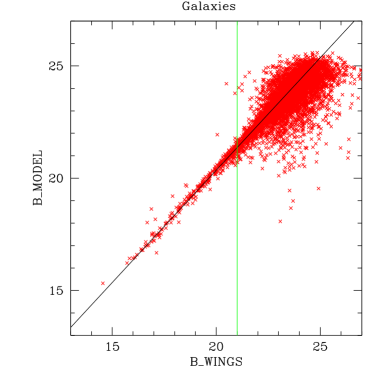
In order to test this calibration, we retrieved from VizieR111http://vizier.u-strasbg.fr/viz-bin/VizieR the catalogue from the WINGS survey in the B and V bands (Varela et al. 2009). Though the WINGS image does not encompass the full cluster, it covers a much larger area than our SOAR image, and should therefore provide a more reliable photometric calibration. We cross–identified our B band catalogue with the WINGS catalogue separately for objects classified as galaxies and as stars by WINGS. The shifts found between our magnitudes and the B magnitudes of WINGS, for B (to avoid faint objects that have larger magnitude errors) were: B-BWINGS = 0.50 (dispersion 0.07) for stars and B-BWINGS = 0.36 (dispersion 0.20) for galaxies. Though the quality of the calibration based on stars is expected to be better, if we apply this shift to our B magnitudes the histograms of the (B-V) for galaxies values appear quite different for our B magnitudes and for the WINGS B magnitudes. On the other hand, these histograms are fully consistent if we apply B-BWINGS = 0.36 (see Fig. 6). So in the following we will apply this correction (illustrated in Fig. 2) to our B band magnitudes.
We now concentrate only on the galaxies of the deep large B band Blanco image.
2.2 SExtractor analysis and star–galaxy separation
All sources in the eastern and western images were extracted independently using the SExtractor software (Bertin & Arnouts 1996), and the resulting catalogues merged to remove duplicates. Before extraction, models of the Point Spread Function (PSF) for both images were derived with the PSFEx tool (Bertin 2011) from non-saturated point sources with a signal-to-noise ratio (as measured by SExtractor’s SNR_WIN parameter) higher than 20. Spatial variations of the PSF were modelled as a third degree polynomial of the pixel coordinates. We set the reference aperture for normalising the PSF at 20 pixels (5.3 arcsec).
SExtractor was run in single-image mode, using the experimental two-dimensional galaxy model-fitting feature (Bertin 2011). The fitted model is the sum of a de Vaucouleurs “bulge” and an exponential “disk” components, centred on the same position, and convolved with the local PSF model. Our photometric measurements are based on SExtractor’s MAG_MODEL “asymptotic” model magnitudes, which correspond to the integral of the best-fitting bulge+disk model extrapolated to infinite radius.
The catalogues obtained for the east and west images were then merged, giving a catalogue of 45538 objects, after objects in common (1725) were eliminated.
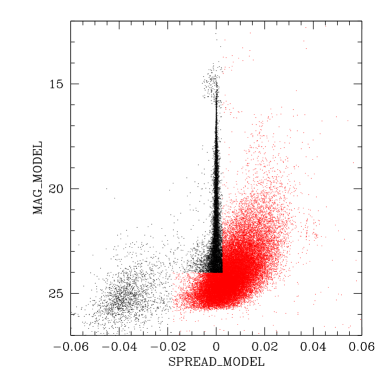
Star-galaxy separation was performed based on SExtractor’s SPREAD_MODEL estimator (e.g., Desai et al. 2012, Bouy et al. 2013). Fig. 3 shows the distribution of detections from both eastern and western fields in a MAG_MODEL vs SPREAD_MODEL diagram; the point-source locus centred around SPREAD_MODEL and the clump from faint residual cosmic rays at SPREAD_MODEL are well visible. Based on a visual inspection of the diagram, we classified as galaxies all detections with SPREAD_MODEL and fainter than B=24, or with SPREAD_MODEL.
In all fields, we have checked by eye all the objects brighter than B, and eliminated a few bright stars () wrongly classified as galaxies.
We checked that the star counts as a function of magnitude agreed with those of the Besançon model for the Galaxy (Robin et al. 2003), thus confirming the validity of our star-galaxy classification.
Since BCG1 was saturated in our image, we took for this galaxy the B magnitude given by the WINGS catalogue: B=14.55. For BCG2, which was also saturated on our image, we took a somewhat arbitrary magnitude B=15.00. The choice of this value was motivated by the fact that on the image BCG2 is smaller than BCG1, suggesting it is fainter than BCG1, and BCG2 cannot be much fainter than 15 because otherwise it wouldn’t saturate.
We ended up with a catalogue of 34660 galaxies, on which our analysis will be based. This catalogue will be made available electronically in VizieR.
2.3 Completeness
In order to check down to which magnitude we could reasonably compute and fit the GLF, we performed simple simulations to estimate the completeness of our galaxy catalogue as a function of magnitude. Our method is to add “artificial stars” (i.e. 2D Gaussian profiles with the same full-width-at-half-maximum as the average image point spread function) of different magnitudes to the CCD images and attempt to recover them by running SExtractor again with the same parameters for object detection and classification as on the original images. In this way, the completeness was measured on the original images.
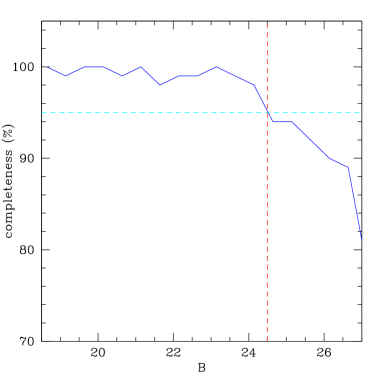
These simulations give a completeness percentage for stars of about 95% for B (see Fig. 4). This is obviously an upper limit for the completeness level for galaxies, because stars are easier to detect than galaxies. However, we have shown that this method yields a good estimate of the completeness for normal galaxies if we apply a shift of mag (see e.g. Adami et al. 2006). We will hereafter consider that our galaxy catalogue in the B band is 95% complete for B. For galaxies belonging to Abell 3376 this corresponds to an absolute magnitude of .
2.4 Magnitude distribution and cross–check
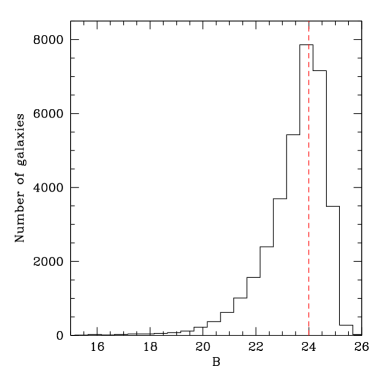
The galaxy B band magnitude histogram obtained for the full image is shown in Fig. 5. The decrease in galaxy counts for B indicates that the completeness limit of 95% at B=24. estimated in the previous section could even be a little optimistic, so we will not push our analysis at magnitudes fainter than B=23.5 (absolute magnitude at the cluster redshift).
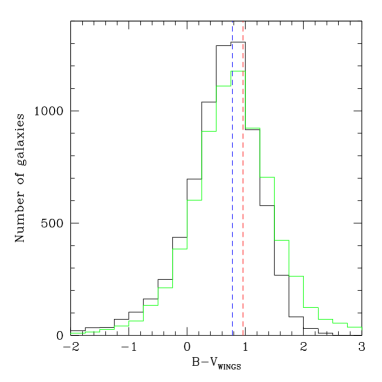
In order to test the quality of our photometric calibration (also see Section 2.1), we computed the histogram of the (B-VWINGS) colours, both for our B band data and for the WINGS B band data. The result is displayed in Fig. 6 and shows that both histograms agree, and that the colour histograms are consistent with those of normal Elliptical and Sab galaxies (respectively 0.96 and 0.78 at z=0, taken from Fukugita et al. 1995).
2.5 Galaxy redshifts

We retrieved all the galaxy redshifts available in NED222http://ned.ipac.caltech.edu/ corresponding to our image (in majority coming from Cava et al. 2009). We found 213 redshifts, out of which 120 are in the interval [0.039,0.055] that can in first approximation be considered as corresponding to the cluster. The redshift histogram is displayed in Fig. 7. The mean redshift is 0.04608, corresponding to a mean velocity cz=13824 km/s, and to a velocity dispersion of 848 km/s. The corresponding biweight quantities are 0.04604 for the mean redshift, cz=13813 km/s for the mean velocity, and 862 km/s for the velocity dispersion. The rather high value of the velocity dispersion is expected, since the cluster is in a merging stage, and agrees with the fact that several dynamical components are present (see Section 4). Our values agree with those obtained by Cava et al. (2009): z=0.0461 and km/s.
3 The galaxy luminosity function (GLF) in the B band
3.1 Definition of three spatial regions
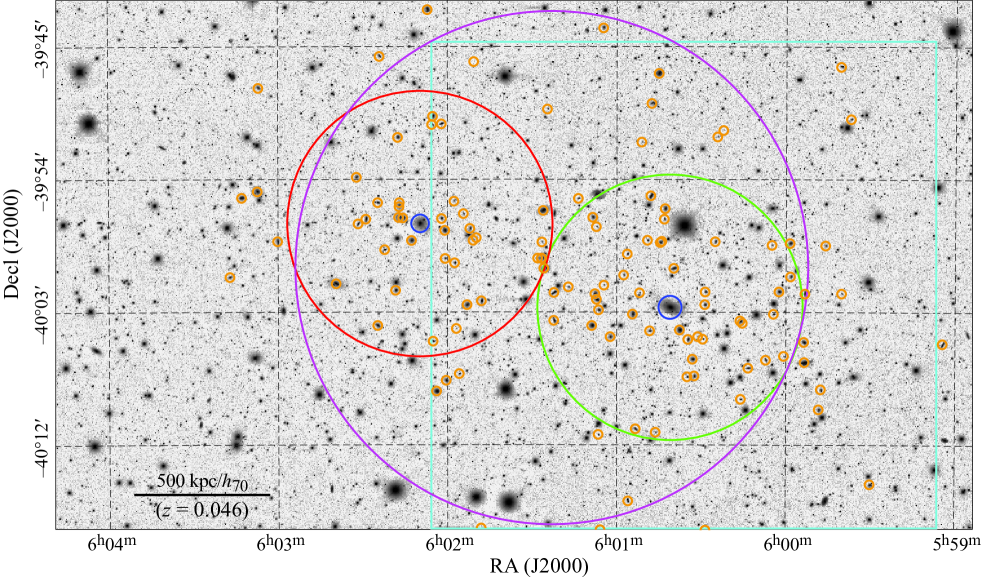
Abell 3376 is characterised by a very large distance between the position of the brightest cluster galaxy (hereafter BCG1) and that of the second brightest galaxy (BCG2) located in the area of the X-ray peak. This is illustrated in Fig. 1. We therefore divided the overall image in three zones to analyse the GLF: a circle of 0.29 deg radius (1.5 Mpc) encompassing the whole cluster, centered on the position: 90.346 deg, deg (the “whole cluster”, coded in magenta in several figures, with 9887 galaxies), and two circles of radii 0.15 deg (0.775 Mpc) centered on each of the two brightest galaxies: BCG1 at 90.17125 deg, deg (coded in green, 1969 galaxies) and BCG2 at 90.54041 deg, deg (coded in red, 3567 galaxies). The positions of these circles, together with those of the two BCGs are shown in Fig. 8.
We first derive galaxy luminosity functions in the three regions described above, obtained by applying a statistical subtraction of the background. For the BCG1 region, which is the only one to be fully covered by the WINGS survey, we will also derive the GLF by selecting cluster members from the red sequence in a (B-V) versus V diagram.
We estimated the numbers of objects that we could be missing due to the presence of bright stars or to the haloes of the BCGs. We find that the surfaces covered by bright stars correspond to 3% to 5% of the total area in the BCG1 region and about 2% in the BCG2 region.
The objects in the halos of the BCGs should normally be detected and deblended from the BCG by SExtractor. We checked by eye the areas around the BCGs for galaxies undeblended by SExtractor. All the galaxies visible on the image located more than 1 arcmin from the BCGs are in our catalogue. Within circles of 1 arcmin radii from the BCGs, we found that the fraction of lost sources was about 25%-30%. The ratio of the surface covered by a 1 arcmin radius circle to the total surface covered by the BCG1 and BCG2 regions (radius 0.15 deg) is 1.2%, so a loss of 30% of the galaxies in a zone covering only 1.2% of the total area of these zones can be considered as negligible.
Since the corrections for incompleteness due to non-detections in the haloes of bright stars or of the BCGs are small and probably not very accurate, we decided not to apply them to our galaxy counts and GLF computations.
3.2 The B band galaxy luminosity functions in three regions (statistical background subtraction)
In order to compute the B band galaxy luminosity functions, we counted all the galaxies in magnitude bins of 0.50 mag and subtracted statistically the contribution of background galaxies, using the field galaxy counts per square degree estimated by McCracken et al. (2003) in the B filter. Since these authors give field galaxy counts for , for galaxies brighter than B=18 we only took into account galaxies with a spectroscopic redshift in the cluster. This approach is justified by the fact that the completeness of the spectroscopic data is high: the ratios of the numbers of galaxies brighter than B=18 with measured redshifts to the total numbers of galaxies brighter than B=18 are 78% (42/54), 87% (13/15) and 87% (20/23) in the overall cluster, BCG1, and BCG2 regions respectively. In view of the relatively small numbers of galaxies, we did not apply a completeness correction to the bright end of the GLF (since these numbers would have further been distributed in various magnitude bins) to avoid adding noise to the data. We can note that the excesses observed in somes GLFs at very bright magnitudes are thus lower limits.
Since the McCracken counts are given in AB magnitudes, we had to convert our magnitudes to the AB system, applying: . We also applied to our galaxy catalogue an extinction correction of 0.186 mag, as given by NED from Schlafly & Finkbeiner (2011), and normalized all surfaces to 1 deg2. In view of the small redshift of the cluster, we did not apply a Kcorrection.
| Region | Range () | ||||||
|---|---|---|---|---|---|---|---|
| Whole cluster (SS) | [] | ||||||
| BCG1 (SS) | [] | ||||||
| BCG1 (RS) | [] | ||||||
| BCG2 (SS) | [] |
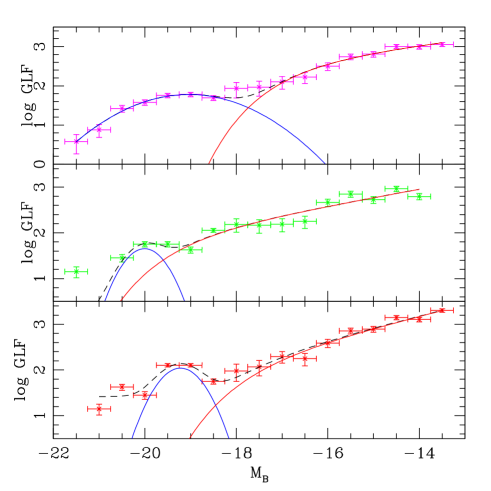
The resulting galaxy luminosity functions were computed as a function of absolute magnitude, assuming a distance modulus of 36.40, in order to make the comparison possible with other clusters. They are shown in Fig. 9. The GLF of the entire cluster (in magenta) is rather smooth, but shows an excess at . The GLF in the region of BCG1 (in green) is quite irregular, with several dips and wiggles and an excess in the brightest bin (). The GLF in the region of BCG2 (in red), which coincides with the X-ray peak, is also somewhat irregular at bright magnitudes (i.e. for ), with an excess at in the two brightest bins.
The fits of all three GLFs by a simple Schechter function are not good (i.e. the fit obtained with the MIGRAD minimization of the MINUIT software does not converge). We therefore fit them with the sum of a Gaussian and a Schechter functions, keeping in mind the fact that a fit including 7 free parameters (the 7th free parameter being a constant, found to be zero in the overall and BCG1 regions, but non-zero in the BCG2 region) and less than 20 data points could be somewhat ad hoc.
For the Gaussian function, we took:
where is the central magnitude, is the full width at half maximum and is the amplitude for .
For the Schechter function, we used:
with .
3.3 The B band galaxy luminosity function in region BCG1 (red sequence galaxy selection)
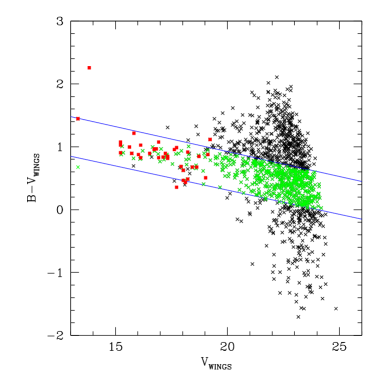
Since the WINGS catalogue in the V band covers completely the BCG1 region, we also derived the GLF in this zone by selecting cluster galaxies from the red sequence in the (B-V) versus V colour-magnitude diagram, as shown in Fig. 10. One can see that the red sequence is well defined (in particular by spectroscopically confirmed cluster members). For V the best fit to the red sequence is:
We select as cluster members all the galaxies within on either side of this relation, to which we add the five spectroscopically confirmed cluster members that lie outside this zone, and BCG1. We exclude the eight galaxies falling in the red sequence interval but with spectroscopic redshifts outside the cluster.
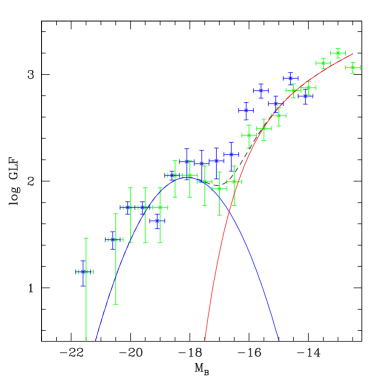
The GLF obtained by this selection is displayed in Fig. 11. Here also, a single Schechter function cannot fit the data, but a good fit is obtained by summing a Gaussian and a Schechter function (see parameters in Table 1). We can note again an excess of galaxies in the brightest bin in this region.
We can see in Fig. 11 that the GLFs obtained with both methods for the BCG1 region agree within error bars in almost all magnitude bins. The fact that the GLF points in the individual bins tend to be higher in the statistical subtraction case than in the red sequence selection could be due to the fact that the gaps between the CCDs in the WINGS data reduce by a small amount the number of galaxies measured in the V band, and therefore the number of galaxies cross-identified with our B band catalogue.
Although the GLFs obtained with the two methods roughly agree, we can see in Table 1 that the parameters of the best fits obtained with both methods (see Table 1) are quite different for the bright component (the Gaussian), while the faint end slopes do not strongly differ. It is rather surprising that the GLF fits for two sets of data that seem consistent within error bars can be so different. To our opinion, this illustrates the difficulty of obtaining robust luminosity functions and to fit them in a reliable way, and this should be a warning not to overinterpret data.
Assuming that all the galaxies selected in the red sequence belong to the cluster is certainly an overestimate, although the fact that the GLF derived from the red sequence agrees with the one computed by statistical background subtraction tends to indicate that the contamination is probably not too large.
We can estimate this contamination by considering the Coma cluster, which has extensively been covered spectroscopically by the Sloan Digital Sky Survey, which is complete to . By applying the colour correction from Fukugita et al. (1995) for a typical elliptical galaxy at the redshift of Abell 3376, this corresponds to . If we count the numbers of galaxies outside the Coma cluster (i.e. with redshifts or ) falling within an interval of from the red sequence, we find a contamination of 9%. Therefore for Abell 3376 the contamination of the red sequence that we considered by field galaxies is about 9% for . For fainter magnitudes (), even our Coma cluster spectroscopic catalogue is not sufficiently complete to estimate the contamination by background galaxies in the same way, but the fact that the values of the GLFs (and of the faint end slopes) estimated for the BCG1 region with the two methods (statistical subtraction of the background or red sequence galaxy selection) do not strongly differ suggests that this contamination is not very strong yet for .
These results will be discussed in more detail in Section 5.
3.4 The bright to faint galaxy density ratio
We quantified the distributions of galaxies as a function of magnitude in a more global way, by estimating the densities of bright and faint galaxies and the bright to faint galaxy density ratios, in the three regions of interest.
For this, we computed the numbers of bright (absolute magnitude ) and faint () galaxies in the three regions analysed, and the ratios of these numbers, in the three regions. We find a bright to faint number ratio of 0.20 in the whole cluster and 0.15 in the BCG2 region. In the BCG1 region, the bright to faint number ratio is 0.29, that is notably higher than in the other regions. There are two possibilities: either the BCG1 region has a higher density of bright galaxies, or the BCG2 region has a higher density of faint galaxies. This will be discussed in Section 5.
4 Dynamical analysis
In order to identify the substructures present in the galaxy distribution of Abell 3376 and to estimate their relative masses, we applied the Serna & Gerbal (1996) method (hereafter SG). Very briefly, this method calculates the potential binding energy between pairs of galaxies and detects substructures taking into account positions and redshifts. Here, we required a minimum number of 5 galaxies for a substructure to be present. Assuming a value of 100 (in solar units) for the total mass to stellar luminosity ratio (but results do not strongly depend on this quantity, see e.g. Adami et al. 2005), galaxy magnitudes can be transformed into masses, and approximate values can be estimated for the total (i.e. dynamical) mass of each substructure. Although the absolute values of these masses are not fully reliable, mass ratios can be considered as robust, with a typical uncertainty of the order of 25. Note however that we neglect here the uncertainty on the M/L ratio assumed for the galaxies. More details, as well as a discussion of the influence of incomplete spectroscopic sampling, can be found in Guennou et al. (2013, A&A submitted).
We applied this method to the catalogue of galaxies with spectroscopic redshifts and with B band magnitudes in our catalogue, including the two BCGs (the uncertainty on their exact magnitudes should not have a strong influence on the results).
| Structure | Ngal | velocity | velocity | mass/ |
|---|---|---|---|---|
| (km/s) | dispersion | mass (overall) | ||
| (km/s) | ||||
| Overall | 122 | 13595 | 1045 | 1.00 |
| S1 | 82 | 13800 | 575 | 0.30 |
| S1a | 25 | 13823 | 367 | 0.11 |
| S1b | 6 | 14731 | 188 | 0.004 |
| S2 | 6 | 12669 | 110 | 0.002 |
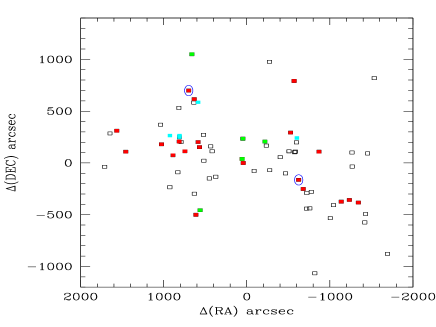
For each structure detected by the SG method, we give in Table 2 the following parameters: number of galaxies, average velocity, velocity dispersion, and mass relative to that of the overall cluster. The galaxy distributions are shown in Fig. 12. The overall cluster is detected as a structure of 122 galaxies with an approximate mass of M⊙. Note however that this structure should only include the 120 cluster members discussed in Section 2.5, so the velocity dispersion of this “Overall structure” is obviously overestimated (1045 km/s instead of 862 km/s) and this is therefore also most probably the case for its mass. In any case, the mass of the “Overall structure” is of the same order as the virial mass of M⊙ estimated by Escalera et al. (1994). The main substructure, hereafter S1, includes 82 galaxies (34 members, among which BCG1, and 48 probable members, among which BCG2). A much smaller substructure (S2) of 6 galaxies is detected with an average velocity smaller than that of the overall cluster by 920 km/s.
Structure S1 can be subdivided into two substructures, S1a and S1b, with 25 and 6 galaxies respectively. It is difficult to assign a particular substructure to each of the BCGs, since all the structures detected seem to cover a rather large area in projection on the sky. This is in agreement with the fact that the merging takes place in the plane of the sky, and in this case the SG method is somewhat less efficient to discriminate subgroups. Nevertheless, we can see that S1a is much more massive than the other substructures, as expected since it corresponds to the direction of the merger and to the region where most of the brightest galaxies are concentrated.
Based on a wavelet analysis, Escalera et al. (1994) classified Abell 3376 as “unimodal with structures in the core”. Their wavelet map shows a clear elongation in the approximate direction of the merger. Such a unimodal classification appears rather surprising at first sight, since there are two BCGs in the cluster. However, it agrees with our finding that BCG1 and BCG2 are both part of S1a. It is difficult to compare quantitatively our results to those of Escalera et al. (1994), since they had fewer redshifts and did not give the precise positions of their substructures, but there does not seem to be any obvious discrepancy between their analysis and ours.
Ramella et al. (2007) searched for substructures in the area covered by the WINGS data and detected a main structure around BCG1 (the black dots in their figure 6) and a substructure to the northeast (the green dots in their figure 6) which could coincide with our structure S1b. However, since their image does not encompass the whole cluster, it is difficult to make a more detailed comparison between our results and theirs.
5 Discussion and conclusions
Abell 3376 is a cluster undergoing a major merger and characterized by a strongly elongated X-ray emission, peaked on the second brightest galaxy BCG2, while the brightest galaxy BCG1 is located about 0.3 deg (1.55 Mpc) south west of BCG2.
We have analysed a large image of this cluster in the B band, reaching a completeness level of 95% for B24. We computed the B band galaxy luminosity functions (GLF) based on statistical background subtraction in three regions: one encompassing all the cluster (the “whole cluster”), one centered on BCG1 and the other on BCG2. The three GLFs present excesses, dips and wiggles, and cannot be fit by a single Schechter function. On the other hand, they can all be satisfactorily fit with the sum of a Gaussian and a Schechter functions. The overall cluster shows a small excess of galaxies at . This may be due to the fact that we consider spectroscopic data for galaxies brighter than B=18 () and statistical background subtraction for fainter objects, and the connection between the points obtained with these two methods may not be perfect.
The GLF of region BCG1 is quite irregular and shows an excess in the brightest magnitude bin . The GLF of region BCG2 also shows some irregularities, and an excess in the two brightest bins for . Although we would expect the region of BCG1 to dominate the overall cluster, we can see in Table 1 that the best fit parameters obtained for the GLFs of the overall cluster and of the BCG1 region are quite different, except for the faint end slopes. The GLF best fit parameters of region BCG2 also differ from those of the other regions, and the faint end slope is notably steeper than in the two other zones.
For the region around BCG1, we also computed the GLF obtained by selecting galaxies along the red sequence in a (B-V) versus V diagram (with V magnitudes taken from the WINGS catalogue), taking into account the spectroscopic redshift information available. The GLF thus obtained is consistent within error bars with that obtained by statistical background subtraction, except in a few magnitude bins fainter than . However, the best fit parameters of the GLFs obtained by both methods differ quite strongly, except for the faint end slopes (which are not fully consistent though, but we have noticed before that the error bars computed by MINUIT were in some cases underestimated). This illustrates the difficulty of deriving unambiguous fits for GLFs: the error bars on each bin are large, and changing the galaxy counts by a small amount can modify the fit parameters obtained. Obviously, a good photometric calibration is crucial and a check with numerous spectroscopic redshifts, going as deep as possible in magnitude, is mandatory to ascertain the quality of the GLFs thus obtained (the results obtained on Coma with very deep spectroscopy by Adami et al. 2009 illustrate well this point). This result should be kept in mind in further studies.
As already noted e.g. in the case of Abell 1758 North, which is clearly the result of a merger (Durret et al. 2011 and references therein), the dips and wiggles of the GLF seem to be a characteristic of merging clusters. The GLF of Abell 1758 North could be fit with a single Schechter function, so the comparison of the bright ends of the GLFs in Abell 3376 with this cluster are probably irrelevant. However, we can compare the faint end slopes (the parameter). The faint end slopes estimated for all the regions of Abell 3376 are steeper than that of Abell 1758 North ( in the band, at a redshift of 0.279). An explanation could be that the mergers in these two clusters do not have the same age and that the faint end slope varies with time. Another possibility is that the faint end slope varies with redshift, and is flatter at larger redshift. This is suggested by the flat slopes determined by Rudnick et al. (2009) for clusters at redshifts . We are in the process of analysing galaxy luminosity functions in a sample of clusters at from the DAFT/FADA survey in all stages of merging, from relaxed to strongly substructured (Martinet et al. in preparation). This should shed light on the influence of mergers on the galaxy distributions in clusters.
The difference in the bright to faint number ratio in the BCG1 and BCG2 regions can be interpreted as either due to a higher density of bright galaxies in the BCG1 region, or to a higher density of faint galaxies in the BCG2 region.
BCG1 is usually considered as the center of the main cluster because it is the brightest galaxy and has a cD like morphology. A higher density of bright galaxies in the BCG1 region agrees (at least qualitatively) with the scenario simulated by Machado & Lima Neto (2013), where the subcluster around BCG2 has crossed the main cluster about 0.2 Gyr ago, and the cluster mass ratio is about 3:1. In this case more bright galaxies are expected around BCG1 than around BCG2.
On the other hand, the BCG2 region could have a much higher density of faint galaxies, and could even be more massive than the BCG1 region. There are several arguments in favor of this hypothesis. First, the number of galaxies in the BCG2 region (3567) is almost twice the number of galaxies in the BCG1 region (1969). Second, the number of bright galaxies (B) is also larger in BCG2 (23) than in BCG1 (15). Third, the faint end slope is notably steeper in region BCG2 than in BCG1 (see Table 1). And finally, the fact that the peak of X-ray emission is located in BCG2 could indicate the presence of a deeper potential well in the BCG2 region. The only disturbing point with this scenario is that BCG2 appears at the edge of the distribution of the various structures determined by the Serna & Gerbal method (see Fig. 12).
We have been granted one night observing time on Blanco with DECam in January of 2014, to obtain very deep images of Abell 3376 to perform a weak lensing mass reconstruction of this cluster. This should allow to choose between these two scenarios.
The dynamical analysis of Abell 3376 based on the Serna & Gerbal (1996) method shows that the cluster (122 galaxies) contains a main structure (82 galaxies) which can be subdivided into two substructures S1a and S1b, of 25 and 6 galaxies respectively, the first one containing BCG1 and BCG2. A smaller substructure of 6 galaxies is also detected with an average velocity smaller than that of the overall cluster by 920 km/s. S1a is much more massive than the other substructures, as expected since it corresponds to the direction of the merger and to the region where most of the brightest galaxies are concentrated. Our results agree qualitatively with those of Escalera et al. (1994) and Ramella et al. (2007) but a quantitative comparison is not possible.
Abell 3376 has been studied at radio and X-ray wavelengths (Bagchi et al. 2006), and accounted for by recent numerical simulations (Machado & Lima Neto 2013), but it remains poorly known in the optical, though it was part of the WINGS survey (Fasano et al. 2006, Varela et al. 2009). We hope to have shed some light on its optical properties in the present paper, and plan to obtain deeper images in the future to improve our understanding of this cluster where violent merging events are taking place, in particular by analysing its mass distribution through weak lensing techniques.
Acknowledgements.
We warmly thank the anonymous referee for many constructive comments that helped us to improve the paper. We acknowledge long term financial support from CNES as well as CAPES/COFECUB program 711/11. We are grateful to the DAFT/FADA team for the SOAR observations of this cluster.References
- (1) Adami C., Biviano A., Durret F., Mazure A. 2005, A&A 443, 17
- (2) Adami C., Picat J.P., Savine C. et al. 2006, A&A 451, 1159
- (3) Adami C., Le Brun V., Biviano A. et al. 2009, A&A 507, 1225
- (4) Andreon S. 2001, ApJ 547, 623
- (5) Bagchi J., Durret F., Lima Neto G.B., Paul S. 2006, Science 314, 791
- (6) Bertin E., Arnouts S., 1996, A&AS 317, 393
- (7) Bertin E., Mellier Y., Radovich M. et al. 2002, in Astronomical Data Analysis Software and Systems XI, Bohlender D. A., Durand D., Handley T. H. eds., Astronomical Society of the Pacific Conference Series 281, 228
- (8) Bertin E., 2006, in Astronomical Data Analysis Software and Systems XV, Gabriel C., Arviset C., Ponz D., Solano E. eds., Astronomical Society of the Pacific Conference Series 351, 112
- (9) Bertin E., 2011, in Astronomical Data Analysis Software and Systems XX, Evans I. N., Accomazzi A., Mink D. J., Rots A. H. eds., Astronomical Society of the Pacific Conference Series 442, 435
- (10) Bouy H., Bertin E., Moraux E. et al., 2013, A&A 554, 101
- (11) Cava A., Bettoni D., Poggianti B. M. et al. 2009, A&A 495, 707
- (12) Desai S., Armstrong R., Mohr J. J. et al. 2012, ApJ 757, 83
- (13) Dressler A. 1978, ApJ 223, 765
- (14) Drory N., Bender R., Feulner G. et al. 2003, ApJ 595, 698
- (15) Durret F., Forman W., Gerbal D., Jones C., Vikhlinin A. 1998, A&A 335, 41
- (16) Durret F., Laganá T., Haider M. 2011, A&A 529, 38
- (17) Escalera E., Biviano A., Girardi M. et al. 1994, ApJ 423, 539
- (18) Fasano G., Marmo C., Varela J. et al. 2006, A&A 445, 805
- (19) Fukugita M., Shimasaku, K., Ichikawa T. 1995, PASP 107, 945
- (20) Kale R., Dwarakanath K.S., Bagchi J., Paul S. 2012, MNRAS 426, 1204
- (21) Machado R.E.G. & Lima Neto G.B. 2013, MNRAS 430, 3249
- (22) Massarotti M., Busarello G., La Barbera F., Merluzzi P. 2003, A&A 404, 75
- (23) McCracken H.J., Radovich M., Bertin E. et al. 2003, A&A 410, 17
- (24) Peebles P.J.E. 1969, Nature 224, 1093
- (25) Ramella M., Biviano A., Pisani A. et al. 2007, A&A 470, 39
- (26) Robin A.C., Reylé C., Derrière D., Picaud S. 2003, A&A 409, 523
- (27) Rood H.J. 1969, ApJ 158, 657
- (28) Rood H.J. & Abell G.O. 1973, ApL 13, 69
- (29) Rudnick G., Von der Linden A., Pelló R. et al. 2009, ApJ 700, 1559
- (30) Schechter P. 1976, ApJ 203, 297
- (31) Schlafly E.F. & Finkbeiner D.P. 2011, ApJ 737, 103
- (32) Serna A. & Gerbal D. 1996, A&A 309, 65
- (33) Varela J., D’Onofrio M., Marmo C. et al. 2009, A&A 497, 667
Appendix A Description of the electronic table
| Number | RA (J2000.0) | DEC (J2000.0) | B_AUTO | error | B_MODEL | error | SPREAD_MODEL | error |
|---|---|---|---|---|---|---|---|---|
| (B_AUTO) | (B_MODEL) | (SPREAD_MODEL) | ||||||
| 1 | 89.6201787 | -39.7236609 | 24.528 | 0.179 | 22.800 | 0.165 | 0.026 | 0.006 |
| 2 | 89.6202716 | -39.7070639 | 18.762 | 0.004 | 20.599 | 1.146 | 1.000 | 1.000 |
| 3 | 89.6203079 | -39.7500203 | 23.658 | 0.135 | 22.873 | 1.449 | 0.011 | 0.005 |
| 4 | 89.6203211 | -39.7573528 | 23.488 | 0.120 | 22.062 | 0.202 | 0.018 | 0.006 |
| 5 | 89.6203219 | -39.7469425 | 24.651 | 0.209 | 22.756 | 1.803 | 0.019 | 0.006 |
| 6 | 89.6203259 | -39.7201251 | 24.221 | 0.143 | 23.177 | 4.936 | 0.019 | 0.009 |
| 7 | 89.6203409 | -39.6848968 | 23.329 | 0.128 | 23.014 | 0.228 | 0.020 | 0.005 |
| 8 | 89.6203633 | -39.7595031 | 23.729 | 0.122 | 23.075 | 0.256 | 0.008 | 0.006 |
| 9 | 89.6203726 | -39.7550236 | 23.284 | 0.109 | 22.882 | 2.372 | 0.019 | 0.004 |
| 10 | 89.6203876 | -39.7388027 | 23.399 | 0.111 | 23.056 | 0.319 | 0.007 | 0.005 |
The galaxy catalogue will be available in electronic form in VizieR333http://vizier.u-strasbg.fr/viz-bin/VizieR. It is ordered in right ascension, magnitudes are in the Vega system and no extinction correction is applied.
The table columns are: sequential number, right ascension in decimal degrees (J2000), declination in decimal degrees (J2000), B band MAG_AUTO, B band error on MAG_AUTO, B band MAG_MODEL , B band error on MAG_MODEL, SPREAD_MODEL, error on SPREAD_MODEL. All these values were computed with SExtractor (see Section 2.2).
The galaxy catalogue was cut to B_MODEL, but obviously objects fainter than B_MODEL=24 or 24.5 should be considered with caution. All objects brighter than B_MODEL were checked by eye in order to elliminate bright stars that had been misclassified as galaxies (a few tens). The final catalogue includes 28828 objects. Note that the photometric calibration was done as described in Section 2.1., applying the zero point shift of 0.36 determined from comparison with the WINGS B band catalogue for galaxies. As described in Section 2.3 it is 95% complete for B. The first ten lines of the catalogue are displayed in Table A.1.