Disappearance of a narrow Mg II absorption system with a measured velocity up to
Abstract
Quasar J152645.61+193006.7 () was observed by the Sloan Digital Sky Survey (SDSS) on 2006 May 31, and again on 2011 April 9. The time interval of the SDSS two observations is 497.4 days at the quasar rest frame. From the spectra of this quasar, we detect a phenomenon of disappearance of a narrow absorption system with a velocity up to with respect to the quasar. This disappearance event can be caused by changes in the ionization state of absorbing gas or by the bulk motion of the absorbing gas across the quasar sightline. The coverage fraction analysis shows that this absorber partially covers the background emission sources with an effective coverage fraction of . The time variation analysis and the coverage fraction analysis imply that this absorber might be intrinsic to the quasar. However, the scenario of a cosmologically separated foreground object located at accounting for the phenomenon cannot be ruled out according to current available data.
Subject headings:
galaxies: active — quasars: absorption lines — quasars: individual (J152645.61+193006.7)1. Introduction
The outflow of quasar is often believed to be the gas blown away from the accretion disk. Later, the gas can be accelerated by the radiation pressure (Castor et al. 1975; Proga et al. 1998; Dorodnitsyn& Novikov 2005; Proga & Kurosawa 2009, and references therein), the magnetic force (Contopoulos & Lovelace 1994; Li 1996; Kudoh & Shibata 1997a,b; Lery et al. 1998,1999; Proga 2007, and references therein) and the thermal driving (Begelman et al. 1983; Kallman 2005; Proga 2007; Owen et al. 2012, and references therein). If the gas is heated to a high temperature reaching up to the Compton temperature, the thermal driving would be effective enough to produce a thermal wind (e.g., Proga & Kallman 2002; Chelouche & Netzer 2005). The thermal driving might be less important if the temperature of gas is well bellow the Compton temperature (Proga 2007).
The outflow was detected most conspicuously via blueshifted absorption lines. These lines can be split into three categories based on line widths: broad absorption lines (BALs), with the typical line widths being broader than at depths below the continuum (Weymann et al. 1991); narrow absorption lines (NALs), with absorption troughs being narrower than a few hundred ; and intermediate mini-broad absorption lines (mini-BALs), with line widths lying between those of BALs and NALs. They can appear at a very wide range of speeds from to in multiband spectra (e.g., X-ray, UV and optical spectra) (e.g., Misawa et al. 2007; Ganguly & Brotherton 2008; Tombesi et al. 2010, 2011). Absorption lines of highly ionized elements (e.g., ) have been observed only in high energy band spectra (e.g., X-ray spectra). Nevertheless, transitions by the , , , and can be seen in UV but not in X-ray spectra (e.g., Kaspi et al. 2002; Krongold et al. 2003).
Blueshifted absorption lines are very common in quasar spectra. However, only a small number of them are intrinsic to quasars. Most of them are intervening absorption lines, which are believed to be physically associated with the cosmologically intervening foreground galaxies lying on quasar sightlines (Bergeron 1986). BALs are undoubtedly intrinsic to the quasar (Murray et al. 1995; Elvits 2000). Both intrinsic and intervening NALs usually show similar line widths and line strengths, thereby it is difficult to determine which NALs are truly intrinsic to the quasars (Qin et al. 2013). One can separate intrinsic NALs from intervening NALs via several criteria: time variation, partial coverage, line profile, high ionization state, and so on (e.g., Barlow & Sargent 1997; Hamann et al. 1997, 2011; Misawa et al. 2005; Chen et al. 2013a). Among these methods, the time variation analysis and the coverage fraction analysis are the most effective and most frequently utilized ones (Ganguly et al. 1999; Misawa et al. 2003; Wise et al. 2004; Hamann et al. 2011).
Variations of intrinsic absorption lines seem to be common, but extreme cases such as the disappearance and emergence of absorption lines from the spectra are rare. So far, only a small number of disappearance (e.g., Hall et al. 2011; Filiz Ak et al. 2012; Capellupo et al. 2011, 2012, 2013; Chen et al. 2013a) and emergence (Ma 2002; Hamann et al. 2008; Leighly et al. 2009; Krongold et al. 2010; RodrÍguez Hidalgo et al. 2011; Vivek et al. 2012; Chen et al. 2013b) cases are reported. Such variations, in principle, can be caused by changes in the ionization state of absorbing gas and the coverage fraction of the absorber to the background emission sources. The change in the coverage fraction could be driven via the motions of absorbing gas (e.g., Proga & Kallman 2002; Leighly et al. 2009; Chen et al. 2013a). The change in ionization state of absorbing gas could arise from the variations of background emissions (e.g., Hamann et al. 2011).
Absorption lines with very high ionization states (such as ) can arise from the outflow with a speed up to (e.g., Tombesi et al. 2011), while lines with lower ionization states (such as ) in the outflow can be searched effectively at a velocity of up to without blending with forest. (Misawa et al. 2007). Chen et al. (2013a) firstly reported the disappearance of a narrow absorption doublet to be formed in an outflow with a speed of . However, no disappearance events of narrow absorption lines with speeds up to relative to the quasar system have ever been detected. In this paper, we report the disappearance of a narrow absorption system with a measured speed up to relative to the quasar emission redshift, discovered from the spectrum of SDSS J152645.61+193006.7.
Throughout this paper the cosmological parameters of , and are adopted.
2. Spectral analysis
Up to quasars contained in the quasar spectroscopic catalog of Sloan Digital Sky Survey Data Release Seven (SDSS-I/II, York et al. 2000; Schneider et al. 2010) were re-observed by SDSS-III (Eisenstein et al. 2011; Ross et al. 2012; Pâris et al. 2012), providing us a chance to measure possible disappearance of absorption systems. NALs are often confused by the significant systematic sky-subtraction residuals longward of Å in SDSS-I/II spectra (Wild & Hewett 2005). Our analysis focuses on narrow absorption systems with a very large value of measured velocities relative to the corresponding quasars. We conservatively constrain our analysis within the wavelength range shortward of Å at the observed-frame and longward of the emission line, and pay our attention to the absorption of the doublets with blueshifted velocities with respect to the quasar emission redshift, and select only those quasars with their median SNR over the whole spectrum being greater than 5 (the median SNR over the whole spectrum is defined by Pâris et al. 2012). Spectra of quasars satisfy these criteria. Adopting the method of the combination of cubic splines (for underlying continuum) and Gaussians (for emission line features), we obtain a pseudo-continuum for each spectrum of these quasars by fit (Nestor et al. 2005; Chen et al. 2013a). This pseudo-continuum is used to normalize spectral fluxes and flux uncertainties. We search narrow absorption doublets in the pseudo-continuum normalized spectrum. The rest-frame equivalent widths () of the detected absorption lines are measured from Gaussian fittings. The corresponding uncertainties are estimated via
| (1) |
where is the line profile centered at , is the wavelength, and is the normalized flux uncertainty as a function of pixel (Nestor et al. 2005; Chen et al. 2013a). The sum is performed over an integer number of pixels that covers at least characteristic Gaussian widths.
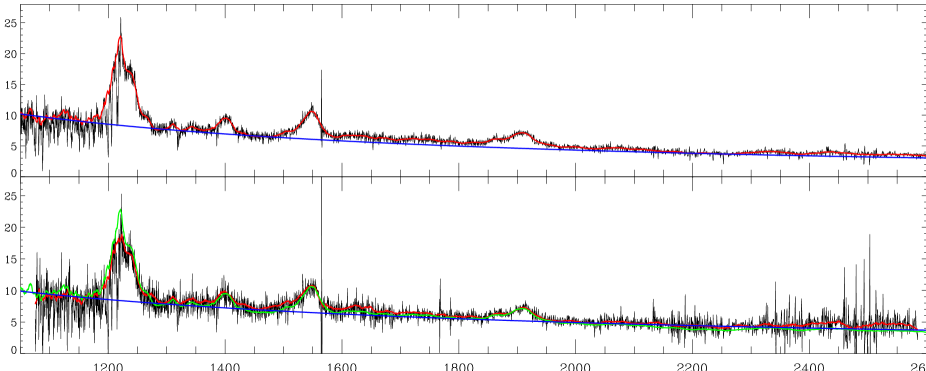
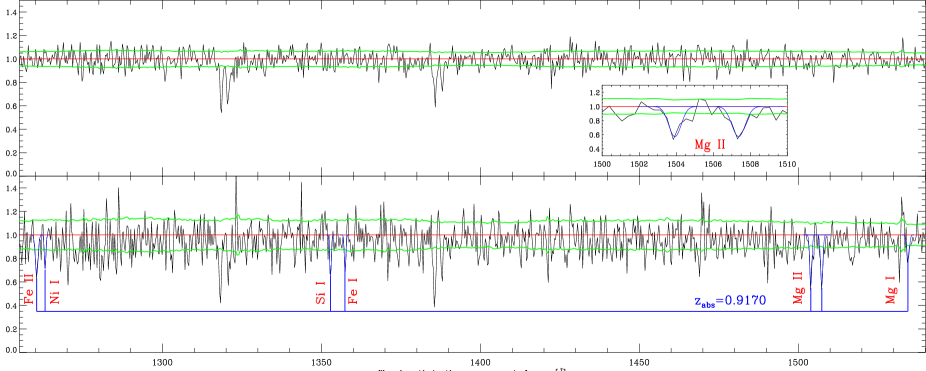
We notice a single phenomenon of disappearance of narrow absorption doublets with velocities up to . For quasar SDSS J152645.61+193006.7 (, taken from Hewett & Wild 2010), we observe that a narrow absorption system with (), which corresponds to with respect to the quasar, imprinted in the SDSS-I/II spectrum disappeared from the SDSS-III spectrum. Both spectra, with the pseudo-continuum fittings, of the quasar are displayed in Fig. 1. The corresponding pseudo-continuum normalized spectra are presented in Fig. 2. The measurements of the corresponding absorption lines are presented in Table 1 (see also Fig. 2).
| (Å) | 0.700.15 | 0.730.16 | 0.420.18 | 0.370.14 | 0.450.14 | 0.350.13 | 0.690.23 |
| (Å) | 0.09 | 0.09 | 0.09 | 0.07 | 0.07 | 0.07 | 0.11 |
aThe equivalent width limits estimated from the SDSS-III spectrum are calculated by Equation (1) as well.
3. Results and Discussion
Quasar J152645.61+193006.7 was observed by SDSS-I/II on 2006 May 31, and re-observed by SDSS-III on 2011 April 9. The time interval of the two observations is 497.4 days at the quasar rest-frame. From the two SDSS spectra of this quasar, we detect the disappearance of a narrow absorption system with . This absorption system has a velocity offset with respect to the quasar emission redshit (). Rough estimation from the curve of growth gives rise to the ionic column density of .
3.1. Coverage fractions
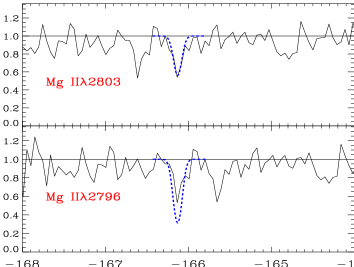
The optical depth ratio of the absorption doublet has a value of , expected from the atomic physics (Savage & Sembach 1991; Verner et al. 1994). If the absorber incompletely covers the background emission sources, the photons apparently leaking through the absorption line region will give rise to a value of optical depth ratio deviated from the theoretical value (e.g., Barlow & Sargent 1997; Hamann et al. 1997; Crenshaw et al. 1999). In principle, the intrinsic absorber is often expected to partially cover the background emission sources. In order to check this, we fit the weaker member of the doublet with a Gaussian profile, scale the model in terms of what atomic physics expects for the stronger member, and compare it with the data. The results are illustrated in Fig. 3. It can be clearly seen from the figure that the profile of scaled to the atomic physics is inconsistent with the data, which is indicative of partial coverage.
The effective coverage fraction of the absorber to the background emission sources can be computed from the residual intensities of the resonance doublet. The normalized residual intensity as a function of velocity from the line center is
| (2) |
where is the effective fraction and is the optical depth at velocity . For the doublet, the effective coverage fraction can be evaluated via
| (3) |
where the subscript and refer to the redder and bluer members of the doublet (e.g., Hamann et al. 1997; Barlow & Sargent 1997; Crenshaw et al. 1999; Misawa et al. 2005, 2007). Due to the low resolution of SDSS spectra, it is inappropriate to evaluate the effective coverage fraction pixel by pixel for the narrow absorption doublet. Therefore, in this paper, we use the normalized residual intensities at line cores to evaluate the effective coverage fraction of the absorber, and get .
In principle, the intrinsic absorber could harbor different coverage fractions to the continuum source and the emission line regions (e.g., Ganguly et al. 1999; Gabel et al. 2005). Therefore, the effective coverage fraction is the fraction of the photons from all the background emission sources going through the intrinsic absorber. Here, we consider the situation that the background photons only arise from the continuum source and the broad emission line region (BELR) (e.g., Ganguly et al. 1999; Wu et al. 2010; Chen et al. 2013b), and assume that the optical depths are the same from the two emission sources. In this case, the effective coverage fraction is the weighted average of the coverage fractions of the two regions. That is
| (4) |
where and are the coverage fractions of the BELR and the continuum source, and is the flux ratio of the broad emission line (without continuum) and the continuum at the wavelength of the absorption line (e.g., Ganguly et al. 1999; Misawa et al. 2005, 2007; Wu et al. 2010). In order to evaluate the value of , we use the method adopted by Chen et al. (2009) to fit a power-law continuum () for the quasar spectra of J152645.61+193006.7, where, several spectral regions without obvious emission lines are selected. We obtain from the SDSS-III spectrum and from the SDSS-I/II spectrum. (These continua are also plotted in Fig. 1 with blue curves.) The strengths, which are measured from the broad emission line and the power-law continuum at the wavelength of the absorption doublet, give rise to a value of . Both values of and can not be determined independently. However, one can constrain a relation for them, which is plotted in Fig. 4.

From equation (4), one can obtain the expression of as a function of , and , which is
| (5) |
where and . Although the value of can not be determined without knowing , we can derive the upper and lower limits of from this equation by considering two extreme values of : and . They correspond to and , respectively.
3.2. The origin of time variation
Time variation of absorption lines and partial coverage of the absorber to background emission sources are the two most popular indicators to separate the intrinsic NALs from the intervening NALs. The coverage fraction and time variation analysis (refer to Fig. 3and Table 1) imply that the narrow absorption system with might be truly intrinsic to the quasar J152645.61+193006.7 with . If so, what would be the mechanism driving the disappearance of this absorption system?
Time variations of absorption lines can be induced by changes in the ionization state of the absorbing gas, which can be driven by the variations of background emissions (from the continuum source or/and the BELR) or caused by a screen of variable optical depth between the absorber and the continuum source (e.g., Misawa et al. 2007), or by the bulk motion of the absorbing gas across our sightline (that might give rise to a change in the coverage fraction of the absorber to background emission sources). If the disappearance of the absorption system is due to the fluctuation of background emissions, it is expectable that an observable change of quasar ionized radiations should be noticed during the corresponding period of observations, as the disappearance event is an extreme case of line variation. In fact, it can be clearly seen from Fig. 1 (refer to the green and red solid curves shown in the lower panel) that the quasar emissions at the two epochs of observation are quite stable. This suggests that the disappearance is unlikely to be caused by the fluctuation of the quasar emissions.
A screen of variable optical depth between the absorber and the background emission sources can also bring about a fluctuation of the incidence flux of the absorber (e.g., Misawa et al. 2007), which is capable of causing a change in the absorber’s ionization levels. If so, the variable ionization scenario may still be alive even if the quasar luminosity is stable. Unfortunately, conditions in the screen can not be determined with present data.
Perhaps, on the rest-frame time corresponding to 2006 May 31 (when quasar J152645.61+193006.7 was observed by SDSS-I/II), the sightline of the object possibly passed through the absorber (possibly near its edge), while on that corresponding to 2011 April 9 (when the object was observed by SDSS-III), the absorber had already moved away from the sightline due to its proper motion. If so, the disappearance of absorption troughs would be expectable. In this way, a notable change of quasar emissions is not required. Therefore, it is likely that the disappearance event of the absorption system is due to the proper motion of the absorption gas across our sightline. Most of the UV continuum emission originates from the inner region of a geometric thin and optical thick accretion disk, whose size scale is (Wise et al. 2004; Misawa et al. 2005). Let us consider the case of the virial black hole mass estimated by Shen et al. (2011) as the black hole mass, . That is . We then obtain a value of , . In terms of the coverage fraction of the absorber to the continuum emission source, namely from to , the lower limits of the absorber radius are from to . Assuming a face-on accretion disk and that the movement of the absorber is perpendicular to our sightline, one can derive the transverse velocity of the absorber by , where is the time interval of the two SDSS observations, which is days. That yields . Since the time interval of days is just the upper limit of transit time of the absorber, the derived values of are only the lower limits of the transverse velocity of the absorber.
It is possible as well that a cosmologically separated foreground galaxy lied on the quasar sightline and located at brought about absorptions to the quasar light, which can be formed in the halo, star-burst wind, or inflow of the galaxy. The absorption system contains some neutral species such as and , which means that the absorber should be in very low ionization condition and that its size can be quite small (in subparsec or smaller) with very high volume density (e.g., Jones et al. 2010). The crossing velocity () could also be explained by rotational velocities of typical spiral galaxies and/or velocity dispersions of cluster of galaxies. If there exist time variations of the galaxy emission, a change in the ionization state of the absorbing gas would be expected, and then it might give rise to the disappearance of absorption troughs. However, with present data, we can not tell if the disappearance of absorption system is truely associated with a cosmologically separated foreground galaxy.
4. Summary
Quasar J152645.61+193006.7 () was first observed by the SDSS-I/II on 2006 May 31, and re-observed by the SDSS-III on 2011 April 9, spending a time interval of 497.4 days. We identify one narrow absorption system with from the SDSS-I/II spectrum, which has a relative velocity of with respect to the quasar emission redshift. However, this absorption system can not be detected from the SDSS-III spectrum. The coverage fraction analysis shows that this absorber partially covers the background emission sources with an effective coverage fraction of .
Time variations of the absorption system might be caused by the change in the ionization state of absorbing gas or by the motion of the absorber perpendicular to the quasar sightline. The quasar emissions (from the continuum source and the broad emission line region) are stable for the two SDSS observations, suggesting that the changes in the absorber’s ionization condition are unlikely to be caused by the variation of the quasar emissions. Therefore, if there exist changes in the ionization state of absorbing gas, they might be driven by a screen of variable optical depth between the absorber and the background emissions (Missawa et al. 2007), if the absorber is intrinsic to the quasar.
The line variation and the partial coverage are the two popular indicators to tell whether the absorber is truly intrinsic to the quasar. Accordingly, the absorption system analyzed in this work is likely to be intrinsic to the corresponding quasar. However, with present data, we can not rule out the possibility that a cosmologically separated foreground galaxy located at gives rise to this absorption system, since time variations of the galaxy emission and motions of the cosmologically intervening absorbers might also exist and that would be capable of causing dramatic variations of absorption lines as well.
References
- (1) Begelman, M. C., McKee, C. F., & Shields, G. A. 1983, ApJ, 271, 70
- (2) Bergeron, J. 1986, A&A, 155, L8
- (3) Barlow, T. A., & Sargent, W. L. W. 1997, AJ, 113, 136
- (4) Castor, J. I., Abbott, D. C., & Klein, R. I. 1975, ApJ, 195, 157
- (5) Contopoulos, J., & Lovelace, R. V. E. 1994, ApJ, 429, 139
- (6) Crenshaw, D. M., Kraemer, S. B., Boggess, A., et al.. 1999, ApJ, 516, 750
- (7) Chelouche, D., & Netzer, H. 2005, ApJ, 625, 95
- (8) Chen, Z. Y., Gu, M. F., & Cao, X. W., 2009, MNRAS, 397, 1713
- (9) Capellupo, D. M., Hamann, F., Shields, J. C., RodrÍguez Hidalgo, P., & Barlow, T. A. 2011, MNRAS, 413, 908
- (10) Capellupo, D. M., Hamann, F., Shields, J. C., RodrÍguez Hidalgo, P., & Barlow, T. A. 2012, MNRAS, 422, 3249
- (11) Capellupo, D. M., Hamann, F., Shields, J. C., Halpern, J. P., & Barlow, T. A. 2013, MNRAS, 429, 1872
- (12) Chen, Z. F., Chen, Z. Y., Qin, Y. P., et al. 2011, RAA, 4, 401
- (13) Chen, Z. F., Qin, Y. P., & Gu, M. F. 2013a, ApJ, 770, 59
- (14) Chen, Z. F., Li, M. S., Huang, W. R., Pan, C. J., & Li, Y. B. 2013b, doi:10.1093/mnras/stt1247
- (15) Dorodnitsyn, A. V. & Novikov, I. D. 2005, ApJ, 621, 932
- (16) Elvits, M. 2000, ApJ, 545, 63
- (17) Eisenstein, D. J., Weinberg, D. H., Agol, E., et al. 2011, AJ, 142, 72
- (18) Filiz Ak, N., Brandt, W. N., Hall, P. B., et al. 2012, ApJ, 757, 114
- (19) Ganguly, R., Eracleous, M., Charlton, J. C., & Churchill, C. W. 1999, AJ, 117, 2594
- (20) Ganguly, R., & Brotherton, M. S. 2008, ApJ, 672, 102
- (21) Gabel, J., Kraemer, S. B., Crensha, D. M., et al. 2005, ApJ, 623, 85
- (22) Hamann, F., Barlow, T. A., Junkkarinen, V., & Burbidge, E. M. 1997, ApJ, 478, 80
- (23) Hamann, F., Kaplan, K. F., RodrÍguez Hidalgo, P., Prochaska, J. X., & Herbert-Fort, S. 2008, MNRAS, 391, L39
- (24) Hamann, F., Kanekar, N., Prochaska, J. C., Murphy, M. T., et al. 2011, MNRAS, 410, 1957
- (25) Hewett, P. C., & Wild, V. 2010, MNRAS, 405, 2302
- (26) Hall, P. B., Anosov, K., White, R. L., et al. 2011, MNRAS, 411, 2653
- (27) Jones, T. M., Misawa, T., Charlton, J. C., Mshar, A. C., & Ferland, G. J. 2010, ApJ, 715, 1497
- (28) Kudoh, T., Shibata, K. 1997a, ApJ, 474, 362
- (29) Kudoh, T., Shibata, K. 1997b, ApJ, 476, 632
- (30) Kaspi, S., et al. 2002, ApJ, 574, 643
- (31) Krongold, Y., Nicastro, F., Brickhouse, N. S., et al. 2003, ApJ, 597, 832
- (32) Krongold, Y., Nicastro, F., Elvis, M., et al. 2005, ApJ, 620, 165
- (33) Krongold, Y., Binette, L., & Hernandez-Ibarra, F. 2010, ApJ, 724, 203
- (34) Kallman, T. 2005, ASPC, 337, 169
- (35) Li, Z. Y. 1996, ApJ, 465, 855
- (36) Lery T., Heyvaerts J., Appl S., & Norman C. A., 1998, A&A 337, 603
- (37) Lery T., Heyvaerts J., Appl S., & Norman C. A., 1999, A&A 347, 1055
- (38) Leighly, K. M., Hamann, F., Casebeer, D. A., & Grupe, D. 2009, ApJ, 701, 176
- (39) Murray, N., Chiang, J., Grossman, S. A., & Voit, G. M. 1995, ApJ, 451, 498
- (40) Ma, F. 2002, MNRAS, 335, L99
- (41) Misawa, T., Yamada, T., Takada-Hidai, M., et al. 2003, AJ, 125, 1336
- (42) Misawa, T., Eracleous, M., Charlton, J. C., & Tajitsu, A. 2005, ApJ, 629, 115
- (43) Misawa, T., Charlton, J. C., Eracleous, M., et al. 2007, ApJS, 171, 1
- (44) Misawa, T., Eracleous, M., Charlton, J. C., & Kashikawa, N. 2007, ApJ, 660, 152
- (45) Nestor, D. B., Turnshek, D. A., & Rao, S. M. 2005, ApJ, 628, 637
- (46) Owen, J. E., Clarke, C. J., & Ercolano, B., 2012, MNRAS, 422, 1880
- (47) Proga, D., Stone, J. M., & Drew, J. E. 1998, MNRAS, 295, 595
- (48) Proga, D., & Kallman, T. R. 2002, ApJ, 565, 455
- (49) Proga, D., Kallman, T. R., Drew, J. E., & Hartley, L. E. 2002, ApJ, 572, 382
- (50) Proga, D. 2007, ApJ, 661, 693
- (51) Proga, D., & Kurosawa, R. 2009, AIPC, 1171, 295
- (52) Pâris, I., Petitjean, P., Aubourg, É., et al. 2012, A&A, 548, 66
- (53) Qin, Y. P., Chen, Z. F., Lü, L. Z., et al. 2013, PASJ, 65, 8
- (54) RodrÍguez Hidalgo, P., Hamann, F., & Hall, P. 2011, MNRAS, 411, 247
- (55) Ross, N. P., Myers, A. D., Sheldon, E. S. et al., 2012, ApJS, 199, 3
- (56) Savage, B. D. & Sembach, K. R. 1991, ApJ, 379, 245
- (57) Schneider, D. P., Richards, G. T., Hall, P. B. et al., 2010, AJ, 139, 2360
- (58) Shen, Y., Richards, G., Strauss, M. A., et al. 2011, ApJS, 194, 45
- (59) Tombesi, F., Cappi, M., Reeves, J. N., et al. 2010, A&A, 521, A57
- (60) Tombesi, F., Cappi, M., Reeves, J. N., et al. 2011, ApJ, 742, 44
- (61) Verner, D. A., Barthel, . D., & Tytler, D. 1994, A&AS, 108, 287
- (62) Vivek, M., Srianand, R., Mahabal, A., & Kuriakose, V. C. 2012, MNRAS, 421, L107
- (63) Weymann, R. J., Morris, S. L., Foltz, C. B., & Hewett, P. C. 1991, ApJ, 373, 23
- (64) Wise, J. H., Eracleous, M., Charlton, J. C., & Ganguly, R. 2004, ApJ, 613, 129
- (65) Wild, V., & Hewett, P. C. 2005, MNRAS, 358, 1083
- (66) Wu, J., Charlton, J. C., Misawa, T., Eracleous, M., & Ganguly, R. 2010, ApJ, 722, 997
- (67) York, D. G., Adelman, J., Anderson, J. E., Jr., et al. 2000, AJ, 120, 1579