AxPUE: Application Level Metrics for Power Usage Effectiveness in Data Centers
Abstract
The rapid growth of data volume brings big challenges to the data center computing, and energy efficiency is one of the most concerned problems. Researchers from various fields are now proposing solutions to green the data center operations. Power usage effectiveness metric plays an important role in the energy saving research. However, the exising usage effectiveness metrics focus on measuring the relationship between the total facility energy consumed and the IT equipment energy consumed, without reflecting the energy efficiency of applications. In this paper, we analyze the requirements of application-level metrics for power usage efficiency of the data centers, and propose two novel energy efficiency metrics to provide strong guidance and useful insight to data center design and optimization. We conduct comprehensive experiments in the practical data centers using BigDataBench, a big data benchmark suite, and the results demonstrate the rationality and efficiency of AxPUE in measuring the actual computation energy consumption in data centers.
Index Terms:
Power Usage Effectiveness; Application Performance; Data CenterI Introduction
As the development of information industry, massive data has been produced in various applications, including online transaction data, web access logs, sensor data, scientific data, etc. According to IDC white book[1], the data size will reach 35ZB by 2020. The era of Big Data has arrived, which brings big challenges to data centers, and energy efficiency is one of the most important problems. The data centers and associated facilities consumed about 1.3% electricity of all the electricity use in the world, and 2% of all electricity use for the US[2]. It makes the corporations and organizations under great pressure to reduce the operation cost of data centers, and also gets wide attentions from both industry and academia. Researchers are proposing various solutions to green the data center operations from different fields.
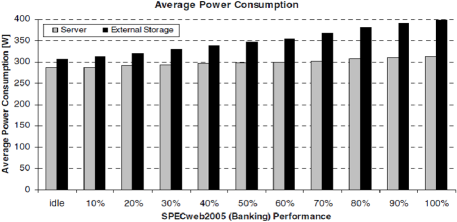
As the key metric for measuring infrastructure energy efficiency for data centers, PUE(Power Usage Effectiveness) is now widely adopted and used in the global industry. PUE was first proposed by the Green Grid Association in 2007[3], and its measure methodology has been refined according to the industry feedback over the past years[4][5]. PUE is an excellent metric to reflect how well a data center is delivering energy to its information technology equipment, and it provides a way to compare the operation efficiency of different data centers. In addition, PUE is always used to evaluate the efficiency improvement of newly proposed energy management mechanisms. However, it focuses on illustrating the energy consumption in the infrastructure level, without reflecting the energy efficiency of applications and workloads. In order to evaluate the impact of workloads on the consumed power of servers, Klaus-Dieter conducted an experiment based on the SPECweb2005 (Banking) workload[6], the results are shown in Figure 1. The server power consumption ranges from 290W at idle to 300W at 100% performance, while the storage power consumption ranges from 310W at idle to 390W at 100% performance. According to the definition of PUE[3], it reflects the ratio of total data center facility energy to the information technology devices energy. Though the workload continues to increase, the power consumed by the information technology devices does not change significantly. The energy consumptions of other infrastructure devices in the data center are not affected directly by the applications, so we can infer that the PUE metric will change little as the elements of application level change, such as data volume, workload type, etc. What’s more, suppose some software energy efficiency optimizations are applied to the data center, which makes the energy consumed by the IT equipment decreased significantly, and the other infrastructure devices’ energy consumption does not change much. At this time, the PUE metric even becomes larger, which means energy efficiency degradation. Genarally speaking, PUE has several limitations to measure the energy efficiency of the whole data center. Firstly, PUE measures the energy of a data center allocated to the information technology equipment, however, it does not provide the description of the energy consumed by the actual computations. Though it plays a critical role in improving the energy efficiency of non-information technology device infrastructures, it contributes little to analyze and improve the efficiency of information technology equipment itself. Secondly, PUE does not reflect the applicaiton characteristics into the energy efficiency measurement, such as applicaiton complexity, data volume, etc. During the procedure of data center planning with specific applicaitons and data scale, it provides little help. An application-level comprehensive metric is of urgent requirement in the energy optimization of data centers.
In this paper, we associate the IT equipment efficiency and the energy consumed in the data center based on the big data application analysis, and propose two novel efficiency metrics to provide strong guidance and useful insight to data center design and optimization. Our contributions include:
-
1.
We analyze the requirements of application-level metrics for power usage efficiency of the data centers, and propose two novel metrics to illustrate intuitive description for the power consumption for the actual computation in data centers. The proposed metrics provide meaningful guidance for optimizing the energy consumption structure of data centers based on specific applications.
-
2.
We give detailed descriptions and calculation formulas for the proposed metrics, analyze the factors that affect the metrics, and propose the computation methodology based on big data applications.
-
3.
We conduct comprehensive experiments in the practical data centers based on Xeon platform using BigDataBench–a big data benchmark suite, and the results demonstrate that AxPUE could provide reasonable measurement for the actual computation energy consumption.
The rest of this paper is organized as follows. In Section 2, we present the related work. In Section 3, we analyze the requirements of application-level metrics in data center designing and optimizing. In Section 4, we give the definition of AxPUE, and describe the computation methodology. In Section 5, we calculate the PUE and AxPUE of an actual data center, and illustrate the experiment results. Conclusions and future work are given in Section 6.
II Related Work
In general, our work in this paper is related to two fields: power usage efficiency metric definition and computation in data centers, energy management optimization based on the power efficiency metrics. In order to measure the energy efficiency of data centers, the Green Grid proposed two metrics in 2007: Power Usage Effectiveness (PUE) and its reciprocal, Data Center Efficiency (DCE)[3]. Since then PUE has received wide adoption in the industry, while DCE has had limited concerns because of the misconception of what data center efficiency really means. After that, the Green Grid redefined the data center efficiency as data center infrastructure efficiency(DCiE), and the confusion was avoided[7]. Though the definitions of PUE and DCiE are straightforward and easy to understand, the computations are complicated due to various influencing factors in the data centers. As a result, a series of work was conducted to get more accurate PUE[4][5][8]. Based on the industrial feedbacks of using PUE, several variants of PUE were proposed: partial PUE (pPUE) was designed for the situation in which only a particular portion of the facility was focused in the measurement[9]; PUE Scalability was designed to describe how well the total energy consumption scales with changes in IT power load[9]. These two metrics both focus on the IT equipment power consumption, and then as a evolution, Data Center Productivity (DCP) was proposed to measure the total power of the data center allocated to the produced in the data center[10]. Based on the various measurements of the , a family of metrics called DCxP were proposed in [11]. Overall, all the existing energy efficiency metrics focus on the power consumption analysis on the infrastructures of data centers, without considering the application characteristics.
Based on the proposed energy efficiency metrics, much work has been done to improve the data center power consumption. The existing work can be classified into four categories: energy management of data center components, such as CPU, disk, etc.[12][13]; energy management of data center systems[14][15][16]; thermal management and mechanisms[17][18][19]; power consumption management in virtual fields[20][21][22]. In addition to this, some researchers proposed energy efficiency or cost effectiveness provisioning tools for workloads in data centers [23][24]. Generally speaking, most of the existing work focused on the energy-saving technology from single field, there is little work on the corresponding technology considering the interactions of technologies from different fields. One encumbrance is the lack of metrics that can reflect the comprehensive energy efficiency from application level to infrastructure level of data centers.
III Requirements of Application Level PUE
As described in the former sections, the existing power usage efficiency metrics evolve from the initial metric PUE[3], and they all focus on the energy efficiency of IT devices and other infrastructures of data centers. In this section, we first give brief description of PUE, then we formulate the necessities of application level PUEs based on two application scenarios. At last we list the criteria of application level PUE for big data centers.
III-A Overview of PUE
PUE is proposed to help data center owners and operators better understand and improve the energy efficiency of their existing data centers, as well as help them make better decisions on new data center deployments. In addition, it provides a dependable way to measure results against comparable IT organizations[3]. It is defined as the ratio of total data center facility energy to the IT equipment energy, just as shown in Equation 1:
| (1) |
During the equation, is defined as all the energy of the infrastructures to keep the normal operation of the data center, which includes several components:
-
•
Power Transmission Equipment: uninterruptible power supply(UPS), switch devices, generator, power distribution unit(PDU), battery, the power transmission loss before external to the IT equipment, etc;
-
•
Cooling Devices: chiller, computer room air conditioning units (CRACs), direct expansion air handler (DX) units, cooling towers, pumps, etc;
-
•
IT Equipment: computer, storage, network equipment, etc;
-
•
Other Components: lighting of data centers, etc.
is defined as the energy associated with all the IT devices and the supplemental equipment(KVM switches, monitors, and workstations or laptops used to monitor or otherwise control the data center). The calculation framework of PUE is illustrated in Figure 2, where the energy structure is divided into three hierarchies: the total facility energy entering the data center, the energy consumed by IT equipment, and the energy consumed by the final computation of applications. PUE covers the lower two hierarchies, without the application elements, which we consider plays an important role in data center energy structure optimization and management improvement.

III-B Why Application Level PUE
We begin to formulate the necessities of application level PUE by two application scenarios.
Scenario 1. The researcher of data management field named Bob is interested in improving the performance of big data analysis, also he concerns green data center. Recently he improves one data classification algorithm, which has less time complexity than the existing algorithm. He wonders whether his work makes a contribute to the energy saving of data centers. So he runs his new algorithm in the data classfication application of a data center, and monitors the energy efficiency metric PUE. It seems that the PUE has no obvious variations with the old classification algorithm, can this result demonstrate the contribution of the new algorithm to the data center energy saving?
Scenario 2. With the expansion of business in company C, the data to be processed and managed of the data center increases sharply. The finance department of C has to makes annual financial budget, and they ask the data center administrator Alice to give a budget plan of the data center power consumption. Alice could estimate the data volume increasement of the data center in the next year according to the data process history and business development trend. However, the existing data center energy efficency metric does not consider the impact of applicaiton-level characteristics, how to estimate the power increasement due to the data volume increasement?
From the above two scenarios, we can find some limitations of PUE, which measures the relationship between the total facility energy consumed and the IT equipment energy consumed, without considering the appication and workload. Energy saving is such a critical problem that researchers from many fields pay great attention, such as architecture, operating system, data mangement, etc. And the energy efficiency problem must be solved from many aspects. However, just as illustated in Scenario 1, PUE can not measure the effectiveness of any changes made upon the data center infrastructure. So a comprehensive metric that reflects the overall energy consumption is in urgent need. Data growth is now a universal trend, and data volume plays an imporant role in the data center design and planning. PUE does not consider the application characteristics in the measurement, so it provides little reference information in the data center planning according to data scale and application complexity, just as described in Scenario 2. How to reflect the relationship of data volume and power consumed is also a meaningful problem.
III-C Criteria of AxPUE
Based on the above analysis, we argue that appication-level power usage effectiveness is of great importance, and its measurement design should follow the listing criteria:
-
•
Sensitivity: The metric should react immediately to changes of both application characteritics and data center facilities, and provides accurate information;
-
•
Usability: The parameters in the metric should be easy to aquire using common collecting tools, and bring as little influence as possible to the normal data center operations;
-
•
Comparability: The metric should adopt unified measurement for various applications, so it can provide meaningful insight to energy optimization of different data centers.
IV Methodology of AxPUE
We propose two application level power usage effectiveness metrics: ApPUE (Application Performance Power Usage Effectiveness) and AoPUE (Application Overall Power Usage Effectiveness), which constitute a family of applicaiton level PUEs named AxPUE. In this section, we first give the detailed definition of these two metrics, and then describe the acquisiton and computation methodology.
IV-A Definition
Definition 1 (ApPUE)
ApPUE is a metric that measures the power usage effectiveness of IT equipments, specifically, how much of the power entering IT equipmetns is used to improve the application performance.
ApPUE reflects the energy efficiency of IT devices, and connected the application characeristics and power consumed. It can be used to evaluate the energy effectiveness provided by IT device suppliers. ApPUE is sensitive to application characteristics, and it’s associated with a time window, which ranges from the start of the application to the completion. ApPUE is a ratio of application performance to the IT equipment power during the time window, as shown in Equation 2:
| (2) |
During this equation, the IT Equipment Power is defined as the average rate of IT Equipment Energy consumed, and the definition of IT Equipment Energy is the same with that of PUE. The Application Performance is defiend as the data processing performance of applications, specifically, the amount of work done in unit time. Its detailed meaning is associated with the application type, we will introduce the computation methodology in the next subsection. This equation gives the computation of ApPUE for a single application, and a typical data center may support different applications. We give the following equation to compute ApPUE for various applciaitons:
| (3) |
represents the application PUE value of the th application during its corresponding time window. The energy consumption of different applications vaires, the application consumed more energy contributes more to the energy efficiency metric. We adopt to represent the weight of the th applicaiton, it is computed through the equation:
| (4) |
.
In order to measure the overall energy usage efficiency of data centers, we propose another metric named AoPUE.
Definition 2 (AoPUE)
AoPUE is a metric that measures the power usage effectiveness of the overall data center system, specifically, how much of the total facility power is used to improve the application performance.
AoPUE measures the energy efficiency of the total data center facility power to the application performance, it reflects the data center productivity. Its computaiton formulas is shown in Equation 3:
| (5) |
During this equation, the meaning of Application Performance is the same to that of ApPUE, and the meaning of Total Facility Power is the rate of Total Facility Energy used, which has the same meaning with that of PUE. AoPUE can also be understood as the ratio of ApPUE to PUE, it can be computed through the following equation:
| (6) |
IV-B Acquisition and Computation
Though the definitions of ApPUE and AoPUE are straightforward and easy to understand, their computaions are difficult due to the complicated elements affecting the values of AxPUE. As described in the formal subsection, there are three factors in the AxPUE computing: IT Equipment Power, Total Facility Power, and Application Performance. The acquisiton methodology of the first two factors are widely researched in the PUE computation, and in this paper, we focus on the acquisition of Application Performance.
Different from IT Equipment Power and Total Facility Power, Application Performance has direct connection to various user applications, and itself is also a metric rather than a pure vaule, so its computation is more complicated. The computation methodology of Application Performance includes two phases: the unified performance metric definition of various applications, and the benchmark design for big data centers.
There are various metrics to evalute applicaiton performance, such as runtime, throughput, etc. In order to provide unified quantitative measurement for different big data applicaitons over various data sets, we adopt the data processing rate[25] as the Application Performance metric, and the data processing rate varies as different application types. We adopt the big data center application categories in [28], and classify the applicaitons into three categories, and adopt different measurements according to their application semantics, as shown in Table I. For data analysis application, the metric of data processing rate is defined as the input data size divided by the application running time. For service and interative real-time applications, the metric is defined as the number of requests or transactions completed in unit time. And the metric for high performance computing is defined as the number of float operations in unit time.
| Application Category | Examples | Metric |
|---|---|---|
| Service Application | Search engine, Ad-hoc queries | Number of requests answered in unit time |
| Data Analysis Application | Data mining, Reporting, Decision support, Log analysis | Volume of data processed in unit time |
| Interative Real-time Application | E-commerce, Profile data management | Number of transactions completed in unit time |
| High Performance Computing | Scientific computing | Number of floating-point operations in unit time |
The data centers support a diversity of data processing applications, and different data centers focus on different application types. In order to get the reasonable and comparable Application Performance metric, the benchmarks should satisfy the following conditions: first, the workloads in the benchmark should be representive for big data applications, and the composition of different workloads should be adjustable to represent different application types; secondly, a scalable data generation tool should be provided in the benchmark, so a relatively stable performance metric can be gotten from the experiments[26]. In this paper, we adopt the BigDataBench[27] to acquire the Application Performance of a specified big data center. BigDataBench is a big data benchmark suite open-sourced recently and publicly available[29], and all the above conditions are well fullfilled in BigDataBench.
V Experiments
In this section, we compute the AxPUE and PUE of three representative categories of big data workloads: comprehensive big data application, single big data application, and high performance computing application which makes the CPU and memory of every server fully used. The experiment results demonstrate that AxPUE can well reflect the energy usage efficiency for applications.
V-A Experiment Overview
| CPU Type | Intel ®Xeon E5645 |
|---|---|
| # Cores | 6 cores@2.4G |
| # threads | 12 threads |
| #Sockets | 2 |
| L1 DCache | 32KB, 8-way associative, 64 byte/line |
| L1 ICache | 32KB, 4-way associative, 64 byte/line |
| L2 Cache | 256 KB, 8-way associative, 64 byte/line |
| L3 Cache | 12 MB, 16-way associative, 64 byte/line |
| Memory | 32 GB , DDR3 |
| Network | 1 Gb ethernet link |
| Workload | Data Size | Description |
|---|---|---|
| BigDataBench | 100GB | Comprehensive Workload |
| SVM | 20GB | Single Workload |
| Sort | 100GB | Single Workload |
| Grep | 100GB | Single Workload |
| Linpack | 32GB | HPC Workload |
| Workload | IT Equipment Power | Total Facility Power | Application Performance | PUE | ApPUE | AoPUE |
| BigDataBench | 100.412KW | 147.323KW | 563.271KB/s | 1.467 | 5.6096 | 3.823 |
| SVM | 103.766KW | 150.897KW | 134.854KB/s | 1.454 | 1.2996 | 0.894 |
| Sort | 92.122KW | 138.481KW | 1588.128KB/s | 1.503 | 17.2394 | 11.468 |
| Grep | 92.331KW | 138.636KW | 24916.998KB/s | 1.502 | 269.866 | 179.730 |
| Linpack | 122.679KW | 170.685KW | 50.46GFLOPS | 1.391 | 0.411 | 0.295 |
In our data center, there are 18 racks which contain 362 servers, 3 large switches, and 8 switches with 28 ports. We sample 8 servers from the whole cluster to conduct our experiments. The details of configuration parameters of each server are listed in Table II. The applications we adopt are listed in Table III, and all the applications are performed on Hadoop 1.0.2. We adopt four typical data analysis workloads from the BigDataBench workload to construct a comprehensive application, which includes sort, wordcount, grep and bayes. We also adopt three single workloads: SVM, Sort and Grep. The Linpack workload is used to make a full use of the CPU and memory of servers. We conduct two experiments to demonstrate the effectiveness of AxPUE: the first experiment is executed on all the workloads to reflect the variation trend of AxPUE on different applicaitons, and the second experiment is executed on specified workload with different implementations and data scales.
V-B Experiment on Different Workloads
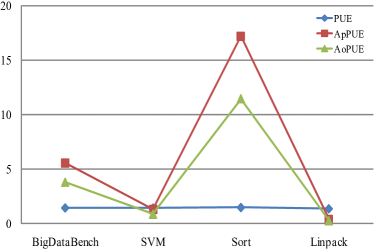
In the framework of Hadoop, there are one master node and serveral slave nodes, we acquire the server power consumption from all the nodes of our Hadoop cluster. The IT equipment power contains server power and the swithgear power, we monitor the power consumption of the devices for every application. The facility power consumption except IT equipment is computed through PDU, UPS and cooling devices. Table IV shows the detailed experiment results of every application, Figure 3 illustrates the trends of three different power usage effectiveness metrics, because the corresponding values of grep is too big to reflect the variation details of the trend, we show the results of other four workloads.
The computation and data processing characteristics of all the applications differ greatly: Grep, Sort and Wordcount scan all the data and conduct simpler computation; while Bayes and SVM classify data based on statistical model, and their computings are more complicated. PUE measures the relationship between the total facility energy consumed and the IT equipment energy consumed, so it does not reflect the workload variation directly. From the results we can see that, the total facility energy and IT equipment energy varies to some extend with the applicaiton type, and the PUE values change in a narrow range from 1.391 to 1.503. PUE does not reflect the workload variations nor the productivity of the data center. During our experiments, the five workloads adopt different metrics for the application performance: Linpack adopts the float-pointing operation rate as the metric, and the other four workloads adopt the data processing capacity as the metric. We analyze the AxPUE values of the four workloads that use the data processing rate as the performance metric. The maxmum of ApPUE is 269.866 KB/J (Grep), and the mixmum of ApPUE is 1.2996 KB/J (SVM). From Table IV we can see that both Grep and Sort consume less IT equipment energy. The Grep workload is the simplest during all the workloads, it scans the whole data set and finds the records matched the key word, and then output them, its data processing capacity is the biggest. Though the computation of Sort is not complicated either, it has to output all the records in the data set as the final result. What’s more, during the shuffle phase of the MapReduce processing framework, the whole data set is written into local files of mapper nodes and transferred to reducer nodes, then read into memories of the reducer nodes, so the I/O load is heavy, and its data processing capacity is much less than Grep. The IT equipment power of SVM is also higher than the simpler workloads, and its data processing capacity is the smallest, so its ApPUE is the smallest. The workload of BigDataBench includes both simple applications and complicated applications, its ApPUE is about 5 times bigger than that of SVM. The IT equipment power of Linpack is the largest of all the workloads, it includes complicated scientific computations and makes both the CPU and memory in full use. The application performance metric of Linpack is different from other workloads, so we cannot make simple horizontal comparison for them. ApPUE and AoPUE measure the energy efficiency from two aspects: ApPUE reflects relationship between application and IT equipment, and AoPUE reflects the energy consumed to the actual computaion work of the whole data center.
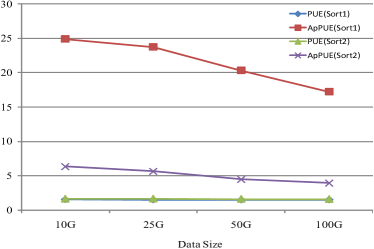
V-C Experiment on Sort
In this experiment, we compute the AxPUE of sort with two implementations to demonstrate that AxPUE can reflect the influence of mechanisms of application level on the power usage effectiveness, we also show the variation trends of AxPUE on data sets of different sizes. There are different algorithms to implement sort on Hadoop. In the first experiment, we adopt the sort algorithm with random sample during the partition phase, we call it sort1. In sort1, the mapper scan the block arranged to it, and output the immediate results after sorting them, then these immediate results are partitioned to different reducers. The reducers are responsible for continous but nonoverlapping partitions. In order to keep the load balance of all the reducers, sort1 determines the partition range of every reducer based on random samples from the input data. In Sort2, we set the number of reducers to be one, which means that the outputs of all the mappers are merged in one reducer, and there is no need of a partition method.
From the experiment results shown in Figure 4, we can find that the values of PUE are almost the same of sort1 and sort2, and ApPUE can reflect the differences of these two implementation mechanisms. The partition method of sort1 samples some data randomly from the input data sets, and determines the range of every reducer based on the sampling data. The sampling phase may cost some time and energy, however, it guarantee the load balance of every reducer to a great extent. Though sort2 does not need to do the sampling and the partitioning, all the immediate results are sent to one reducer, which makes the reducer node consumes more power, and the running time longer. So we can see from the results that the ApPUE of sort1 is higher, and it means that sort1 is more energy-efficient than sort2. We can conclude that AxPUE can reflect the energy efficiency of mechanisms in the application level, and provides meaningful guidance for the data center energy optimization from different fields.
As the data size changes, we can see that the PUE value still remains almost the same, it does not include the data volume factor in the metric, so it can not provide reference information for data center planning with specified data size. The ApPUE reflects the data processing rate of unified energy, however, it is not reasonable to compute the required energy of specified data volume by extending a single ApPUE value linearly. From the results we can observe that as the data size changes, the ApPUE does not remain the same. As analyzed in [26], sort is an I/O intensive application, and I/O operation is a bottleneck for Sort. When conduct the data center planning, we suggest that the administrators analyze the application characteristics and the variation trend of ApPUE on different data sets, instead of scaling out a single AxPUE with the data volume.
VI Conclusion
In this paper, we analyze the requirements of application-level energy effectiveness metrics AxPUE in the data centers, and propose two novel applicaiton-level metrics to measure the energy consumed to the final computing application. Our experiment results demonstrate that ApPUE and AoPUE can reflect the data center energy efficiency variation of different workloads, and provide meaningful guidance for greening data centers from various fields. In general, the concept of AxPUE proposed in this work is fundamental to the data center energy efficiency metric. ApPUE and AoPUE gives an preliminary exploration on the application-level PUEs, we believe that more metrics would join the family of AxPUE in the future work, and provide meaningful guidance for energy consumption optimization associated with appliation characteristics.
Acknowledgment
We are very grateful to anonymous reviewers. We also thank Lei Wang for the informative discussions that guide this work, and Jie Lv for help in the experiments. This work is supported by the Chinese 973 project (Grant No.2011CB302502), the NSFC project (Grant No.60933003, 61202075), the BNSF project (Grant No.4133081), and the 242 project (Grant No.2012A95).
References
- [1] Gantz J., Reinsel D.. Extracting value from chaos technical report white paper. International Data Corporation (IDC) Sponsored by EMC Corporation, 2011
- [2] Koomey, JG., Growth in Data Center Electricity Use 2005 to 2010, 2011, Stanford University
- [3] The Green Grid, The Green Grid Data Center Power Efficiency Metrics: PUE and DCiE White Paper 6,2007, www.thegreengrid.org/Global/Content/white-papers/The-Green-Grid-Data-Center-Power-Efficiency-Metrics-PUE-and-DCiE
- [4] The Green Grid, Usage and Public Reporting Guidelines for The Green Grid s Infrastructure Metrics (PUE/DCiE) White Paper 22, 2009
- [5] The Green Grid, PUE Scalability Metric and Statistical Analyses White Paper 20,2009, www.thegreengrid.org/Global/Content/white-papers/PUE
- [6] Klaus-Dieter Lange, The Next Frontier for Power/Performance Benchmarking: Energy Efficiency of Storage Subsystems. Proceedings of the 2009 SPEC Benchmark Workshop on Computer Performance Evaluation and Benchmarking, 2009
- [7] The Green Grid, The Green Grid Metrics: Data Center Infrastructure Efficiency Detailed Analysis White Paper 14, 2008, www.thegreengrid.org/Global/Content/white-papers/DCiE-Detailed-Analysis
- [8] ASHRAE Datacom Series Book 9, Real-Time Energy Consumption Measurements in Data Centers, 2010, www.ashrae.org/publications/page/1900#9
- [9] The Green Grid, White Paper 49-PUE: A Comprehensive Examination of the Metric, 2012, http://www.thegreengrid.org/en/Global/Content/white-papers/WP49-PUEAComprehensiveExaminationoftheMetric
- [10] The Green Grid, A Framework for Data Center Energy Productivity, 2008, http://www.thegreengrid.org/gg_content/White_Paper_13_-_Framework_for_Data_Center_Energy_Productivity5.9.08.pdf
- [11] Hass, J., Monroe, M., Pflueger, J., Pouchet, J., Snelling, P., Rawson, A., Rawson, F., Proxy Proposals for Measuring Data Center Productivity. The Green Grid: Beaverton, OR, 2009
- [12] Zhu, Q., Chen, Z., Tan, L., Zhou, Y., Keeton, K., and Wilkes, J. , Hibernator: helping disk arrays sleep through the winter. In Proceedings of the Twentieth ACM Symposium on Operating Systems Principles (Brighton, United Kingdom, October 23-26, 2005). SOSP ’05. ACM, New York 26,NY, 177-190
- [13] Zhu, Q. and Zhou, Y, Power -Aware Storage Cache Management. IEEE Trans. Comput. 54, 5 (May. 2005), 587-602
- [14] Jeffrey S., Darrell C., Prachi N., Amin M., Ronald P., Managing energy and server resources in hosting centers, Proceedings of the eighteenth ACM symposium on Operating systems principles, October 21-24, 2001, Banff, Alberta, Canada.
- [15] Charles Lefurgy , Xiaorui Wang , Malcolm Ware, Server-Level Power Control, Proceedings of the Fourth International Conference on Autonomic Computing, p.4, June 11-15, 2007
- [16] Ripal Nathuji, Canturk Isci, Eugene Gorbatov, Exploiting Platform Heterogeneity for Power Efficient Data Centers, Proceedings of the Fourth International Conference on Autonomic Computing, p.5, June 11-15, 2007
- [17] Moore, J., Chase, J., and Ranganathan, P. 2006. Weatherman: Automated, online, and predictive thermal mapping and management for data centers. In Proceedings of the 2nd International Conference on Autonomic Computing (ICAC). Dublin, Ireland, 155–164
- [18] Justin Moore, Jeff Chase, Parthasarathy Ranganathan, Ratnesh Sharma, Making scheduling ”cool”: temperature-aware workload placement in data centers, Proceedings of the USENIX Annual Technical Conference 2005 on USENIX Annual Technical Conference, p.5-5, April 10-15, 2005, Anaheim, CA
- [19] Cullen Bash, George Forman, Cool job allocation: measuring the power savings of placing jobs at cooling-efficient locations in the data center, 2007 USENIX Annual Technical Conference on Proceedings of the USENIX Annual Technical Conference, p.1-6, June 17-22, 2007, Santa Clara, CA
- [20] Ripal Nathuji, Karsten Schwan, VirtualPower: coordinated power management in virtualized enterprise systems, Proceedings of twenty-first ACM SIGOPS symposium on Operating systems principles, October 14-17, 2007, Stevenson, Washington, USA
- [21] Jan Stoess, Christian Lang, Frank Bellosa, Energy management for hypervisor-based virtual machines, 2007 USENIX Annual Technical Conference on Proceedings of the USENIX Annual Technical Conference, p.1-14, June 17-22, 2007, Santa Clara, CA
- [22] Dara Kusic, Jeffrey O. Kephart, James E. Hanson, Nagarajan Kandasamy , Guofei Jiang, Power and Performance Management of Virtualized Computing Environments Via Lookahead Control, Proceedings of the 2008 International Conference on Autonomic Computing, p.3-12, June 02-06, 2008
- [23] G. Lu et al. PowerTracer: Tracing Requests in Multi-tier Services to Diagnose Energy Inefficiency. In Proceedings of 9th ACM/IEEE International Conference on Autonomic Computing (ICAC 2012), pages 97-102, 2012
- [24] J. Zhan et al. Cost-aware cooperative resource provisioning for heterogeneous workloads in data centers. Computers, IEEE Transactions on (Volume:PP, Issue: 99).
- [25] C. Luo et al. Cloudrank-d: benchmarking and ranking cloud computing systems for data processing applications. Frontiers of Computer Science, 6(4):347-362, 2012
- [26] Z. Jia et al. The Implications of Diverse Applications and Scalable Data Sets in Benchmarking Big Data Systems. Lecture Node in Computer Scienc. 2013
- [27] W. Gao et al. BigDataBench: a Big Data Benchmark Suite from Web Search Engines. The Third Workshop on Architectures and Systems for Big Data(ASBD 2013) in conjunction with The 40th International Symposium on Computer Architecture, May 2013.
- [28] J. Zhan et al. High volume computing: Identifying and char- acterizing throughput oriented workloads in data centers. In Parallel and Distributed Processing Symposium Workshops & PhD Forum (IPDPSW), 2012 IEEE 26th International, pages 1712-1721. IEEE, 2012
- [29] BigDataBench, http://prof.ict.ac.cn/BigDataBench/