Lattice NRQCD study of in-medium bottomonium states using HotQCD configurations
Abstract:
The behavior of bottomonium state correlators at non-zero temperature, (MeV), where the transition temperature is (MeV), is studied, using lattice NRQCD on HotQCD HiSQ action configurations with light dynamical () staggered quarks. In order to understand finite temperature effects on quarkonium states, zero temperature behavior of bottomonium correlators is compared based on ( and ) and ( lattices. We find that temperature effects on S-wave bottomonium states are small but P-wave bottomonium states show a noticeable temperature dependence above the transition temperature.
1 Introduction
Studying the properties of the Quark-Gluon Plasma (QGP) requires us to compare high energy hadron- and nuclear collisions. In understanding the differences between the two, we can shed light on the question, how the presence of a hot medium modifies the abundance of measured particles. Quarkonium physics offers an excellent opportunity for such a comparison [1] because inclusive productions and decays of these quark anti-quark pairs are better understood than those involving light hadrons. The heavy quark mass of the quarkonium constituents provides a “factorization” of the short distance perturbative physics from the long distance non-perturbative effects, which can be discussed by applying various effective field theories of QCD [2, 3].
Recent studies of in-medium quarkonium behavior, based on lattice NRQCD at finite temperature, show a survival of S-wave bottomonium up to and melting of P-wave bottomonium above the transition temperature () [4, 5], sequential suppression of excited states S-wave bottomonium above [6], heavy quark mass dependence of S-wave bottomonium [7] and velocity dependence of S-wave bottomonium moving in a thermal environment [7, 8]. In these studies, temperature is changed by varying the number of time-directional lattice slices at a fixed lattice spacing (. i.e. is fixed and is an integer (= 16, 18, 20, 24, 28, 32, and 80)). Due to the common renormalization scale this makes it easier to compare the temperature dependent behavior of lattice NRQCD bottomonium correlators and their spectral functions at different temperatures. On the other hand, the discreteness of the accessible temperatures hampers a detailed study near . In addition, in these studies, the spectral functions are computed using the standard Maximum Entropy Method (MEM) [9] on NRQCD bottomonium correlators with NRQCD kernel (). It will be interesting to calculate the spectral functions with methods other than the MEM. Here, we report preliminary results from our lattice NRQCD study of in-medium bottomonium behavior on ( HotQCD configurations, generated with HiSQ fermions on [10]. Unlike previous lattice NRQCD studies [4, 6, 7, 8], temperature is varied continuously (fixed, is changed by varying the coupling constant) and a novel improved Bayesian method is used for the computation of spectral functions [11, 12, 13].
2 Zero Temperature
Since the lattice spacing in our study is changed to vary temperature, a comparison of NRQCD correlators at different temperatures is more complicated. It requires simulations, which supplement the finite temperature simulations at the same gauge coupling constant. We determine the quarkonium mass from an exponential fit to the NRQCD correlators, i.e. an “energy offset” needs to be obtained [14]. Also the performance of the improved Bayesian method used in this work can be assessed using the zero temperature features of bottomonium spectral functions. Thus, we first carry out a lattice NRQCD analysis on low temperature HotQCD configurations. The list of parameters for these lattice configurations is given in Tab. (1), where is chosen for (GeV) for a given .
| Volume | (MeV) | (fm) | analyzed Ncfg | ||
|---|---|---|---|---|---|
| 6.664 | 52.65 | 0.1169 | 2.759 | 100 | |
| 6.800 | 59.93 | 0.1027 | 2.424 | 100 | |
| 6.950 | 68.98 | 0.08925 | 2.107 | 100 | |
| 7.280 | 46.62 | 0.06603 | 1.559 | 100 |
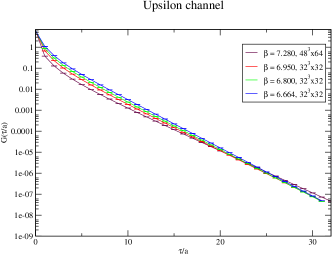
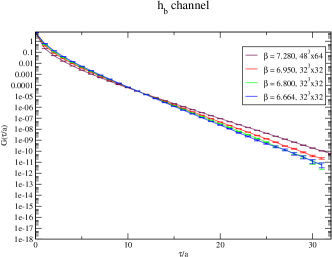
Fig. (1) shows the typical behavior of S-wave and P-wave bottomonium correlators, which are computed from NRQCD bottom quark propagators at , as a function of the Euclidean time (). Exponential function fits to the quarkonium correlators yield the energy of the corresponding quarkonium states (e.g., for the Upsilon channel and for the channel, respectively). Here, from at each , we determine the constant energy offset for the simulated .
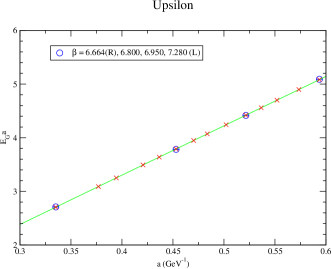
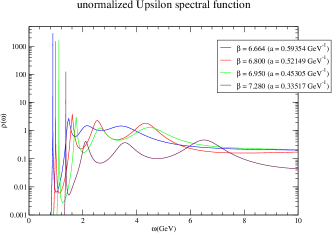
Fig. (2) shows the energy offset constant () at each . The blue circles in the figure are the energy offset determined from the fitted energy of the zero temperature state at (the horizontal axis is the lattice spacing, (GeV) for each ). The green line is the linear interpolation among the blue circle data points. The red crosses are the energy offset which will be used for non-zero temperature runs. In addition, the computed spectral functions for at temperature are shown in Fig. (3). The position of the first peak agrees with the result of a 1-exponential function fit to the respective correlators within errors. The shapes of the spectral functions are quite similar to each other as expected and may be matched to each other by accommodating the constant energy offset effect (constant amount shift along the horizontal axis for the spectral functions) and by considering the normalization difference in the spectral function between lattices and lattice (rescale along the vertical axis for the spectral functions).
3 Around the Transition Temperature
| T | (fm) | analyzed Ncfg | |||
|---|---|---|---|---|---|
| 6.664 | 140.40 | 0.911 | 0.1169 | 2.759 | 100 |
| 6.700 | 145.32 | 0.944 | 0.1130 | 2.667 | 100 |
| 6.740 | 150.97 | 0.980 | 0.1087 | 2.566 | 100 |
| 6.770 | 155.33 | 1.008 | 0.1057 | 2.495 | 100 |
| 6.800 | 159.80 | 1.038 | 0.1027 | 2.424 | 100 |
| 6.840 | 165.95 | 1.078 | 0.09893 | 2.335 | 100 |
| 6.880 | 172.30 | 1.119 | 0.09528 | 2.249 | 100 |
| 6.910 | 177.21 | 1.151 | 0.09264 | 2.187 | 100 |
| 6.950 | 183.94 | 1.194 | 0.08925 | 2.107 | 100 |
| 6.990 | 190.89 | 1.240 | 0.086 | 2.030 | 100 |
| 7.030 | 198.08 | 1.286 | 0.08288 | 1.956 | 100 |
| 7.100 | 211.23 | 1.371 | 0.07772 | 1.835 | 100 |
| 7.150 | 221.08 | 1.436 | 0.07426 | 1.753 | 100 |
| 7.280 | 248.63 | 1.614 | 0.06603 | 1.559 | 100 |
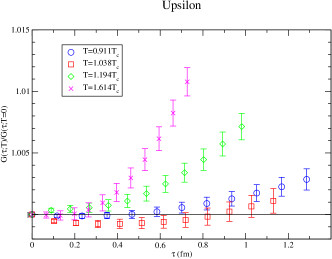
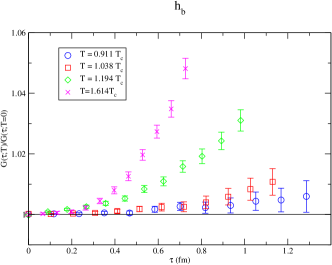
The list of parameters for the non-zero temperature lattice configurations used in our lattice NRQCD analysis is given in Tab. (2). Fig. (4) shows the ratios of the non-zero temperature quarkonium correlators () to the temperature quarkonium correlators ( and ) at those values of at which configurations are available ( and channel). In these ratios, the energy offset effect cancels, since it is a function of lattice spacing and is independent of the temperature. Similar to the results from previous studies [4, 6, 7, 8], the S-wave ratios exhibit only small changes with temperature, while the P-wave ratios show a large dependence. In contrast, the advantage of continuously changing temperature becomes clear, when we compare the ratios from all the temperatures. The temperature effect in the P-wave increases as surpasses . Interestingly however the temperature effect in the S-wave at is more or less similar to that at begins to increase only at .
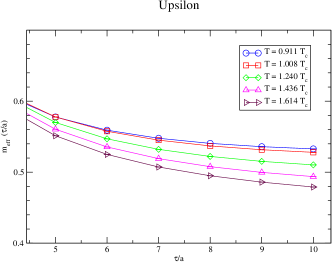
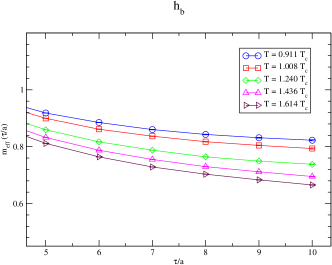
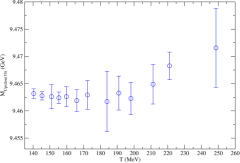
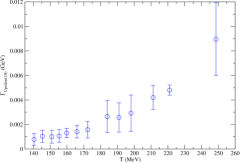
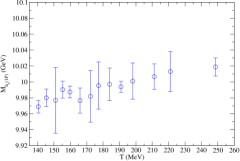
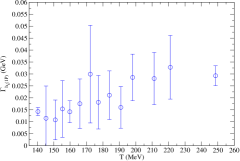
In Fig. (5) we plot . Instead of showing the effective mass data from all 14 temperatures in Tab. (2), we chose five temperatures for a clear presentation. None of the effective mass plots contain a clear plateau. Similar to Fig. (4), the S-wave effective mass plot exhibits a small effect below and shows an increasing temperature dependence above . In contrast, the P-wave effective mass plot shows an decrease in the values for the whole temperature range. We also applied the new Bayesian method to non-zero temperature bottomonium correlators to obtain the spectral functions for each channel. In Fig. (6), we show the first peak position of the S-wave () channel spectral function and the width of the first peak at each temperature. Fig. (7) contains the values for the P-wave (). The error bars in each figure are estimated from the Jacknife spread of measured values (peak position and its width) on 5 sets of 20 correlators for each channels. Similar to the observations from Fig. (4,5), the S-wave spectral functions behave differently from the P-wave spectral functions. The first peaks of the S-wave spectral functions stay at the same position below and begin to move upward above as increases. The position of the first peak of the P-wave spectral functions appears to rise linearly in across . Also, the width of the first peak of the P-wave spectral functions seems to have a -dependence albeit large Jackknife error bar.
4 Conclusion
We have investigated the non-zero temperature behavior of S-wave and P-wave bottomonium by computing lattice NRQCD correlators on flavor HotQCD configurations and analyzing their spectral functions using an improved Bayesian method [11, 12, 13]. The studied temperature is (MeV) (MeV), where the cross-over transition temperature is MeV. Compared to the previous lattice NRQCD studies on quarkonium in-media, where the lattice spacing is fixed and the temperature can only be changed discretely by changing the number of the time slices [4, 6, 7, 8], temperature can be varied continuously in this study. Hence the modification of quarkonium across the transition temperature can be investigated in detail.
Preliminary results show that the behavior of S-wave bottomonium (Upsilon and states) is distinctly different from that of P-wave bottomonium ( state) across . The ratio of the correlator to the temperature correlator, as well as the effective mass for the S-wave is more or less unchanged below and begins to increase only above . The temperature effect in the ratio and in the effective mass for the P-wave appears to be . Spectral functions from the improved Bayesian method show a very similar picture. The first peak position of S-wave bottomonium spectral functions stays more or less the same below and begins to increase above . On the other hand, the first peak position of P-wave bottomonium spectral functions appears to move proportional to across . Further analysis with increased statistics and systematic error analysis of the improved Bayesian method will follow in near future.
Acknowledgements
SK is supported by the National Research Foundation of Korea grant funded by the Korean government (MEST) No. 2012R1A1A2A04668255. PP is supported by U.S.Department of Energy under Contract No.DE-AC02-98CH10886. AR is partly supported by the Swiss National Science Foundation (SNF) under grant 200021-140234.
References
- [1] N. Brambilla, S. Eidelman, B. K. Heltsley, R. Vogt, G. T. Bodwin, E. Eichten, A. D. Frawley and A. B. Meyer et al., Eur. Phys. J. C 71 (2011) 1534 [arXiv:1010.5827 [hep-ph]].
- [2] G. T. Bodwin, E. Braaten and G. P. Lepage, Phys. Rev. D 51 (1995) 1125 [Erratum-ibid. D 55 (1997) 5853] [arXiv:hep-ph/9407339].
- [3] N. Brambilla, A. Pineda, J. Soto and A. Vairo, Rev. Mod. Phys. 77 (2005) 1423 [hep-ph/0410047].
- [4] G. Aarts, S. Kim, M. P. Lombardo, M. B. Oktay, S. M. Ryan, D. K. Sinclair and J. -I. Skullerud, Phys. Rev. Lett. 106 (2011) 061602 [arXiv:1010.3725 [hep-lat]].
- [5] G. Aarts, C. Allton, S. Kim, M. P. Lombardo, S. M. Ryan and J. -I. Skullerud, arXiv:1310.5467 [hep-lat].
- [6] G. Aarts, C. Allton, S. Kim, M. P. Lombardo, M. B. Oktay, S. M. Ryan, D. K. Sinclair and J. I. Skullerud, JHEP 1111 (2011) 103 [arXiv:1109.4496 [hep-lat]].
- [7] S. Kim, G. Aarts, C. Allton, M. P. Lombardo, M. B. Oktay, S. M. Ryan, D. K. Sinclair and J. -I. Skullerud, PoS LATTICE 2012 (2012) 086 [arXiv:1210.7586 [hep-lat]].
- [8] G. Aarts, C. Allton, S. Kim, M. P. Lombardo, M. B. Oktay, S. M. Ryan, D. K. Sinclair and J. -I. Skullerud, JHEP 1303 (2013) 084 [arXiv:1210.2903 [hep-lat]].
- [9] M. Asakawa, T. Hatsuda and Y. Nakahara, Prog. Part. Nucl. Phys. 46 (2001) 459 [hep-lat/0011040].
- [10] A. Bazavov, T. Bhattacharya, M. Cheng, C. DeTar, H. T. Ding, S. Gottlieb, R. Gupta and P. Hegde et al., Phys. Rev. D 85 (2012) 054503 [arXiv:1111.1710 [hep-lat]].
- [11] Y. Burnier and A. Rothkopf, arXiv:1307.6106 [hep-lat].
- [12] Y. Burnier and A. Rothkopf, Phys. Rev. D 87 (2013) 114019 [arXiv:1304.4154 [hep-ph]].
- [13] Y. Burnier and A. Rothkopf, arXiv:1310.0645 [hep-lat], PoS LATTICE 2013, 490 (2013).
- [14] R. J. Dowdall et al. [HPQCD Collaboration], Phys. Rev. D 85 (2012) 054509 [arXiv:1110.6887 [hep-lat]].