An ALMA Survey of Sub-millimetre Galaxies in the Extended Chandra Deep Field South: The Far-Infrared Properties of SMGs
Abstract
We exploit ALMA 870-m (345 GHz) observations of sub-millimetre sources in the Extended Chandra Deep Field South to investigate the far-infrared properties of high-redshift sub-millimetre galaxies (SMGs). Using the precisely located 870 m ALMA positions of 99 SMGs, together with 24m and radio imaging of this field, we deblend the Herschel / SPIRE imaging of this region to extract their far-infrared fluxes and colours. The median redshifts for ALMA LESS (ALESS) SMGs which are detected in at least two SPIRE bands increases as expected with wavelength of the peak in their SEDs, with = 2.3 0.2, 2.5 0.3 and 3.5 0.5 for the 250, 350 and 500-m peakers respectively. We find that 34 ALESS SMGs do not have a 3 counterpart at 250, 350 or 500m. These galaxies have a median photometric redshift derived from the rest-frame UV–mid-infrared SEDs of = 3.3 0.5, which is higher than the full ALESS SMG sample; = 2.5 0.2. Using the photometric redshifts together with the 250–870m photometry, we estimate the far-infrared luminosities and characteristic dust temperature of each SMG. The median infrared luminosity and characteristic dust temperature of the 2 mJy SMGs is = (3.0 0.3) 1012 (star formation rate of SFR = 300 30 yr-1) and = 32 1 K ( = 93 4 m). At a fixed luminosity, the characteristic dust temperature of these high-redshift SMGs is = 3–5 K lower than comparably luminous galaxies at = 0, reflecting the more extended star formation occurring in these systems. By extrapolating the 870m number counts to = 1 mJy, we show that the contribution of 1 mJy SMGs to the cosmic star formation budget is 20% of the total over the redshift range 1–4. We derive a median dust mass for these galaxies of = (3.6 0.3) 108 M⊙ and by adopting an appropriate gas-to-dust ratio, we estimate that the typical molecular mass of the ALESS SMGs in our sample is = (4.2 0.4) 1010 M⊙. Together with the average stellar masses of SMGs, = (8 1) 1010 M⊙, this suggests an average molecular gas fraction of 40%. Finally, we use our estimates of the H2 masses to show that SMGs with 1 mJy ( 1012 L⊙) contain 10% of the 2 volume-averaged H2 mass density at this epoch.
keywords:
galaxies: starburst, galaxies: evolution, galaxies: high-redshift1 Introduction
Ultra-luminous Infrared Galaxies (ULIRGs; Sanders & Mirabel 1996) have total infrared luminosities 1012-13 L⊙ and implied star formation rates (SFR) 100–1000 M⊙ yr-1. Their low space densities mean that ULIRGs contribute 1% of the volume average star formation density at = 0. However, the first deep, single-dish bolometer surveys in the 870-m atmospheric window uncovered high number densities of high-redshift sub-mm galaxies (SMGs) at mJy flux density levels (Smail et al., 1997; Hughes et al., 1998; Barger et al., 1998). Subsequent spectroscopic studies of the radio- / mid-infrared detected subset of the population gave a median redshift of 2.5 (Chapman et al., 2005), confirming their ULIRG-like luminosities (Kovács et al., 2006; Coppin et al., 2008a; Magnelli et al., 2012a) and demonstrated that ULIRGs undergo a 1000-fold increase in space density from = 0 to 2.5. Thus, in contrast to the local Universe, ULIRGs are a non-negligible component of the star-forming population at 2–3 (e.g. Hughes et al., 1998; Lilly et al., 1999; Blain et al., 1999; Chapman et al., 2005; Wardlow et al., 2011; Barger et al., 2012; Casey et al., 2013).
These 870-m-selected samples remain the best-studied SMGs, and links have been proposed between SMGs, QSOs and the formation phase of massive galaxies at high redshift (e.g. Genzel et al., 2003; Swinbank et al., 2006; Coppin et al., 2008b; Daddi et al., 2009; Hickox et al., 2012). SMGs are therefore a potentially important element in models of galaxy formation. However, these evolutionary links are still unproven, although it is clear that most luminous SMGs lie above the purported “main sequence” of star-forming galaxies in the star formation rate–M⋆ plane (e.g. Daddi et al., 2007; Noeske et al., 2007; Rodighiero et al., 2011; Wardlow et al., 2011). Along with corroborating kinematic and morphological evidence (Tacconi et al., 2006, 2008; Engel et al., 2010; Swinbank et al., 2010; Alaghband-Zadeh et al., 2012), inevitably it has been argued that SMGs can be understood as “scaled-up” analogs of local ULIRGs which are dominated by merger induced starbursts. It has also been proposed that lower luminosity SMGs overlap with the “main sequence”, leading to claims of an apparent dichotomy within this population: i.e. between a true “starburst” population and slightly less active galaxies, potentially driven by secular processes (Rodighiero et al., 2011).
Theoretical attempts to reproduce basic properties of SMGs, such as 870-m number counts, have also led to an equally wide variety of conclusions about the nature and diversity of this population. For example, early models from Baugh et al. (2005) and Granato et al. (2006) include two recipes for star formation; “burst” and “quiescent”, with SMGs corresponding to the most extreme starburst systems. One key strength of these models is that they are also required to fit the galaxy population at = 0, which forces the former to adopt a burst initial mass function (IMF) biased to high-mass stars (allowing relatively low-mass galaxies to produce intense starbursts; Baugh et al. 2005). In contrast, numerical models of Hayward et al. (2011) (see also Narayanan et al. 2009 and Davé et al. 2010) suggest that SMGs are dominated by secular bursts in gas-rich disk galaxies, with “standard” IMFs. Hence theoretical models variously predict the SMG population to comprise low-mass merging starbursts (with unusually low mass-to-light ratios; e.g. Baugh et al. 2005) and isolated, gas-rich disk galaxies undergoing secular bursts (e.g. Davé et al., 2010; Hayward et al., 2012).
This rich array of theoretical options demonstrates the power of SMGs to distinguish between the competing galaxy evolution theories. Observations of the most basic properties of SMGs, such as their redshift distribution, bolometric luminosities, cold molecular gas dynamics and gas mass, and contribution to the cosmic star formation density should have the power to distinguish between the theoretical models.
However, the coarse resolution of single dish sub-mm telescopes (typically 15–20′′) means that identifying the SMG counterparts has to date, relied on correlations between their sub-millimetre emission and that in other wave-bands where higher spatial resolution is available (usually the radio and / or mid-infrared; e.g. Ivison et al. 2002, 2005, 2007; Pope et al. 2006). The spectral energy distributions (SEDs) in these other wave-bands have positive K-corrections, making counterparts which either lie at higher redshift or that have colder-than-average dust temperatures impossible to identify. Indeed, in sub-millimetre surveys typically 40–50% of sub-mm sources lack “robust” counterparts in the radio or mid-infrared (e.g. Biggs et al. 2011, see also Lindner et al. 2011) and it is unknown whether the unidentified SMGs have the same redshift distribution (or are representative) of the radio-identified subset, potentially biasing the current observational results.
To circumvent the problem of missing- (and mis-) identifications and so characterize the whole population of bright SMGs in an unbiased manner requires precisely locating the sub-mm emission using sub/mm interferometers (e.g. Wang et al., 2011; Smolčić et al., 2012). Recently, we have undertaken an ALMA survey of the 126 sub-mm sources in the 0.5 0.5 degree Extended Chandra Deep Field South (ECDFS), taken from the “LESS” survey (Weiß et al., 2009). The ALMA data precisely locate the SMGs, directly pin-pointing the source(s) responsible for the sub-mm emission (to within 0.3′′), without recourse to statistical radio / mid-IR associations and so yielding unambiguous identifications for the majority of the SMGs. The first results from our survey include the source catalog and multiplicity of bright SMGs (Hodge et al., 2013); the first high-resolution sub-mm counts (Karim et al., 2013); optical and near-infrared properties, photometric redshift distribution and stellar masses (Simpson et al. 2013); serendipitous identification [Cii] at = 4.4 in two SMGs (Swinbank et al., 2012) and subsequent 12CO follow-up in these galaxies (Huynh et al., 2013); X-ray properties and AGN fraction of ALMA SMGs (Wang et al., 2013); far-infrared–radio correlation of SMGs (Thomson et al. 2014 submitted) and HST morphologies (Simpson et al. 2014 in prep).
In this paper, we extend these analysis and exploit the Herschel Space Observatory PACS and SPIRE imaging of the ECDFS to derive the far-infrared/sub-millimeter properties of the SMGs pinpointed by ALMA. In particular, we use the far-infrared (70–870m) and 1.4 GHz radio photometry together with new optical/mid-infrared-derived photometric redshifts from Simpson et al. (2013) to derive the far-infrared luminosities, characteristic dust temperatures, dust masses and investigate their evolution with redshift. In §2 we describe the observations and deblending techniques; in §3 we present the far-infrared properties (colours, luminosities, dust masses) of both individual ALESS SMGs and those of the stacks of subsets of population. We present our main conclusions in §4. Throughout the paper, we adopt a Chabrier IMF (Chabrier, 2003) and use a CDM cosmology (Spergel et al., 2007) with = 0.73, = 0.27, and = 72 km s-1 Mpc-1.
| ALL | S | S | |
|---|---|---|---|
| 25Jy | 25Jy | ||
| N | 99 | 46 | 53 |
| S70μm (mJy) | 0.45 (0.1) | 1.3 0.4 (0.1) | 1.3 (0.1) |
| S100μm (mJy) | 3.0 1.0 (0.1) | 3.9 1.4 (0.2) | 2.5 (0.2) |
| S160μm (mJy) | 9.7 1.4 (0.3) | 11.7 1.9 (0.4) | 8.0 1.8 (0.4) |
| S250μm (mJy) | 16.0 1.1 (0.4) | 19.3 1.5 (0.7) | 13.6 1.5 (0.5) |
| S350μm (mJy) | 20.6 1.2 (0.5) | 23.5 2.2 (0.8) | 19.2 1.5 (0.7) |
| S500μm (mJy) | 18.5 1.1 (0.8) | 20.4 1.2 (0.9) | 16.1 1.3 (0.8) |
| S870μm (mJy) | 4.0 0.3 (0.4) | 4.5 0.31 (0.4) | 3.6 0.37 (0.4) |
| S1.4GHz (Jy) | 13.8 2.4 (0.9) | 28.9 3.9 (1.3) | 4.1 2.4 (1.4) |
Notes: The errors are those on the bootstrap of the distribution. The error in parenthesis denoted the noise in the stacked map.
2 Observations & Analysis
2.1 ALMA
Details of the ALMA observations of the sub-millimeter sources from the ALMA LESS (ALESS) survey are described in Hodge et al. (2013) (see also Karim et al., 2013). Briefly, observations of 122 of the 126 LESS sources were obtained with ALMA in Cycle 0 at 345 GHz (Band 7) with a dual polarisation setup in the compact configuration (yielding a synthesised beam of 1.61.2′′). The ALMA primary beam, 17.3′′ FWHM at our observing frequency, is sufficient to encompass the error-circles of the sub-millimeter sources from the LESS maps, 5′′ (Weiß et al., 2009). The observations employed 12–15 antennae and were obtained between 2011 October and 2011 November in good conditions, PWV 0.5 mm. Phase and bandpass calibration was based on J0403360, J0538440 respectively and flux calibration performed on available planets at the time of observation. The data were processed with the Common Astronomy Software Application (casa; McMullin et al. 2007). The resulting velocity integrated continuum maps reach typical noise levels of = 0.4–0.5 mJy beam-1, a factor 3 more sensitive than the original LABOCA discovery map and, critically, with a beam that is 200 smaller in area than that of LABOCA.
From the ALMA maps, Hodge et al. (2013) extract 99 SMGs with S / N3.5 from the best maps (noise 0.6 mJy and synthesised beam with axial ratio 2). This selection provides an acceptable trade off between source reliability and spurious sources. Indeed, using the background fluctuations in the map, Karim et al. (2013) demonstrate that we expect only one SMG in the catalog to be spurious and one SMG to be missed. We note that Hodge et al. (2013) also provide a catalog of a further 32 ALMA SMGs which are from either the shallower maps (noise levels 0.6–1.0 mJy), or 4 sources within 2 the primary beam of the best maps, but these “supplementary” catalogs are expected to have lower completeness and a higher spurious fraction and so conservatively we do not use these sources in our analysis here.
2.2 1.4 GHz VLA Radio & 24 m Spitzer Imaging
The ECDFS was observed with the JVLA in D, C, B and A configurations in 2007 June to September, reaching an r.m.s. of = 8.3 Jy with a synthesised beam of 2.8′′ 1.6′′. These data and catalogs are described in detail in Miller et al. (2013) (see also Biggs et al., 2011).
Spitzer / MIPS 24 m imaging is also available for the ECDFS as part of the Far-Infrared Deep Extra-galactic Legacy (FIDEL) survey. This MIPS 24 m imaging provides an important addition in the construction of a positional prior catalog which is used to deblend the Herschel images (see § 2.3.1) as well as providing a constraint used in the far-infrared SEDs of the ALMA SMGs. We obtained the reduced MIPS 24 m images of the ECDFS from the NASA Infrared Astronomy Archive 777http://irsa.ipac.caltech.edu/data/SPITZER/FIDEL/. This imaging covers the entire ECDFS survey area, and we extract a catalog of 3600 sources in the ECDFS down to a 5- depth of 56 Jy (aperture corrected).
2.3 Herschel / PACS and SPIRE Imaging
Herschel / PACS observations covering the ECDFS at 100 and 160 m and the CDFS at 70, 100 and 160 m were taken as part of the PACS Evolutionary Probe (PEP) survey (the CDFS lies in the central 0.11-square degrees of the ECDFS). These data and deblended catalogs are described in Lutz et al. (2011) and Magnelli et al. (2013) and reach 1- sensitivities of 0.2–0.4 mJy (CDFS) and 1–2.6 mJy (ECDFS). We match our ALESS catalog with those from Magnelli et al. (2013) (with a matching radius of 1.5′′) and include the 70–160 m photometry for the ALESS SMGs from the CDFS and the ECDFS wherever possible in our analysis below.
Herschel / SPIRE 250, 350 and 500m observations covering ECDFS were taken as part of the Herschel Multi-tiered Extra-galactic Survey (HerMES) guaranteed time program (as described in Oliver et al. 2012). In total, ECDFS was observed for 32.4 ks at 250, 350 and 500 m in 1.8 ks blocks. For each observation, we retrieved the Level 2 data product from the Herschel ESA archive and aligned and co-added the maps. The final combined maps reach a 1- noise level of 1.6, 1.3 and 1.9 mJy at 250, 350 and 500 m respectively (see Oliver et al., 2012, for a detailed description of the observations).
To align the SPIRE maps to the ALMA and radio astrometry, we aligned the SPIRE maps at 250, 350 and 500m on the VLA radio positions, identifying and applying shifts of 1.5′′ in all cases.
2.3.1 Deblending SPIRE maps
Owing to the coarse beam size in the SPIRE maps, to measure reliable far-infrared flux densities for individual galaxies we need to deblend the SPIRE photometry for the effects of confusion. We therefore exploit the extensive multi-wavelength imaging of ECDFS to construct a catalog of infrared- and radio-bright galaxies which can be used as positional priors to deblend the SPIRE maps. First, we combine the 5- MIPS 24 m and radio catalogs, removing any sources within 1.5 ′′ as duplicates (in this case, we remove the lower signal-to-noise of the pair). The 1.5′′ offset we apply represents an acceptable trade off between the resolution of the radio map and centering precision of the 24 m data for a 5- source. We then add the positions of the 99 ALMA SMGs to this catalog, again matching any 24 m or radio sources which lie within 1.5 ′′ (the approximate resolution of the ALMA data) of the ALESS SMG as the same ID.
To deblend the SPIRE map we develop a Monte Carlo algorithm. At any given position in the field, we extract a thumbnail which has an extent 2.5 the FWHM of the beam at that wavelength. We then generate a new (blank) image and for each galaxy in the positional prior catalog which lies within this area assign a random flux densities (which lies between between zero and 1.3 the maximum flux density of galaxies within the thumbnail). We then convolve this image with the relevant SPIRE point spread function (PSF) and record the amplitude of the residuals and . From an initial set of 1000 models, we identify the best-fit model (lowest ). We then repeat this process, creating a new set of images with perturbed flux densities for each galaxy according to the FWHM of the flux density distribution from the previous set of models. This process repeats until all of the models in a given iteration are within a = 1 of the best-fit. Throughout this process, we record the flux density distribution and of every model attempted.
To ensure we do not “over deblend” the maps at longer wavelengths where the PSF is larger, we follow Elbaz et al. (2011) and when deblending the 350m image, we only include sources detected at 2 at 250m as positional priors in the 350m image (and similarly, for the 500m we only include sources 2 at 350m).
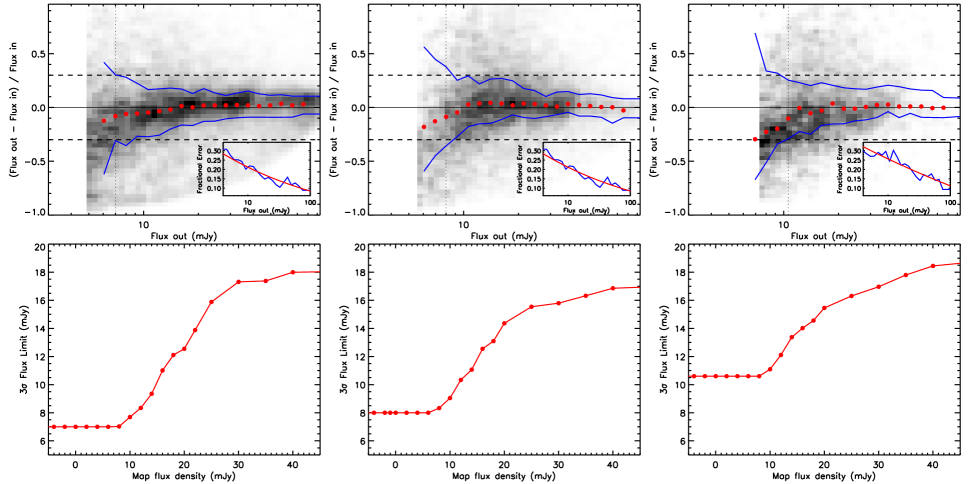
Before constructing a catalog, we must estimate both flux density errors and upper limits for non-detections. First, we determine the detection limit by attempting to recover fake point sources which have been randomly injected into the map (and positional prior catalog). In total, we inject 10,000 point sources into each of the 250, 350 and 500m maps (one at a time) with fluxes between 0.5 and 100 mJy and record the input () and recovered () flux density of the galaxy after deblending. In Fig. 2 we plot the fractional flux density error ((-)/) as a function of at each wavelength and contour the central 68% of the distribution. Following Magnelli et al. (2013), we define the 3- detection limit when 68% of the distribution are recovered with a fractional error less than 30%. In the ECDFS we derive 3- detection limits of 7.0, 8.0 and 10.6 mJy at at 250, 350 and 500m respectively. These are similar to the faintest fluxes reported galaxies in the ECDFS using the XID deblending procedure by Roseboom et al. (2010) (who derive fluxes for their faintest galaxies 6.5, 8.5 and 8.0 mJy at 250, 350 and 500-m respectively; Casey et al. 2012). For galaxies which are detected above 3-, we also calculate the fractional flux density error according to the distributions shown in Fig. 2 and to be conservative, add this in quadrature to the errors derived from the family of acceptable models from the Monte-Carlo deblending.
For the galaxies which have flux densities below these limits, we calculate an upper limit. This upper limit depends on its location in the map. For example, a source that lies within the beam of a nearby, brighter source is more difficult to “detect” than an isolated source since the effective background has increased due to the emission from the nearby source and large PSF. We therefore measure the recovered flux density for all injected sources as a function of the local background in the map. Again, following Magnelli et al. (2013), we derive the upper limit by identifying where 80% of the injected sources have a recovered flux density within 50% of the input flux density. We show this distribution in Fig. 2 and use this distribution to assign upper limits for non-detections.
To validate the deblending (and errors), we simulate a set of SPIRE images using the SPIRE number counts and redshift distribution from Clements et al. (2010). We construct images at 250, 350 and 500 m over a 1-square degree region (and include sources down to flux density limits of 0.5 mJy) and convolve the map with the relevant PSF. We note that we have not included any clustering of the sources in this simple analysis. To this image we then add Gaussian noise at the same level as the SPIRE observations of the ECDFS. To construct the positional prior distribution in a comparable way to our ECDFS data, we predict the 24 m flux density for each source injected into the fake map using its redshift and 250 m flux density and using an far-infrared SED randomly selected from the templates of Chary & Elbaz (2001). We then construct a positional prior catalog for all sources brighter than = 50 Jy and attempt to recover the sources using our algorithm. Using this method, the ratio of the input flux density to that recovered at 250, 350 and 500 m is / = 0.96 0.02, 0.97 0.02 and 1.17 0.12 respectively.
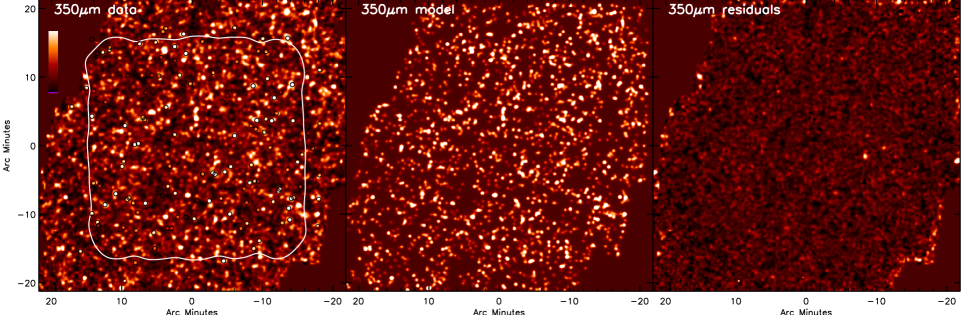
Having validated our approach, next we apply this algorithm to the ECDFS at 250, 350 and 500m, running the code in a grid of (overlapping) regions in ECDFS, each of extent 5 beams at the relevant wavelength. In Fig. 1 we show the 350m SPIRE map, with the positions of the LESS SMGs from Weiß et al. 2009 highlighted, as well as the best-fit 350m model of the field and the residuals 111The SPIRE 250, 350 and 500m images, best fit models, residual maps, and deblended catalog for all galaxies in our prior catalog in the ECDFS (as well as the COSMOS, UDS and GOODS-North regions which we also use to validate our fluxes and errors compared to Casey et al. 2012) are available at: http://astro.dur.ac.uk/ams/HSODeblend/.
From the deblended catalog, we then extract the SPIRE photometry for the ALESS SMGs and give these in Table A1. In Fig. 11 we show example thumb-nails around four ALESS SMG in our sample, the best-fit models and residuals at 250, 350 and 500m (these four galaxies are randomly selected to span the full range of 870m flux density from LESS; Weiß et al. 2009). In each panel we show the positions of all of the galaxies in the “prior” catalog at that wavelength and also highlight the positions of the ALESS SMGs. The far infrared photometry of the ALESS SMGs (from 24m to 1.4 GHz) is given in Table A1. In cases where no flux is detected, we quote 3- upper limits.
As a final check, we compare the flux densities derived for the galaxies in our prior catalog with those recently published by Casey et al. (2012) (which are based on the “XID” deblending procedures from Roseboom et al. 2010). Casey et al. (2012) report deblended 250, 350 and 500m flux densities and spectroscopic redshifts for a sample of 750 24m- and 1.4 GHz-detected galaxies with SPIRE counterparts in the COSMOS, ECDFS, GOODS-N and Lockman Hole regions. We cross correlate our deblended catalog with the Casey et al. (2012) catalog (including our own deblended maps of the COSMOS, ECDFS and GOODS-N fields to improve the number of matches between samples) and derive comparable flux densities at all three SPIRE wavelengths, with - ) / = 0.03 0.02, 0.08 0.04 and 0.08 0.10 at = 250, 350 and 500m respectively. This suggests that the “XID” and our deblending produce consistent flux densities to 10% accuracy.
3 Results & Discussion
3.1 Average far-infrared colours of SMGs
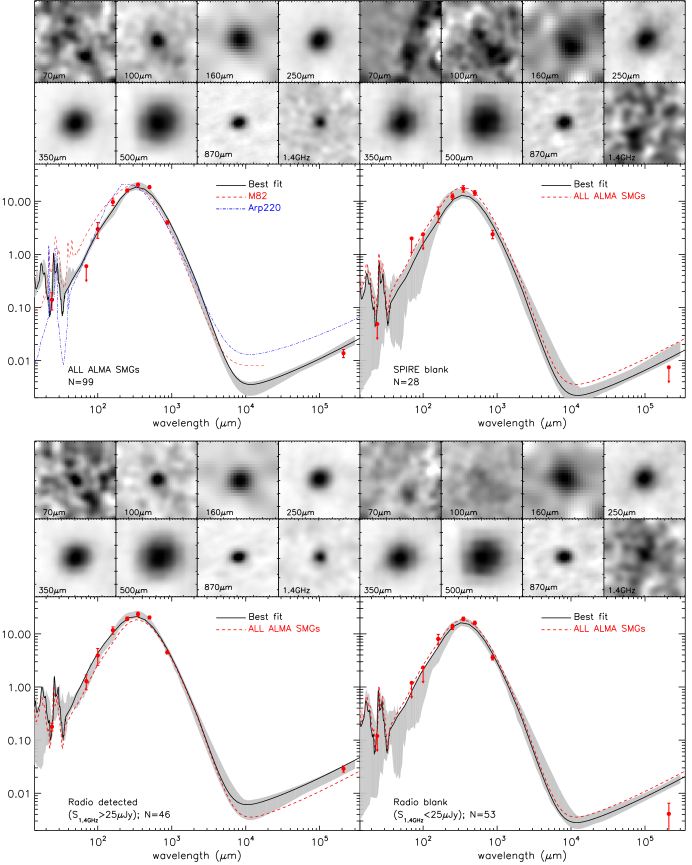
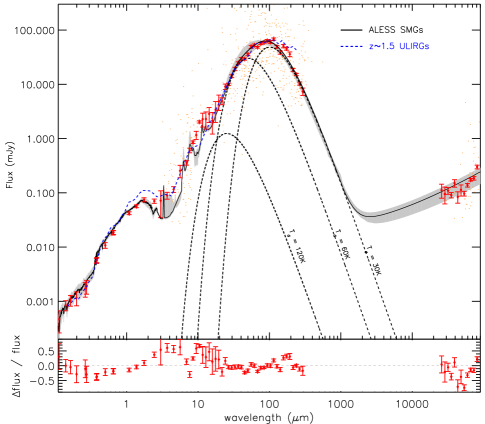
Before discussing the far-infrared colours of individual ALESS SMGs, we first investigate the average properties of the galaxies in our sample by stacking the multi-wavelength photometry in the “raw” (non-deblended) maps. In the PACS and SPIRE maps, we first subtract the mean flux of 1000 random positions in the map, effectively removing any systematic contribution from the background or confusion. We then stack the far-infrared and radio maps at the positions of the 99 ALESS SMGs and show these results in Fig. 3 and report the average flux densities in Table 1. For the entire sample of 99 ALESS SMGs in the main catalog, the composite SED peaks at 350m with flux density ratios of / = 0.8 0.1 and / = 1.1 0.1, as expected for a starburst galaxy with a dust SED with characteristic dust temperature 30 K redshifted to 2.
To derive the far-infrared properties of this composite dust SED, we construct a library of local galaxy templates from Chary & Elbaz (2001); Rieke et al. (2009) and Draine et al. (2007) and also add the SEDs of the well studied high-redshift starbursts SMM J21350102 ( = 2.32) and GN 20 ( = 4.05) from Ivison et al. (2010) and Carilli et al. (2011) respectively which can then be fit to the far-infrared photometry. This library comprises a total of 185 templates with a range of characteristic dust temperatures (measured from the wavelength of the peak of the far-infrared SED and assuming = 2.897 10-3m.K) from = 20–60 K (this complilation of templates is available at the same url as the deblended catalogs).
We fit these template SEDs to the 24 m–1.4 GHz photometry of the composite SED using a minimisation, allowing the normalisation and redshift of the templates to vary. In Fig 3 we overlay the best-fit (and also show the range of models which lie within 1- of the best fit).
A large fraction of the sub-mm sources identified in single dish observations lack radio (and / or 24m) counterparts, possibly as a result of the galaxies either lying at higher redshift or having colder-than-average dust temperatures. Until now, we have not known whether the unidentified SMGs have the same redshift distribution (or are representative) of the radio-identified subset. To provide a simple test of whether the individually radio-detected and radio-undetected subset show evidence for having different far-infrared colours (which may indicate a redshift bias if their SEDs are similar), we stack the radio-detected (46) and radio non-detected (53) subsets separately and also show these in Fig. 3 (see also Table 1). Both of these subsets peak at 350m, with statistically indistinguishable 350 / 250-m and 350 / 500-m colours. However, as can be seen from Fig. 3 and Table 1, the 70–100m flux densities for the radio non-detected stack are fainter than the radio-detected subset. For a fixed characteristic dust temperature, this may be consistent with the radio-faint subset of the ALESS SMGs lying at somewhat higher redshift. We will return to a discussion of this in § 3.3.
3.2 SMGs Redshifts and Rest-Frame Composite SED
Recently, Simpson et al. (2013) used the 16-band optical–mid-infrared photometric coverage of ECDFS to derive photometric redshifts for 77 of the 99 ALESS SMGs. They fitted SEDs to the 19-band (observed to IRAC 8.0m) photometry using hyper-z with the spectral templates of Bruzual & Charlot (2003) which use using solar metalicities and employ four SFHs; a single burst (B), constant star for- mation (C) and two exponentially decaying SFH’s with timescales of 1 Gyr (E) and 5 Gyr (Sb). To calibrate the redshifts, Simpson et al. (2013) derive photometric redshifts of 6000 spectroscopically confirmed gakaxies in the ECDFS, as well for spectroscopically confirmed ALESS SMGs (Danielson et al. in prep). Simpson et al. (2013) then use the relation between rest-frame -band magnitude and redshift for ALESS SMGs below = 2.5 to crudely estimate the redshifts for a further 19 ALESS SMGs which are faint (or undetected) in the optical / near-infrared, deriving a statistical redshift distribution for 96 ALESS SMGs (we note that two of the ALESS SMGs which are faint or blank in the optical/near-infrared have been confirmed to be = 4.4 through blind identification of [Cii]; Swinbank et al. 2012). The final three ALESS SMGs from the main catalog of Hodge et al. (2013) without photometric redshifts lie outside the MUSYC field and are only covered by IRAC, making it impossible to derive reliable photometric redshifts. Simpson et al. (2013) show that the redshift distribution of the 96 ALESS SMGs is centered at = 2.5 0.2 but with a tail out to 5, and with a typical uncertainty for any SMG of / (1 + ) = 0.15. The median absolute -band magnitude of the ALESS SMGs is = 24.33 0.15 which corresponds to a stellar mass of = (8 1) 1010 M⊙ (for an appropriate / ratio), consistent with previous estimates of the stellar masses of SMGs (e.g. Hainline et al., 2011)
Simpson et al. (2013) used these photometric redshifts to search for differences in the redshift distribution of radio-bright versus radio-faint ALESS SMG. For the radio-detected subset of the population, they derive a median of = 2.3 0.1 whilst for the radio-undetected subset, they derived = 3.0 0.3. Thus, it appears that radio-faint SMGs have a redshift distribution which peaks at slightly higher redshift than the radio-detected SMGs, as expected given the positive K-correction in the radio wavebands, even though the 250 / 350-m and 350 / 500-m colours are indistinguishable. This is discussed in detail in Simpson et al. (2013).
We use the photometric redshifts for the 96 ALESS SMGs to derive a rest-frame UV–radio composite SED for the whole sample. For each SMG, we de-redshift the wavelength and flux density measurements (and normalise each SMG by far-infrared luminosity) and then calculate a running median and show this in Fig. 4. To account for the errors on the SED at each wavelength, we bootstrap resample for both the photometric redshift and photometric errors. The best-fit template (and 1 error distribution) is also overlaid onto the SED in Fig. 4 which shows that the best-fit template peaks at = 90 5 m. In this plot, we also overlay the composite optical–far-infrared SED derived from a sample of 1.5 ULIRGs with luminosities = 1–3 1012 L⊙ identified in the COSMOS field from Lee et al. (2013). This composite SED is reasonably well matched to the ALESS SMG composite, although shows a factor 1.5–2 excess in the rest-frame near- and mid-infrared compared to the ALESS stack (which may be due to their sample being dominated by a 24m pre-selection). Nevertheless, in the rest-frame UV/optical and far-infrared, both SEDs are well matched, peaking between 90–100 m.
This well-sampled rest-frame composite SED can be used to
measure the average dust masses of the ALESS SMGs. The dust
mass is related to the far-infrared flux density by = () (1 + ), where is the flux density at frequency
; is the Planck function at temperature, T;
is the dust absorption coefficient; is
the total dust mass and is the luminosity distance. Our
sources are not perfect black bodies, but this is accounted for by the
dust mass coefficient, so that the grey-body is
effectively represented by the product and
the luminosity of the sources at frequency scales as
/ () . The dust mass is
then given by
= d /
( () (1 + )).
To characterise the rest-frame composite ALESS SED in Fig. 4, we fit three dust components; cold: = 20–30 K; warm: = 50–60 K; and hot = 80–120 K. The dust emissivity, is allowed to vary between = 1.5–2.0 (Magnelli et al., 2012a) (but is the forced to the same value for each component). From the best fit, we derive an average cold dust mass of = (4.1 0.6) 108 M⊙ (for a dust mass absorption coefficient of = 0.15 m2 kg-1; Weingartner & Draine 2001; Dunne et al. 2003) and a ratio of / = 30 8 and / 1500. The cold dust mass we derive from this composite is comparable to that derived for the spectroscopically confirmed SMGs, = (3.9 0.5) 108 M⊙ (Magnelli et al., 2012a). However, this composite SED is derived for all ALESS SMGs (over all photometric redshifts) and so to limit any broadening of the dust SED due to selecting different SEDs at different redshifts, we also limit the composite to the redshift range = 1.8–2.8. From this composite, we derive a cold dust mass of = (4.1 0.6) 108 M⊙ and a ratio of / = 43 15 and / 1000 – comparable to those derived from the composite SED of all ALESS SMGs.
3.3 Far-infrared properties of individual SMGs
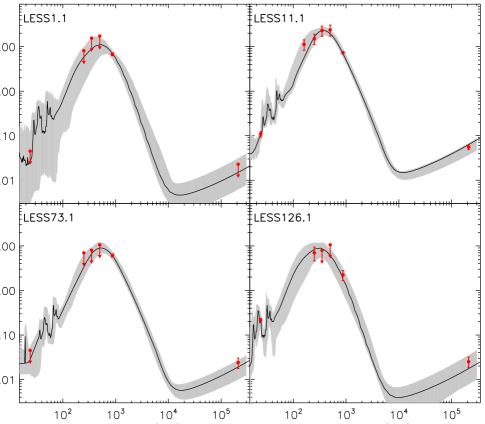
Next, we investigate the properties of individual ALESS SMGs from the deblended SPIRE maps. In Fig. 4 we show example SEDs for four of the ALESS SMGs in our sample (SEDs for all ALESS SMGs can be found in Fig. 12). In cases of non-detections, we show 3 upper limits. For each ALESS SMG, we fit the SED templates in our library to the photometry, allowing the redshift to vary according to the photometric redshift and its error, and also accounting for the uncertainty in the photometry. Using the best-fit dust SEDs, we calculate the infrared luminosity () by integrating the rest-frame SED between 8–1000m (rest-frame). The derived far-infrared luminosities (integrated between rest-frame 8–1000 m) and characteristic dust temperatures () of the best fit template from these fits are reported in Table 2 along with their photometric redshifts from Simpson et al. (2013). To facilitate a useful comparison with other surveys, we also fit the far-infrared photometry of each ALESS SMG with a modified black-body spectrum at the photometric redshift and derive the characteristic dust temperature from these fits. These dust temperatures are also reported in Table 2 and are those used in the analysis below.
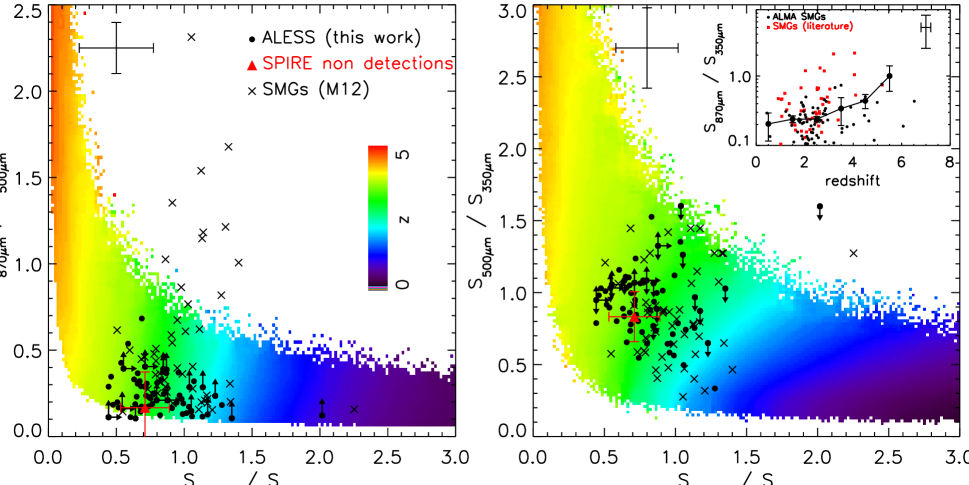
Following Ivison et al. (2012), in Fig. 5 we show the far-infrared (250 / 350 m versus 500 / 350 m and 870 / 500 m) colours of the ALESS SMGs (we only plot ALESS SMGs which are detected in at least two bands). For a comparison sample, we also include the far-infrared colours of SMGs with 250, 350 and 500m flux densities measured from Magnelli et al. (2012a). This colour-colour diagnostic is designed to crudely assess the redshift and characteristic dust temperature () of galaxies detected by Herschel, probing their colours across the rest-frame 100m SED peak.
To assess whether these colours are consistent with those expected for dusty high-redshift galaxies, we also show as a colour scale the expected far-infrared colours derived from 106 grey body curves with a range of redshifts from = 0–6, characteristic dust temperatures of = 15–60 K and dust emissivity = 1.0–2.5 (we include scatter in these photometry which match the typical photometric errors in our analysis). The location of the ALESS SMGs in Fig. 5 demonstrates that their dust SEDs are consistent with a population of galaxies at 2–4, and we note that there are 12, 32 and 12 ALESS SMGs whose dust SEDs peak closest to 250, 350 and 500 m respectively (these are for those galaxies which are individually detected in at least two SPIRE bands). However, due to the dust-temperature–redshift degeneracy, there is significant scatter between the far-infrared colours and photometric redshift. Indeed, as also shown in Fig. 5 the relation between 870 / 350 -m colour as a function of photometric redshift for the ALESS SMGs (and also including the far-infrared colours of the spectroscopically confirmed SMGs from Magnelli et al. 2012a), there is approximately 1 of scatter for a fixed 870 / 350 -m colour.
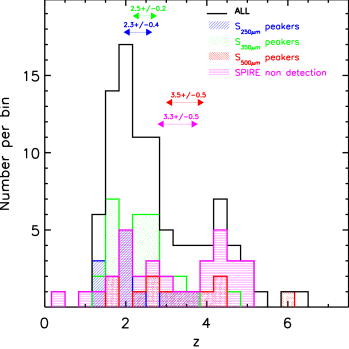
In Fig. 6 we show the photometric redshift distribution for ALESS SMGs, split by their far-infrared colours. Crudely, for a fixed temperature, the dust SEDs for the SMGs which peak at shorter wavelengths should lie at the lower redshifts, whilst those which peak at the longer wavelengths should lie at the highest redshifts. As Fig. 6 shows, this is broadly consistent with our data; the dust SEDs of the ALESS SMGs which peak closest to 250, 350 and 500m peak at = 2.3 0.2, 2.5 0.3 and 3.5 0.5 respectively. Formally, a two-sided KS test suggests a 63% chance the the 250-m and 350-m peakers are drawn from the same distribution, but only a 2.3% [1.8%] chance that the 350-m and 500-m [250-m and 500-m] peakers are drawn from the same population.
Finally, we note that there are 34 (out of 99) ALESS SMGs which do not have a 3 counterpart at 250, 350 or 500m. Of these 34 galaxies, 30 are also radio unidentified, and it is interesting to note that the median photometric redshift for these SPIRE and radio non-detections is higher than the full ALESS SMG sample, with = 3.3 0.5 (c.f. = 2.5 0.2; Simpson et al. 2013; Fig. 6). However, stacking the SPIRE maps of these “SPIRE undetected” ALESS SMGs (Fig. 4) yields far-infrared colours which peak at 350m with 250, 350 and 500m flux densities of = 9.0 0.4 mJy, = 9.5 0.5 mJy and = 6.5 1.2 mJy (Fig. 5). Moreover, the median 870m flux density of this “SPIRE undetected” subset is = 2.4 0.4 mJy, (c.f. = 3.4 0.3 mJy for the full ALESS SMG sample). Thus, these ALESS SMGs which are undetected in the SPIRE maps appear to represent a combination of the slightly fainter and higher redshift subset of the ALESS SMGs, but with comparable dust temperatures. Of course, this result may partially due to our method of deblending in which we require a galaxy be detected at 250-m to be included in the 350-m positional prior catalog (and a 350-m to be included in the 500-m positional prior catalog) which may bias against galaxies that are faint at 250-m and peak at longer wavelengths. However, we note that only two ALESS SMGs, ALESS 80.1 and ALESS 80.2 ( = 1.4 and 2.0 respectively) have significant flux ( 8 mJy at 350-m and 500-m) in the residual map, and therefore it does not appear that we have missed a significant fraction of ALESS SMGs in the SPIRE deblending which would bias this result.
For each ALESS SMG, we also calculate the cold dust mass using the rest-frame 870m luminosity from the best-fit template and give these in Table 2. The median dust mass for all of the SMGs in our sample is = (3.6 0.3) 108 M⊙, which is comparable to the average dust mass derived by Magnelli et al. (2012a) for a spectroscopic sample of SMGs, = (3.9 0.5) 108 M⊙.
4 Discussion
4.1 Far-Infrared Luminosities & Star Formation Rates
The median infrared luminosity for the ALESS SMGs is = (3.0 0.3) 1012 (corresponding to a star formation rate of SFR = 310 30 yr-1 for a Chabrier IMF) with a range of = 0.2–10 1012 (SFR = 20–1030 M⊙ yr-1). This is a factor 1.8 lower than that derived for 78 spectroscopically confirmed SMGs from Chapman et al. (2005) (also derived using SPIRE photometry to constrain the dust SEDs; SFR = 500 66 M⊙ yr-1 and for the same stellar IMF; Magnelli et al. 2012a). However, this is mainly driven by the high multiplicity of SMGs due to unresolved companions in the far-infrared photometry in the single dish survey. For example, Hodge et al. (2013) show that at least 35% (possibly up to 50%) of the LABOCA sub-mm sources are resolved by ALMA into multiple SMGs (see also Karim et al. 2013). If we instead limit the sample to ALESS SMGs whose flux is brighter than 4.2 mJy, then we derive an average star formation rate of SFR = 530 60 M⊙ yr-1.
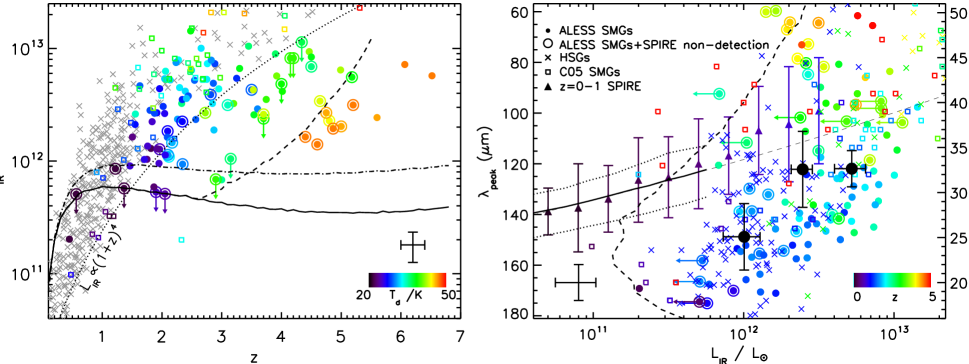
In Fig. 7 we plot the correlation between redshift and infrared luminosity for our sample. For comparison we overlay the SMGs and 24-m selected Herschel Star-forming Galaxies (HSGs) from Chapman et al. 2005 and Casey et al. 2012 respectively. To highlight the selection functions on this plot, we calculate the 870m flux density for a dust SED with characteristic dust temperature of = 32 K as a function of luminosity and redshift. In Fig. 7 the solid line denotes the selection limit for this dust SED with 2 mJy (the approximate 870m flux density limit of the ALESS SMG sample). However, given the apparent evolution in the luminosity–temperature plane (high-redshift ULIRGs tend to be systematically cooler than local ULIRGs at a fixed luminosity; Chapman et al. 2005; Kovács et al. 2006; Symeonidis et al. 2013), we also construct a set of dust SEDs across the redshift range = 0–8 with a range of far-infrared luminosities from LIR = 1010-14 L⊙ but require that the dust SEDs of higher redshift galaxies have cooler characteristic dust temperatures by / = 1.5 K at a fixed luminosity. We then measure the 870m flux densities of each dust SED and again only record those whose 870m emission is above = 2.0 mJy. We also use the same model to estimate the selection boundary for SMGs to be detected in at least two SPIRE bands above our limits (see § 2.3.1); we show this on Fig. 7. This final selection function highlights a steeply rising selection boundary above 3.5 beyond which galaxies are unlikely to be detected in at least two SPIRE bands. Nevertheless, this plot demonstrates that the ALESS SMGs apparently follow the same luminosity–redshift scaling ((1 + )4) as local samples, although the luminosities appear to significantly flatten on this relation above 2.5.
In Fig. 7 we also show the relation between the infrared luminosity and characteristic dust temperature for ALESS SMGs. In this plot, we use the characteristic dust temperature from the grey-body fits in order that a fair comparison can be made with other surveys. However, since the characteristic dust temperature is closely related to the wavelength of the peak of the dust SED, we label the axis with both dust temperature (Td) and corresponding peak wavelength (). In the plot, we also include measurements for SMGs from Magnelli et al. (2012a) as well as the Herschel Star-forming Galaxies (HSGs) from Casey et al. (2012) (which have a median redshift of 0.7), and the = 0–1 SPIRE-selected LIRGs and ULIRGs from Symeonidis et al. (2013) which appear to closely follow the 0.1 – correlated observed in the 1.2 Jy IRAS 60-m sample (Chapman et al. 2003a, see also Chapin et al. 2009). In this plot, we show a selection boundary (dashed line) that denotes the luminosity–temperature space required for an ALESS SMG with 2 mJy to be detected in at least two SPIRE bands (which as recently reiterated by Symeonidis et al. (2013), drives the apparent correlation between and redshift).
To test whether the ALESS SMGs have similar temperatures to local samples (at fixed luminosity), we divide the ALESS SMGs into three roughly equal number bins of and derive the average characteristic temperature of = 25 4, 33 2 and 33 1 K for = (1.0 0.1), (2.4 1.3) and (5.3 0.4) 1012 L⊙ respectively. As Fig. 7 shows, for a fixed luminosity, ALESS SMGs have cooler dust temperatures ( = 3–5 K) compared to that implied from the – relation from local 60-m IRAS galaxies (equivalently, the dust SEDs of the ALESS SMGs peak at 10–15m shorter wavelengths the local IRAS galaxies of comparable luminosity). This offset in (or ) at fixed for high-redshift ULIRGs has also been noted by Symeonidis et al. (2013) and may be attributed to the more extended gas and dust distributions and/or higher dust masses than local galaxies of similar luminosities.
4.2 Far-Infrared Luminosity Functions
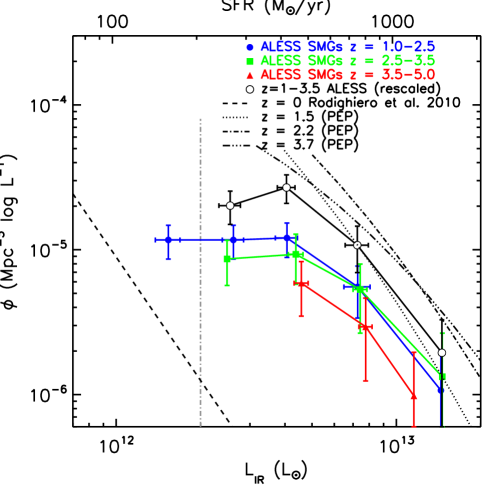
Since our ALMA survey was carried out on a complete sample of 870m-selected sources lying in a single field, we can use the volume probed by our observations to derive the far-infrared luminosity function of bright SMGs. To search for an evolution with redshift, we split the ALESS SMGs in to three bins of photometric redshift ( = 1.0–2.5; = 2.5–3.5 and = 3.5–5.0). To account for the flux limited nature of the LESS survey, we calculate the ALESS SMG luminosity function within an accessible volume using where is the number density of sources with luminosities between and + and is the co-moving volume within which the galaxy can be detected in each luminosity bin. Error-bars are calculated by bootstrapping accounting for the uncertainties in the photometric redshifts, luminosity and binning errors. In Fig. 8 we plot the bolometric luminosity function in these three redshift bins and compare the data to a low-redshift 24-m selected ( 0.3) sample from Rodighiero et al. (2010), and the 1.5, 2.2 and 3.7 infrared luminosity functions of 100 and 160-m selected galaxies from the PEP survey (Gruppioni et al., 2013). As Fig. 8 shows, at fixed luminosity, SMGs have a space density at least a factor 100 that of 24-m selected galaxies at 0.3 (Rodighiero et al., 2010).
Comparing the ALESS SMG space densities between redshifts, we also see that between = 1.5–2.5 and = 2.5–3.5, the ALESS SMG luminosity functions significantly overlap, although at a fixed luminosity, the higher redshift ALESS SMGs tend to have a lower space density (e.g. at a luminosity of 5 1012 L⊙, the space density of = 3.5–5.0 SMGs is 60% lower than at 2), implying that the volume density peaks at 2 and declines at higher redshift.
As noted by Weiß et al. (2009) (see also Wardlow et al. 2011), the ECDFS appears to be under-dense in 2 SMGs by a factor 2 compared to other sub-millimetre surveys at flux densities 3 mJy. To compare to other surveys, in Fig. 8 we therefore construct the luminosity function for ALESS SMGs over the redshift range = 1–3.5 (to match the redshift distribution of the Chapman et al. 2005 sample) and then rescale by increasing the number density by a factor 2 to match the 850m number counts from those in the SHADES (Coppin et al., 2006). This rescaled = 1–3.5 ALESS SMG luminosity function is well matched to the 2.2 luminosity functions of 100 and 160-m selected galaxies from the PEP survey (Gruppioni et al., 2013).
4.3 The contribution of SMGs to the co-moving star formation rate and stellar mass densities
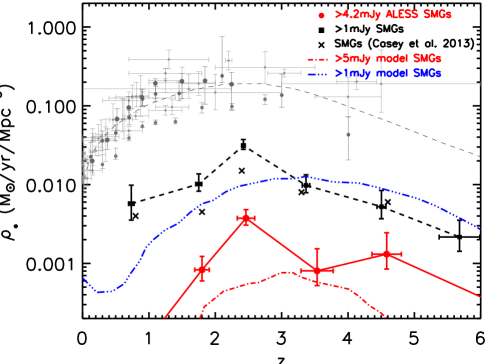
We use the star formation rates for the galaxies in our sample to measure the contribution of SMGs to the total star formation rate density as a function of redshift. When calculating the star formation rate density, we include all of the SMGs from the ALESS main catalog with 4.2 mJy (the flux limit of the original LESS survey), and account for the factor 2 under-density of SMGs in the ECDFS. As Fig. 9 shows, over the redshift range = 1–5, bright (S 4.2 mJy) account for 1–2% of the total star formation density (Hopkins & Beacom, 2006; Karim et al., 2011). However, we also need to account for the large fraction of the sub-millimeter galaxy population below our bright 4.2 mJy flux limit, by integrating down to 1 mJy. This flux represents the point at which the dust-obscured and unobscured star formation rates in galaxies are comparable and corresponds to an infrared luminosity of = 0.8 1012 L⊙ (SFR 80 M⊙ yr-1). We assume that the fainter SMGs ( = 1–4.2 mJy) have the same underlying redshift distribution and luminosity evolution as the bright SMGs ( 4.2 mJy) and find that the number density of SMGs with 870m fluxes brighter than 1 mJy SMGs is 7 that of those brighter than 4.2 mJy (Coppin et al., 2006). Accounting for the errors in the photometric redshifts of the ALESS SMGs, and applying this correction to the number counts, in Fig. 9 we also show the contribution to the comoving star formation rate density from 1 mJy SMGs. This shows that SMGs contribute 20% of the total star formation over the redshift range = 1–5. Of course, we note that this estimate should be considered a lower limits as we have not included ULIRGs which have comparable luminosities as the SMGs, but with hotter than average dust temperatures which makes them fainter at 870m, dropping them below the LESS flux limit. The contribution to the star formation density from these optical faint radio galaxies; OFRGs, (Casey et al., 2009) may increase the contribution to the star formation rate density for ULIRGs by a factor 2 compared to the 870m-only selection we consider here.
Next, we compare these results to the semi-analytic galaxy formation model from Baugh et al. (2005) (see also Swinbank et al., 2008; González et al., 2012). This model has the advantage that it is both cosmologically based, and is required to fit the = 0 -band luminosity function, IRAS 60m number counts and galaxy bulge-to-disk ratios. In this model, the SMGs are dominated by bursts of star formation as a result of major mergers, with the brightest SMGs ( 5 mJy) accounting for 1% of the total star formation density at = 2–4. Integrating all sources with 1 mJy this model also predicts that the fainter SMGs account for 20–30% of the total star formation density at these redshifts (González et al., 2012). Although the use of a top heavy ( = 0) IMF in the model complicates this comparison, Fig. 9 shows that the galform model appears to provide a reasonable description of the ALESS data over the redshift range 1–5.
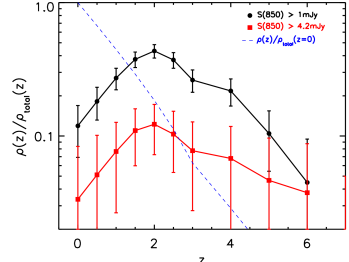
Since the integral of the star formation history provides the total stellar mass formed in a galaxy, we also measure the fraction of stellar mass in SMGs compared to the total stellar mass density (as a function of redshift). We follow Guo et al. (2012) and obtain the global stellar mass density as a function of redshift by fitting a linear relation to the evolution of the stellar mass density from Fig. 12 of Marchesini et al. (2010). Assuming the SMGs have a burst duration of 250 Myr, we calculate the duty cycle as a function of redshift to infer the total stellar mass formed by SMGs (we note that the burst duration and duty cycle correction approximately trade off against each other if the burst duration does not depend on redshift) and in Fig. 9 we plot the fraction of stellar mass formed in SMGs compared to the total stellar mass density as a function of redshift for all ALESS SMGs with 4.2 mJy (again accounting for the factor 2 under-density of the ECDFS). In this plot, we use the stellar masses for the ALESS SMGs derived by Simpson et al. (2013), which have been estimated by integrating the star formation histories and accounting for the mass loss due to winds and supernovae. This plot shows that at 2–3, the bright SMGs ( 4.2 mJy) contribute 15% of the total stellar mass density at this epoch. In contrast, by = 0 this plot suggests that the total stellar mass formed in bright SMGs comprises just 3–4% of the total stellar mass density. As above, if we integrate the counts to 1 mJy, then as Fig. 9 shows, SMGs account for 30–40% of the total stellar mass at 2, and 15% of the total stellar mass density at = 0.
4.4 Dust and Gas Mass Functions
Exploiting the correlation between the dust and gas mass in local galaxies, we can also use the mass ratio of the gas-to-dust to infer the total H2 mass in SMGs. There has been considerable interest in deriving the cold molecular gas masses in SMGs, since this provides the raw “fuel” for star formation which determines the duration of the starburst. Most of the constraints on the gas masses have been derived from low- and mid- 12CO observations and then have to adopt CO–H2 conversion factor (e.g. Frayer et al., 1998; Greve et al., 2005; Tacconi et al., 2006, 2008; Ivison et al., 2011; Riechers et al., 2011; Bothwell et al., 2013). In particular, Bothwell et al. (2013) used 3 Ms of low spatial resolution observations with PdBI to derive the low- 12CO properties of a sample 40 luminous SMGs (detecting 32 of them). Constraining the molecular gas properties of a larger sample of SMGs, even with ALMA, will therefore require a significant investment of time. An alternative approach to estimate the gas mass is to use the (optically thin) continuum luminosity on the Rayligh-Jeans tail of the dust SED to estimate the dust mass, and then use an appropriate gas-to-dust ratio to derive the total mass of the molecular ISM. A detailed discussion of this technique and its application to both local and high-redshift galaxies is given in Scoville (2013) review.
To estimate an appropriate gas-to-dust mass ratio () for SMGs, we exploit the CO-derived H2 masses from Bothwell et al. (2013) who derive = 3.6 1.0 1010 M⊙ (including non-detections). Using far-infrared and radio photometry (from 70–870 and 1.4 GHz), Magnelli et al. (2012a) fit the far-infrared SEDs of many of the same galaxies to derive dust masses of = (3.9 0.5) 108 , suggesting an average gas-to-dust ratio of = 90 25. For comparison, we note that the Milky-Way has a gas-to-dust ratio of 130; Jenkins 2004, whilst the gas-to-dust ratio derived for the local of star forming galaxies (across several galaxy types) from the SINGS survey from Draine et al. (2007) (see also Scoville, 2013) is = 130 20 for galaxies with metallicities above / 0.2 (which is likely to represent a lower-limit for SMGs; Swinbank et al. 2004; Takata et al. 2006).
It is also possible to derive a gas-to-dust ratio for the ALESS SMGs using the stellar mass, star formation rate and metallicity (). For example, Maiolino et al. (2008) suggest a mass-metallicity-star formation rate plane of = 8.90 0.47 with = log(M⋆) 0.32 log(SFR) 10. The gas-to-dust ratio can then be calculated by = 10 (Magnelli et al., 2012b). Using the star formation rate and stellar mass for the ALESS SMGs in our sample (Simpson et al. 2013), the average gas-to-dust ratio we derive is = 75 10. This is lower, but consistent within the 1- error of that derived from the (more direct) 12CO and dust masses, although we caution that the significant uncertainty in the stellar mass estimates for SMGs due to the unconstrained star formation histories may dominate the difference in (Simpson et al. 2013). For simplicity, in all of the following analysis, we therefore adopt a single gas-to-dust ratio of = 90 25.
Applying this gas-to-dust ratio to our estimates of the dust mass, this suggests a median H2 mass of = (4.2 0.4) 1010 M⊙ for the ALESS SMGs. Together the average star formation rate and total H2 mass of the SMGs suggest a gas depletion time-scale of / SFR 130 15 Myr. Assuming, on average that the burst is observed half way through its lifetime and that the star formation remains constant over the lifetime of the burst (with no recycling of mass through supernovae or other mass loss), this suggests a total burst duration in SMGs of 250 Myr (see also Greve et al., 2005; Hainline et al., 2006; Tacconi et al., 2006; Swinbank et al., 2006; Riechers et al., 2011; Ivison et al., 2011; Hickox et al., 2012; Bothwell et al., 2013), and a factor 3 longer than local ULIRGs of comparable luminosity (e.g. Solomon & Sage, 1988; Gao & Solomon, 2004; Genzel et al., 2010).
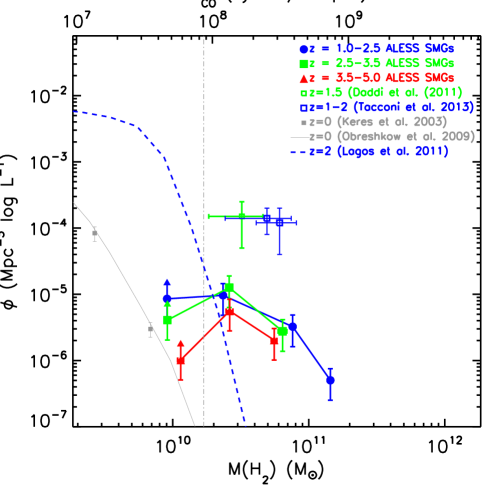
In Fig. 8 we plot the H2 mass function for the bright ( 4.2 mJy) ALESS SMGs (in units of / M⊙ and Jy km s-1 Mpc2). We also include on the plot the gas mass density of “main-sequence” starburst galaxies (BzKs and BX/BMs) from Daddi et al. (2010) and Tacconi et al. (2010). Here, we have assumed that the six galaxies observed by Daddi et al. (2010) are representative of all star-forming BzK galaxies (although we caution that the BzKs in Daddi et al. are the most luminous sub-sample of the BzK population and so may be atypical). Nevertheless, we adopt a space density of = (1.5 1.0) 10-4 Mpc-3 based on the average BzK space density (Daddi et al., 2005). Recently, Tacconi et al. (2012) observed a much larger sample of massive, main-sequence star-forming galaxies as part of the PHIBSS survey, presenting detections of 52 star-forming galaxies between = 1–1.5 and = 2.0–2.5. These galaxies are selected from a parent catalog of spectroscopically confirmed galaxies with star formation rates 30 M⊙ yr-1 and stellar masses of M 2.5 1011 M⊙ and have gas masses of = (5.5 1.8) 1010 M⊙ (c.f. = 4.2 0.4 1010 M⊙ for the ALESS SMGs). To estimate the space density of the parent population at these limits, we use the Bower et al. (2006) galaxy formation model (which has been shown to provide a reasonable match to the high-redshift stellar mass functions and star formation rates of galaxies). For the PHIBSS selection limits of SFR 30 M⊙ yr-1, M 2.5 1010 M⊙ and assuming a median reddenning of AV = 0.75 for these systems (Förster Schreiber et al., 2009), the Bower et al. (2006) model suggests space densities for the parent populations of = 1.4 0.6 Mpc-3 and = 1.2 0.5 Mpc-3. Thus, the space densities of the PHIBSS galaxies and BzKs appear to be a factor 8–10 higher than the ALESS SMGs, but with comparable gas masses (Fig. 8).
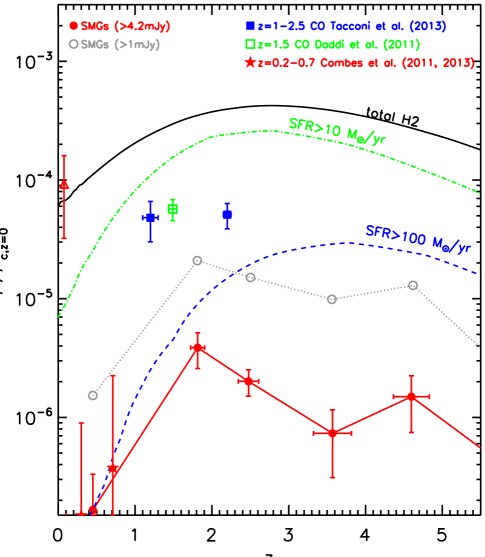
In Fig. 10 we use the gas mass estimates for these samples to investigate the total H2 contained in star-forming galaxies as a fraction of the total H2 as a function of redshift. As above, we calculate the total gas density as a function of redshift contributed by the bright ALESS SMGs ( 4.2 mJy), and also extrapolating to fainter limits ( 1 mJy) using the sub-mm counts from Coppin et al. (2006). Of course, we caution that extrapolating to 1 mJy assumes that the gas masses scale with the 870m flux, although the strong correlation between CO, dust mass and far-infrared luminosity (e.g. Bothwell et al., 2013) implies that this assumption is not unreasonable.
To compare these results to other populations, we employ the = 0 data from Kereš et al. (2005), who derived a total molecular gas content at = 0 is / = % (where = 3 / (8)). For comparison samples at intermediate redshift, we exploit the observations of 36 0.2–0.6 and 39 0.6–1.0 ULIRGs from Combes et al. (2011, 2013) who derive gas masses from spectroscopy of 37 these galaxies using low- CO emission. To estimate density of the parent population of these intermediate redshift ULIRGs (which includes optically bright and spectroscopically confirmed galaxies with 2.8 1012 ; above the 60m IRAS or 70m MIPS detection limits and 12∘) using the the semi-analytic galform model from Baugh et al. (2005). The space density of ULIRGs with these flux limits should be 1.5 10-7 Mpc-3 and 7.5 10-7 Mpc-3 for the 0.6–1.0 and 0.2–0.6 populations respectively. However, we caution that given the complex selection function and large correction factors required in this calculation, we conservatively adopt errors on the space density for this sample of at least a factor 4 at both redshifts.
We also plot the theoretical contribution of galaxies to the total H2 density as a function of total star formation rate and redshift using the semi-analytic models of Lagos et al. (2011, 2013) which is based on the semi-analytic model of Baugh et al. (2005) and Bower et al. (2006). As Fig. 10 shows, at 2 the bright ( 4.2 mJy) ALESS SMGs contain 1% of the total predicted H2 density at = 1–3, although extrapolating to galaxies with 1 mJy this rises to 5%. In contrast, the star-forming BzKs and BX/BM galaxies (which have typical star formation rates 80 M⊙ yr-1) contain 10–15% of the predicted total H2 gas budget at 1–2. To provide a more detailed comparison of the contribution of galaxies with different star formation rates, we also overlay the predictions from the model for galaxies with star formation rates 100 yr-1 and SFR = 10 yr-1. This model provides a reasonable description of the data: model galaxies with star formation rates SFR 100 M⊙ yr-1 (which is comparable to a limit of 1 mJy), should contribute 5–10% of the total at 2, falling sharply to 0.1% by = 1.
5 Conclusions
We have exploited the multi-wavelength imaging of the ECDFS to investigate the far-infrared properties of a sample of 99 high-redshift, ALMA-detected sub-millimeter galaxies. These galaxies are precisely located from high-resolution ( 1.4′′) 345 GHz imaging, allowing us to measure the multi-wavelength properties of the counterparts without recourse to statistical associations. Moreover, the sensitivity of the ALMA data also allow us to derive the properties of SMGs to fainter sub-mm fluxes than typically possible in single dish observations. Our main findings are:
Stacking the far-infrared imaging at the positions of the ALESS SMGs, we show that their observed far-infrared SEDs peak close to 350-m, as expected for a high-redshift galaxy population whose dust temperatures are around 30 K. The SPIRE colours of the individually radio-detected versus radio non-detected subset of the ALESS SMGs are not statistically distinguishable. However, when including the shorter wavelength PACS data, the SEDs of the radio-detected SMGs appear to peak at shorter wavelengths compared to those SMGs which are radio non-detected. For a fixed characteristic dust temperature, this is consistent with the radio-faint subset of the ALESS SMGs lying at higher redshift, as also confirmed by their photometric redshifts.
By deblending the SPIRE 250, 350 and 500m images of the ECDFS based on a 24m, radio and ALMA positional prior catalog we find that 34 (out of 99) ALESS SMGs do not have a 3 counterpart at 250, 350 or 500m. Of these 34 galaxies, 30 are also radio-undetected. These SPIRE non-detections have a median photometric redshift of = 3.3 0.5 which is higher than the full ALESS SMG sample ( = 2.5 0.2; Simpson et al. 2013). The median photometric redshift for ALESS SMGs which are detected in at least two SPIRE bands and whose observed dust SEDs peak at 250, 350 or 500m are = 2.3 0.2, 2.5 0.3 and 3.5 0.5 respectively.
We fit the far-infrared SEDs of the SMGs with a suite of dust templates to derive the far-infrared luminosity and hence star formation rate and characteristic dust temperature. We derive a median star formation rate for the SMGs in our sample of SFR = 330 30 M⊙ yr-1 with a range of SFR = 20–1030 M⊙ yr-1. Concentrating on those ALESS SMGs whose fluxes are brighter than 4.2 mJy (the flux limit of the LESS survey; Weiß et al. 2009), we derive a median star formation rate of SFR = 530 60 M⊙ yr-1.
Accounting for the apparent under-density of bright SMGs in ECDFS, we show that the contribution of ALESS SMGs with 4.2 mJy) to the co-moving star formation rate density across the redshift range 1–4 is 1–2% of the total. Integrating the 870m counts down to 1 mJy (the flux corresponding to the luminosity where the contributions from the far-infrared and UV to the bolometric output of galaxies typically balance) then 870m-selected SMGs should account for 20% of the total star formation across the same redshift range.
By integrating the star formation histories of the SMGs in our sample (and accounting for mass loss due to winds and supernovae), we show that bright SMGs ( 4.2 mJy) contribute 15% of the total stellar mass density at 2. Extrapolating to a flux limit of 1 mJy, SMGs account for 30–40% of the total stellar mass density at 2 and 15% of the total stellar mass at = 0.
Using the rest-frame 870-m luminosities of the ALESS SMGs, we infer an average dust masses of = (3.6 0.3) 108 M⊙. Adopting a gas-to-dust ratio of / = 90 25, this suggests a typical cold gas mass of (4.2 0.4) 1010 M⊙. Together the average star formation rate and total H2 mass of the SMGs suggest gas depletion time-scales of / SFR = 130 15 Myr.
Finally, we use our estimates of the H2 mass to investigate the contribution of star-forming galaxies to the cosmic H2 density as a function of redshift. At 2 the bright ( 4.2 mJy) SMGs contain 1% of the total H2, although extrapolating to 1mJy this rises to 5%. We show that this is consistent with the latest theoretical models which predict that galaxies with star formation rates SFR 100 M⊙ yr-1, should contribute 5–10% of the total at 2, falling sharply to 0.1% by = 1.
We have presented an analysis of the far-infrared and radio properties of an unbiased sample of 870m-selected SMGs in the ECDFS whose positions have been precisely measured with ALMA. We show that the SMGs in our sample have typical star formation rates of SFR = 310 30 yr-1 and by integrating the counts to a flux limit of 1 mJy, we show that SMGs can account for 20% of the co-moving star formation density at 1–5 and estimate that these systems contain 10% of the total molecular gas budget at this epoch. In a future paper, we will combine high resolution HST and ALMA imaging of ALESS SMGs with measurements of their internal dynamics to investigate how mergers and interactions trigger the high star formation rates seen in these systems. Such observations will allow us to better estimate the distribution and intensity of star formation and the time-scales involved in the encounters that appear to drive the rapid star formation.
acknowledgments
We would like to thank the referee, Catlin Casey, for a constructive report which improved the content and clarity of this paper. The ALMA observations were carried out under program 2011.0.00294.S. ALMA is a partnership of ESO (representing its member states), NSF (USA) and NINS (Japan), together with NRC (Canada) and NSC and ASIAA (Taiwan), in cooperation with the Republic of Chile. The Joint ALMA Observatory is operated by ESO, AUI/NRAO and NAOJ. This publication is also partly based on data acquired with the APEX under programme IDs 078.F-9028(A), 079.F-9500(A), 080.A-3023(A) and 081.F-9500(A). APEX is a collaboration between the Max-Planck-Institut fur Radioastronomie, the European Southern Observatory and the Onsala Space Observatory. We also make use of data from our ESO/VLT large program (LESS) PID: 183.A-0666 and VLT/XSHOOTER program 090.A.0927. This research also made use of data taken as part of the HerMES Key Programme from the SPIRE instrument team, ESAC scientists and a mission scientist. Herschel is an ESA space observatory with science instruments provided by European-led Principal Investigator consortia and with important participation from NASA. All of the ALMA, Herschel, VLA and Spitzer data employed in this analysis are available through the ESO, Herschel VLA and Spitzer archives. AMS gratefully acknowledges an STFC Advanced Fellowship through grant number ST/H005234/1. IRS also acknowledges STFC grant ST/I001573/1, a Leverhume Fellowship, the ERC Advanced Grant programme dustygal and a Royal Society Wolfson Merit Award. ALRD acknowledges an STFC studentship (ST/F007299/1). AK acknowledge support by the Collaborative Research Council 956, sub-project A1, funded by the Deutsche Forschungsgemeinschaft (DFG). JLW acknowledges support from Program HST-GO-12866.13-A which was provided by NASA through a grant from the Space Telescope Science Institute, which is operated by the Association of Universities for Research in Astronomy, Incorporated, under NASA contract NAS5-26555 and the Dark Cosmology Centre which is funded by the Danish National Research Foundation.
References
- Alaghband-Zadeh et al. (2012) Alaghband-Zadeh, S., Chapman, S. C., Swinbank, A. M., Smail, I., Harrison, C. M., Alexander, D. M., Casey, C. M., Davé, R., Narayanan, D., Tamura, Y., & Umehata, H. 2012, MNRAS, 424, 2232
- Barger et al. (1998) Barger, A. J., Cowie, L. L., Sanders, D. B., Fulton, E., Taniguchi, Y., Sato, Y., Kawara, K., & Okuda, H. 1998, Nature, 394, 248
- Barger et al. (2012) Barger, A. J., Wang, W.-H., Cowie, L. L., Owen, F. N., Chen, C.-C., & Williams, J. P. 2012, ApJ, 761, 89
- Baugh et al. (2005) Baugh, C. M., Lacey, C. G., Frenk, C. S., Granato, G. L., Silva, L., Bressan, A., Benson, A. J., & Cole, S. 2005, MNRAS, 356, 1191
- Biggs et al. (2011) Biggs, A. D., Ivison, R. J., Ibar, E., Wardlow, J. L., Dannerbauer, H., Smail, I., Walter, F., & Weiß, A. et al. 2011, MNRAS, 413, 2314
- Blain et al. (1999) Blain, A. W., Kneib, J.-P., Ivison, R. J., & Smail, I. 1999, ApJL, 512, L87
- Bothwell et al. (2013) Bothwell, M. S., Smail, I., Chapman, S. C., Genzel, R., Ivison, R. J., Tacconi, L. J., Alaghband-Zadeh, S., & Bertoldi, F. et al. 2013, MNRAS, 429, 3047
- Bower et al. (2006) Bower, R. G., Benson, A. J., Malbon, R., Helly, J. C., Frenk, C. S., Baugh, C. M., Cole, S., & Lacey, C. G. 2006, MNRAS, 370, 645
- Bruzual & Charlot (2003) Bruzual, G. & Charlot, S. 2003, MNRAS, 344, 1000
- Carilli et al. (2011) Carilli, C. L., Hodge, J., Walter, F., Riechers, D., Daddi, E., Dannerbauer, H., & Morrison, G. E. 2011, ApJL, 739, L33
- Casey et al. (2012) Casey, C. M., Berta, S., Béthermin, M., Bock, J., Bridge, C., Budynkiewicz, J., Burgarella, D., & et al., C. 2012, ApJ, 761, 140
- Casey et al. (2009) Casey, C. M., Chapman, S. C., Beswick, R. J., Biggs, A. D., Blain, A. W., Hainline, L. J., Ivison, R. J., Muxlow, T. W. B., & Smail, I. 2009, MNRAS, 399, 121
- Casey et al. (2013) Casey, C. M., Chen, C.-C., Cowie, L., Barger, A., Capak, P., Ilbert, O., Koss, M., Lee, N., Le Floc’h, E., Sanders, D. B., & Williams, J. P. 2013, ApJ submitted; ariv:1302.2619
- Chabrier (2003) Chabrier, G. 2003, PASP, 115, 763
- Chapin et al. (2009) Chapin, E. L., Hughes, D. H., & Aretxaga, I. 2009, MNRAS, 393, 653
- Chapman et al. (2005) Chapman, S. C., Blain, A. W., Smail, I., & Ivison, R. J. 2005, ApJ, 622, 772
- Chapman et al. (2003a) Chapman, S. C., Helou, G., Lewis, G. F., & Dale, D. A. 2003a, ApJ, 588, 186
- Chapman et al. (2003b) Chapman, S. C., Windhorst, R., Odewahn, S., Yan, H., & Conselice, C. 2003b, ApJ, 599, 92
- Chary & Elbaz (2001) Chary, R. & Elbaz, D. 2001, ApJ, 556, 562
- Clements et al. (2010) Clements, D. L., Rigby, E., Maddox, S., Dunne, L., Mortier, A., Pearson, C., Amblard, A., & et al., A. 2010, A&A, 518, L8
- Combes et al. (2011) Combes, F., García-Burillo, S., Braine, J., Schinnerer, E., Walter, F., & Colina, L. 2011, A&A, 528, A124
- Combes et al. (2013) —. 2013, A&A, 550, A41
- Coppin et al. (2006) Coppin, K., Chapin, E. L., Mortier, A. M. J., Scott, S. E., Borys, C., Dunlop, J. S., Halpern, M., & Hughes et al. 2006, MNRAS, 372, 1621
- Coppin et al. (2008a) Coppin, K., Halpern, M., Scott, D., Borys, C., Dunlop, J., Dunne, L., Ivison, R., & Wagg et al. 2008a, MNRAS, 123
- Coppin et al. (2008b) Coppin, K. E. K., Swinbank, A. M., Neri, R., Cox, P., Alexander, D. M., Smail, I., Page, M. J., Stevens, J. A., Knudsen, K. K., Ivison, R. J., Beelen, A., Bertoldi, F., & Omont, A. 2008b, MNRAS, 389, 45
- Daddi et al. (2010) Daddi, E., Bournaud, F., Walter, F., Dannerbauer, H., Carilli, C. L., Dickinson, M., Elbaz, D., & Morrison G. et al. 2010, ApJ, 713, 686
- Daddi et al. (2009) Daddi, E., Dannerbauer, H., Krips, M., Walter, F., Dickinson, M., Elbaz, D., & Morrison, G. E. 2009, ApJL, 695, L176
- Daddi et al. (2005) Daddi, E., Dickinson, M., Chary, R., Pope, A., Morrison, G., Alexander, D. M., Bauer, F. E., & Brandt, W. N. et al. 2005, ApJL, 631, L13
- Daddi et al. (2007) Daddi, E., Dickinson, M., Morrison, G., Chary, R., Cimatti, A., Elbaz, D., Frayer, D., Renzini, A., Pope, A., Alexander, D. M., Bauer, F. E., Giavalisco, M., Huynh, M., Kurk, J., & Mignoli, M. 2007, ApJ, 670, 156
- Davé et al. (2010) Davé, R., Finlator, K., Oppenheimer, B. D., Fardal, M., Katz, N., Kereš, D., & Weinberg, D. H. 2010, MNRAS, 404, 1355
- Draine et al. (2007) Draine, B. T., Dale, D. A., Bendo, G., Gordon, K. D., Smith, J. D. T., Armus, L., Engelbracht, C. W., Helou, G., Kennicutt, Jr., R. C., Li, A., Roussel, H., Walter, F., Calzetti, D., Moustakas, J., Murphy, E. J., Rieke, G. H., Bot, C., Hollenbach, D. J., Sheth, K., & Teplitz, H. I. 2007, ApJ, 663, 866
- Dunne et al. (2003) Dunne, L., Eales, S. A., & Edmunds, M. G. 2003, MNRAS, 341, 589
- Elbaz et al. (2011) Elbaz, D., Dickinson, M., Hwang, H. S., Díaz-Santos, T., Magdis, G., Magnelli, B., Le Borgne, D., & et al., G. 2011, A&A, 533, A119
- Engel et al. (2010) Engel, H., Tacconi, L. J., Davies, R. I., Neri, R., Smail, I., Chapman, S. C., Genzel, R., & Cox, P. et al. 2010, ApJ, 724, 233
- Förster Schreiber et al. (2009) Förster Schreiber, N. M., Genzel, R., Bouché, N., Cresci, G., Davies, R., Buschkamp, P., Shapiro, K., & Tacconi, L. J.. et al. 2009, ApJ, 706, 1364
- Frayer et al. (1998) Frayer, D. T., Ivison, R. J., Scoville, N. Z., Yun, M., Evans, A. S., Smail, I., Blain, A. W., & Kneib, J.-P. 1998, ApJL, 506, L7
- Gao & Solomon (2004) Gao, Y. & Solomon, P. M. 2004, ApJS, 152, 63
- Genzel et al. (2003) Genzel, R., Baker, A. J., Tacconi, L. J., Lutz, D., Cox, P., Guilloteau, S., & Omont, A. 2003, ApJ, 584, 633
- Genzel et al. (2010) Genzel, R., Tacconi, L. J., Gracia-Carpio, J., Sternberg, A., Cooper, M. C., Shapiro, K., Bolatto, A., & Bouche, N. et al.,. 2010, MNRAS, 407, 2091
- González et al. (2012) González, J. E., Lacey, C. G., Baugh, C. M., Frenk, C. S., & Benson, A. J. 2012, MNRAS, 423, 3709
- Granato et al. (2006) Granato, G. L., Silva, L., Lapi, A., Shankar, F., De Zotti, G., & Danese, L. 2006, MNRAS, 368, L72
- Greve et al. (2005) Greve, T. R., Bertoldi, F., Smail, I., Neri, R., Chapman, S. C., Blain, A. W., Ivison, R. J., & Genzel et al. 2005, MNRAS, 359, 1165
- Gruppioni et al. (2013) Gruppioni, C., Pozzi, F., Rodighiero, G., Delvecchio, I., Berta, S., Pozzetti, L., Zamorani, G., & Andreani, P. et al. 2013, MNRAS, 432, 23
- Guo et al. (2012) Guo, Y., Giavalisco, M., Cassata, P., Ferguson, H. C., Williams, C. C., Dickinson, M., Koekemoer, A., & Grogin, N. A. 2012, ApJ, 749, 149
- Hainline et al. (2006) Hainline, L. J., Blain, A. W., Greve, T. R., Chapman, S. C., Smail, I., & Ivison, R. J. 2006, ApJ, 650, 614
- Hainline et al. (2011) Hainline, L. J., Blain, A. W., Smail, I., Alexander, D. M., Armus, L., Chapman, S. C., & Ivison, R. J. 2011, ApJ, 740, 96
- Hayward et al. (2012) Hayward, C. C., Jonsson, P., Kereš, D., Magnelli, B., Hernquist, L., & Cox, T. J. 2012, MNRAS, 424, 951
- Hayward et al. (2011) Hayward, C. C., Kereš, D., Jonsson, P., Narayanan, D., Cox, T. J., & Hernquist, L. 2011, ApJ, 743, 159
- Hickox et al. (2012) Hickox, R. C., Wardlow, J. L., Smail, I., Myers, A. D., Alexander, D. M., Swinbank, A. M., Danielson, A. L. R., & Stott, J. P. et al. 2012, MNRAS, 421, 284
- Hodge et al. (2013) Hodge, J. A., Karim, A., Smail, I., Swinbank, A. M., Walter, F., Biggs, A. D., Ivison, R. J., & et al., W. 2013, ApJ, 768, 91
- Hopkins & Beacom (2006) Hopkins, A. M. & Beacom, J. F. 2006, ApJ, 651, 142
- Hopkins et al. (2007) Hopkins, P. F., Richards, G. T., & Hernquist, L. 2007, ApJ, 654, 731
- Hughes et al. (1998) Hughes, D. H., Serjeant, S., Dunlop, J., Rowan-Robinson, M., Blain, A., Mann, R. G., Ivison, R., & Peacock et al. 1998, Nature, 394, 241
- Huynh et al. (2013) Huynh, M. T., Norris, R. P., Coppin, K. E. K., Emonts, B. H. C., Ivison, R. J., Seymour, N., Smail, I., Smolčić, V., Swinbank, A. M., Brandt, W. N., Chapman, S. C., Dannerbauer, H., De Breuck, C., Greve, T. R., Hodge, J. A., Karim, A., Knudsen, K. K., Menten, K. M., van der Werf, P. P., Walter, F., & Weiss, A. 2013, MNRAS, 431, L88
- Ivison et al. (2007) Ivison, R. J., Greve, T. R., Dunlop, J. S., Peacock, J. A., Egami, E., Smail, I., & Ibar et al. 2007, MNRAS, 380, 199
- Ivison et al. (2002) Ivison, R. J., Greve, T. R., Smail, I., Dunlop, J. S., Roche, N. D., Scott, S. E., Page, M. J., & Stevens et al. 2002, MNRAS, 337, 1
- Ivison et al. (2011) Ivison, R. J., Papadopoulos, P. P., Smail, I., Greve, T. R., Thomson, A. P., Xilouris, E. M., & Chapman, S. C. 2011, MNRAS, 412, 1913
- Ivison et al. (2012) Ivison, R. J., Smail, I., Amblard, A., Arumugam, V., De Breuck, C., Emonts, B. H. C., Feain, I., & et al., G. 2012, MNRAS, 425, 1320
- Ivison et al. (2005) Ivison, R. J., Smail, I., Dunlop, J. S., Greve, T. R., Swinbank, A. M., Stevens, J. A., Mortier, A. M. J., & Serjeant et al. 2005, MNRAS, 364, 1025
- Ivison et al. (2010) Ivison, R. J., Swinbank, A. M., Swinyard, B., Smail, I., Pearson, C. P., Rigopoulou, D., Polehampton, E., & Baluteau, J.-P.. et al. 2010, A&A, 518, L35
- Jenkins (2004) Jenkins, E. B. 2004, Origin and Evolution of the Elements, 336
- Karim et al. (2011) Karim, A., Schinnerer, E., Martínez-Sansigre, A., Sargent, M. T., van der Wel, A., Rix, H.-W., Ilbert, O., & et al., S. 2011, ApJ, 730, 61
- Karim et al. (2013) Karim, A., Swinbank, A. M., Hodge, J. A., Smail, I. R., Walter, F., Biggs, A. D., Simpson, J. M., & et al., D. 2013, MNRAS, 432, 2
- Kereš et al. (2005) Kereš, D., Katz, N., Weinberg, D. H., & Davé, R. 2005, MNRAS, 363, 2
- Kovács et al. (2006) Kovács, A., Chapman, S. C., Dowell, C. D., Blain, A. W., Ivison, R. J., Smail, I., & Phillips, T. G. 2006, ApJ, 650, 592
- Lagos et al. (2013) Lagos, C. d. P., Baugh, C. M., Zwaan, M. A., Lacey, C. G., Gonzalez-Perez, V., Power, C., Swinbank, A. M., & van Kampen, E. 2013, arXiv:1310.4178
- Lagos et al. (2011) Lagos, C. D. P., Lacey, C. G., Baugh, C. M., Bower, R. G., & Benson, A. J. 2011, MNRAS, 416, 1566
- Lilly et al. (1999) Lilly, S. J., Eales, S. A., Gear, W. K. P., Hammer, F., Le Fèvre, O., Crampton, D., Bond, J. R., & Dunne, L. 1999, ApJ, 518, 641
- Lindner et al. (2011) Lindner, R. R., Baker, A. J., Omont, A., Beelen, A., Owen, F. N., Bertoldi, F., Dole, H., & Fiolet, N. et al. 2011, ApJ, 737, 83
- Lutz et al. (2011) Lutz, D., Poglitsch, A., Altieri, B., Andreani, P., Aussel, H., Berta, S., Bongiovanni, A., & Brisbin D. et al. 2011, A&A, 532, A90
- Magnelli et al. (2012a) Magnelli, B., Lutz, D., Santini, P., Saintonge, A., Berta, S., Albrecht, M., Altieri, B., & Andreani, P. et al. 2012a, A&A, 539, A155
- Magnelli et al. (2013) Magnelli, B., Popesso, P., Berta, S., Pozzi, F., Elbaz, D., Lutz, D., Dickinson, M., & et al., A. 2013, A&A, 553, A132
- Magnelli et al. (2012b) Magnelli, B., Saintonge, A., Lutz, D., Tacconi, L. J., Berta, S., Bournaud, F., Charmandaris, V., & et al., D. 2012b, A&A, 548, A22
- Maiolino et al. (2008) Maiolino, R., Nagao, T., Grazian, A., Cocchia, F., Marconi, A., Mannucci, F., Cimatti, A., & et al., P. 2008, A&A, 488, 463
- Marchesini et al. (2010) Marchesini, D., Whitaker, K. E., Brammer, G., van Dokkum, P. G., Labbé, I., Muzzin, A., Quadri, R. F., & et al., K. 2010, ApJ, 725, 1277
- McMullin et al. (2007) McMullin, J. P., Waters, B., Schiebel, D., Young, W., & Golap, K. 2007, in Astronomical Society of the Pacific Conference Series, Vol. 376, Astronomical Data Analysis Software and Systems XVI, ed. R. A. Shaw, F. Hill, & D. J. Bell, 127
- Miller et al. (2013) Miller, N. A., Bonzini, M., Fomalont, E. B., Kellermann, K. I., Mainieri, V., Padovani, P., Rosati, P., Tozzi, P., & Vattakunnel, S. 2013, ApJS, 205, 13
- Narayanan et al. (2009) Narayanan, D., Cox, T. J., Hayward, C. C., Younger, J. D., & Hernquist, L. 2009, MNRAS, 400, 1919
- Noeske et al. (2007) Noeske, K. G., Weiner, B. J., Faber, S. M., Papovich, C., Koo, D. C., Somerville, R. S., Bundy, K., & et al., C. 2007, ApJL, 660, L43
- Oliver et al. (2012) Oliver, S. J., Bock, J., Altieri, B., Amblard, A., Arumugam, V., Aussel, H., Babbedge, T., & Beelen, A. et al. 2012, MNRAS, 424, 1614
- Pope et al. (2006) Pope, A., Scott, D., Dickinson, M., Chary, R.-R., Morrison, G., Borys, C., Sajina, A., & Alexander, D. et al. 2006, MNRAS, 370, 1185
- Riechers et al. (2011) Riechers, D. A., Hodge, J., Walter, F., Carilli, C. L., & Bertoldi, F. 2011, arXiv/1105.4177
- Rieke et al. (2009) Rieke, G. H., Alonso-Herrero, A., Weiner, B. J., Pérez-González, P. G., Blaylock, M., Donley, J. L., & Marcillac, D. 2009, ApJ, 692, 556
- Rodighiero et al. (2010) Rodighiero, G., Cimatti, A., Gruppioni, C., Popesso, P., Andreani, P., Altieri, B., Aussel, H., & Berta, S. et al. 2010, A&A, 518, L25
- Rodighiero et al. (2011) Rodighiero, G., Daddi, E., Baronchelli, I., Cimatti, A., Renzini, A., Aussel, H., Popesso, P., & Lutz, D. et al. 2011, ApJL, 739, L40
- Roseboom et al. (2010) Roseboom, I. G., Oliver, S. J., Kunz, M., Altieri, B., Amblard, A., Arumugam, V., Auld, R., & et al., A. 2010, MNRAS, 409, 48
- Sanders & Mirabel (1996) Sanders, D. B. & Mirabel, I. F. 1996, ARAA, 34, 749
- Scoville (2013) Scoville, N. 2013, in IAU Symposium, Vol. 292, IAU Symposium, ed. T. Wong & J. Ott, 279–282
- Smail et al. (1997) Smail, I., Ivison, R. J., & Blain, A. W. 1997, ApJL, 490, L5
- Smolčić et al. (2012) Smolčić, V., Navarrete, F., Aravena, M., Ilbert, O., Yun, M. S., Sheth, K., Salvato, M., & McCracken, H. J. et al. 2012, ApJS, 200, 10
- Solomon & Sage (1988) Solomon, P. M. & Sage, L. J. 1988, ApJ, 334, 613
- Spergel et al. (2007) Spergel, D. N., Bean, R., Doré, O., Nolta, M. R., Bennett, C. L., Dunkley, J., Hinshaw, G., & Jarosik, N. et al. 2007, ApJS, 170, 377
- Swinbank et al. (2006) Swinbank, A. M., Chapman, S. C., Smail, I., Lindner, C., Borys, C., Blain, A. W., Ivison, R. J., & Lewis, G. F. 2006, MNRAS, 371, 465
- Swinbank et al. (2012) Swinbank, A. M., Karim, A., Smail, I., Hodge, J., Walter, F., Bertoldi, F., Biggs, A. D., & et al., d. 2012, MNRAS, 427, 1066
- Swinbank et al. (2008) Swinbank, A. M., Lacey, C. G., Smail, I., Baugh, C. M., Frenk, C. S., Blain, A. W., Chapman, S. C., & Coppin et al. 2008, MNRAS, 391, 420
- Swinbank et al. (2004) Swinbank, A. M., Smail, I., Chapman, S. C., Blain, A. W., Ivison, R. J., & Keel, W. C. 2004, ApJ, 617, 64
- Swinbank et al. (2010) Swinbank, A. M., Smail, I., Chapman, S. C., Borys, C., Alexander, D. M., Blain, A. W., Conselice, C. J., Hainline, L. J., & Ivison, R. J. 2010, MNRAS, 405, 234
- Symeonidis et al. (2013) Symeonidis, M., Vaccari, M., Berta, S., Page, M. J., Lutz, D., Arumugam, V., Aussel, H., & et al., B. 2013, MNRAS, 431, 2317
- Tacconi et al. (2010) Tacconi, L. J., Genzel, R., Neri, R., Cox, P., Cooper, M. C., Shapiro, K., Bolatto, A., & Bournaud, F., et al. 2010, Nature, 463, 781
- Tacconi et al. (2008) Tacconi, L. J., Genzel, R., Smail, I., Neri, R., Chapman, S. C., Ivison, R. J., Blain, A., & Cox, P., et al. 2008, ApJ, 680, 246
- Tacconi et al. (2006) Tacconi, L. J., Neri, R., Chapman, S. C., Genzel, R., Smail, I., Ivison, R. J., Bertoldi, F., & Blain et al. 2006, ApJ, 640, 228
- Tacconi et al. (2012) Tacconi, L. J., Neri, R., Genzel, R., Combes, F., Bolatto, A., Cooper, M. C., Wuyts, S., & Bournaud, F., et al. 2012, ArXiv:1211.5743
- Takata et al. (2006) Takata, T., Sekiguchi, K., Smail, I., Chapman, S. C., Geach, J. E., Swinbank, A. M., Blain, A., & Ivison, R. J. 2006, ApJ, 651, 713
- Wang et al. (2013) Wang, S. X., Brandt, W. N., Luo, B., Smail, I., Alexander, D. M., Danielson, A. L. R., Hodge, J. A., Karim, A., Lehmer, B. D., Simpson, J. M., Swinbank, A. M., Walter, F., Wardlow, J. L., Xue, Y. Q., Chapman, S. C., Coppin, K. E. K., Dannerbauer, H., De Breuck, C., Menten, K. M., & van der Werf, P. 2013, ApJ, 778, 179
- Wang et al. (2011) Wang, W.-H., Cowie, L. L., Barger, A. J., & Williams, J. P. 2011, ApJL, 726, L18
- Wardlow et al. (2011) Wardlow, J. L., Smail, I., Coppin, K. E. K., Alexander, D. M., Brandt, W. N., Danielson, A. L. R., Luo, B., & Swinbank, A. M. et al. 2011, MNRAS, 415, 1479
- Weingartner & Draine (2001) Weingartner, J. C. & Draine, B. T. 2001, ApJ, 548, 296
- Weiß et al. (2009) Weiß, A., Kovács, A., Coppin, K., Greve, T. R., Walter, F., Smail, I., Dunlop, J. S., & Knudsen, K. K. et al. 2009, ApJ, 707, 1201
Appendix A Example SPIRE images, models and residuals for LESS regions
In Fig. 11 we show the SPIRE 250, 350 and 500-m images, models and residual maps for four LESS SMG regions whose far-infrared SEDs are shown in Fig. 4.
In Table A1 we provide the ID, far-infrared and radio fluxes for the 96 ALESS SMGs which have photometric redshifts in our sample. We also list their derived properties, dust mass, far-infrared luminosity and characteristic dust temperature.
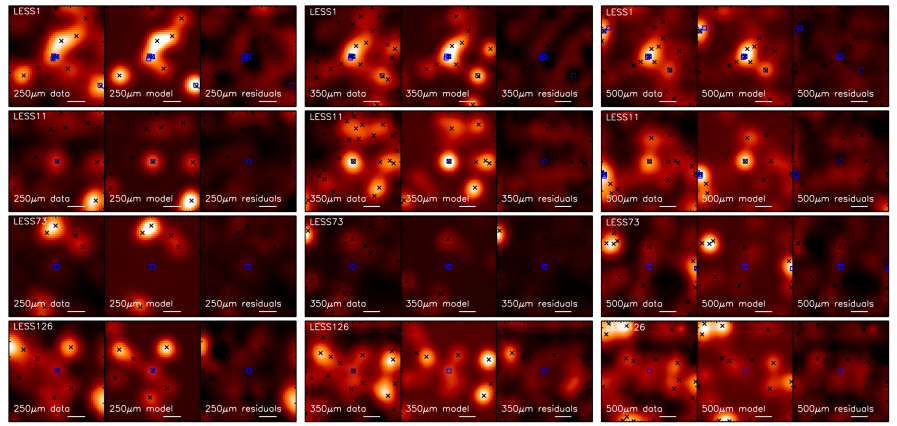
| ID | S870μm | S1.4GHz | S500μm | S350μm | S250μm | S24μm | () | |||
|---|---|---|---|---|---|---|---|---|---|---|
| (mJy) | (Jy) | (mJy) | (mJy) | (mJy) | (mJy) | ( 1012 ) | (K) | |||
| LESS1.1 | 6.75 0.49 | 22.8 | 16.65 | 15.59 | 8.30 | 45.0 | 4.34 | 9.13 0.03 | 3.3 | 36[24] |
| LESS1.2 | 3.48 0.43 | 22.8 | 16.65 | 15.59 | 9.14 | 45.0 | 4.65 | 8.86 0.05 | 3.4 | 44[32] |
| LESS1.3 | 1.89 0.42 | 22.8 | 17.62 | 16.69 3.57 | 10.70 2.31 | 45.0 | 2.85 | 8.25 0.09 | 3.2 | 31[40] |
| LESS2.1 | 3.81 0.42 | 236.90 7.90 | 19.90 4.29 | 17.78 3.76 | 17.66 3.21 | 45.0 | 1.96 | 8.39 0.05 | 4.4 | 24[40] |
| LESS2.2 | 4.23 0.67 | 22.8 | 11.53 2.93 | 17.62 3.71 | 11.58 2.46 | 45.0 | 3.92 | 8.68 0.06 | 5.6 | 42[37] |
| LESS3.1 | 8.28 0.40 | 22.8 | 25.80 5.03 | 23.33 4.29 | 15.68 2.93 | 45.0 | 3.90 | 8.98 0.02 | 9.0 | 36[35] |
| LESS5.1 | 7.78 0.68 | 41.70 8.80 | 22.47 4.61 | 22.90 4.25 | 10.57 2.33 | 45.0 | 2.86 | 8.54 0.04 | 4.9 | 27[38] |
| LESS6.1 | 5.98 0.41 | 48.90 8.10 | 25.29 4.95 | 20.45 3.99 | 14.72 2.83 | 89.65 15.00 | 0.45 | 8.25 0.03 | 0.2 | 11[19] |
| LESS7.1 | 6.10 0.32 | 78.60 7.10 | 34.95 6.12 | 43.60 5.74 | 32.16 4.54 | 494.70 15.00 | 2.50 | 8.99 0.02 | 6.4 | 31[32] |
| LESS9.1 | 8.75 0.47 | 34.80 7.10 | 26.60 5.15 | 17.43 3.66 | 14.50 2.78 | 45.0 | 4.50 | 9.08 0.02 | 8.4 | 38[32] |
| LESS10.1 | 5.25 0.50 | 98.70 6.30 | 18.04 | 19.01 3.87 | 21.61 3.58 | 133.75 15.00 | 2.02 | 8.42 0.04 | 3.1 | 26[38] |
| LESS11.1 | 7.29 0.41 | 55.40 6.90 | 23.82 4.75 | 23.04 4.23 | 15.12 2.85 | 108.16 15.00 | 2.83 | 8.84 0.02 | 7.9 | 29[33] |
| LESS13.1 | 8.01 0.59 | 24.80 6.30 | 11.73 2.90 | 11.77 2.89 | 8.09 1.90 | 45.0 | 3.25 | 8.92 0.03 | 5.4 | 26[24] |
| LESS14.1 | 7.47 0.52 | 91.20 8.10 | 29.99 5.53 | 27.63 4.64 | 21.35 3.52 | 67.35 15.00 | 4.47 | 9.15 0.03 | 9.4 | 42[33] |
| LESS15.1 | 9.01 0.37 | 32.10 9.70 | 21.11 4.39 | 23.57 4.29 | 12.62 2.58 | 186.09 15.00 | 1.93 | 9.51 0.02 | 1.3 | 21[19] |
| LESS15.3 | 1.95 0.52 | 22.8 | 15.93 | 15.33 | 10.14 | 45.0 | 3.15 | 8.65 0.10 | 1.5 | 35[19] |
| LESS17.1 | 8.44 0.46 | 122.20 7.00 | 27.57 5.24 | 32.58 5.04 | 23.60 3.78 | 194.86 15.00 | 1.51 | 9.38 0.02 | 1.6 | 20[19] |
| LESS18.1 | 4.38 0.54 | 129.40 6.90 | 32.24 5.81 | 40.96 5.60 | 41.70 5.30 | 1020.42 15.00 | 2.04 | 8.79 0.05 | 5.4 | 30[33] |
| LESS19.1 | 4.98 0.42 | 34.70 6.90 | 16.02 3.63 | 24.85 4.41 | 19.90 3.38 | 45.0 | 2.41 | 8.41 0.04 | 3.6 | 30[38] |
| LESS19.2 | 1.98 0.47 | 22.8 | 17.62 | 16.50 | 13.50 | 45.0 | 2.17 | 8.01 0.09 | 1.5 | 30[38] |
| LESS22.1 | 4.48 0.54 | 65.20 8.60 | 23.75 4.74 | 32.70 5.05 | 25.03 3.88 | 465.14 15.00 | 1.88 | 9.08 0.05 | 2.7 | 27[24] |
| LESS23.1 | 6.74 0.37 | 22.8 | 16.65 | 16.20 3.51 | 13.71 2.72 | 45.0 | 4.99 | 9.01 0.02 | 6.4 | 43[35] |
| LESS23.7 | 1.76 0.49 | 22.8 | 17.07 | 16.49 | 16.64 | 45.0 | 2.90 | 8.69 0.11 | 3.0 | 40[19] |
| LESS25.1 | 6.21 0.47 | 63.40 7.60 | 19.40 4.13 | 26.13 4.52 | 28.01 4.19 | 164.17 15.00 | 2.24 | 8.43 0.03 | 7.5 | 29[41] |
| LESS29.1 | 5.90 0.43 | 49.80 9.60 | 23.96 4.77 | 25.57 4.47 | 21.71 3.56 | 45.0 | 2.66 | 8.47 0.03 | 10.0 | 31[41] |
| LESS31.1 | 8.12 0.37 | 30.40 6.90 | 15.12 3.46 | 18.85 3.79 | 11.06 2.34 | 45.0 | 2.89 | 8.68 0.02 | 7.3 | 26[32] |
| LESS37.1 | 2.92 0.41 | 31.50 8.40 | 12.28 3.00 | 18.99 3.81 | 18.34 3.22 | 258.49 15.00 | 3.53 | 8.87 0.06 | 4.3 | 44[32] |
| LESS37.2 | 1.65 0.44 | 22.8 | 14.00 | 13.97 | 11.80 | 45.0 | 4.87 | 8.52 0.10 | 1.9 | 55[32] |
| LESS39.1 | 4.33 0.34 | 49.80 8.10 | 15.01 3.45 | 19.04 3.81 | 8.44 2.01 | 122.49 15.00 | 2.44 | 8.70 0.03 | 3.8 | 27[32] |
| LESS41.1 | 4.88 0.61 | 22.8 | 16.76 3.73 | 22.84 4.21 | 15.57 2.92 | 340.47 15.00 | 2.75 | 8.68 0.05 | 5.3 | 31[35] |
| LESS41.3 | 2.68 0.75 | 22.8 | 13.42 | 15.04 | 10.14 | 45.0 | 3.10 | 8.36 0.11 | 1.9 | 33[32] |
| LESS43.1 | 2.30 0.42 | 22.8 | 12.30 3.04 | 14.71 3.34 | 9.40 2.17 | 218.09 15.00 | 1.71 | 8.79 0.07 | 1.0 | 23[23] |
| LESS45.1 | 6.03 0.54 | 35.50 6.70 | 18.22 3.95 | 20.51 3.96 | 12.94 2.57 | 66.93 15.00 | 2.34 | 8.38 0.04 | 3.5 | 26[38] |
| LESS49.1 | 6.00 0.68 | 84.50 8.40 | 15.41 | 20.88 4.08 | 17.65 3.25 | 133.14 15.00 | 2.76 | 8.73 0.05 | 7.3 | 32[32] |
| LESS49.2 | 1.80 0.46 | 37.00 8.20 | 14.29 | 9.28 2.53 | 18.70 3.29 | 45.0 | 1.47 | 7.94 0.10 | 0.9 | 23[38] |
| LESS51.1 | 4.70 0.39 | 34.50 7.20 | 14.86 | 15.33 | 12.37 | 231.94 15.00 | 1.22 | 8.96 0.03 | 0.9 | 17[19] |
| LESS55.1 | 3.99 0.36 | 22.8 | 10.60 | 8.00 | 7.00 | 45.0 | 2.05 | 8.90 0.04 | 0.5 | 21[19] |
| LESS55.2 | 2.35 0.60 | 22.8 | 10.60 | 8.00 | 7.00 | 45.0 | 4.20 | 8.96 0.10 | 2.4 | 40[19] |
| LESS55.5 | 1.37 0.37 | 22.8 | 10.60 | 8.00 | 7.00 | 45.0 | 2.35 | 7.89 0.10 | 0.9 | 28[38] |
| LESS57.1 | 3.56 0.61 | 51.00 7.20 | 20.71 4.32 | 15.31 3.41 | 15.85 2.97 | 283.72 15.00 | 2.95 | 8.86 0.07 | 4.4 | 32[32] |
| LESS59.2 | 1.94 0.44 | 22.8 | 11.24 2.83 | 14.42 3.28 | 9.89 2.21 | 45.0 | 2.09 | 8.02 0.09 | 1.6 | 27[38] |
| LESS61.1 | 4.29 0.51 | 22.8 | 10.60 | 9.94 | 7.06 1.76 | 45.0 | 6.52 | 8.65 0.05 | 5.7 | 52[37] |
| LESS63.1 | 5.59 0.35 | 22.8 | 13.71 | 13.56 | 7.44 1.79 | 45.0 | 1.87 | 9.19 0.03 | 0.6 | 20[19] |
| LESS65.1 | 4.16 0.43 | 22.8 | 11.79 | 9.15 | 7.00 | 45.0 | 2.82 | 8.47 0.04 | 3.9 | 27[32] |
| LESS66.1 | 2.50 0.48 | 69.80 8.10 | 10.60 | 16.33 3.49 | 20.07 3.42 | 576.23 15.00 | 2.33 | 8.67 0.08 | 3.2 | 35[33] |
| LESS67.1 | 4.50 0.38 | 73.90 6.90 | 22.99 4.63 | 35.68 5.26 | 33.68 4.61 | 732.63 15.00 | 2.14 | 8.85 0.04 | 5.3 | 31[32] |
| LESS67.2 | 1.73 0.41 | 22.8 | 14.86 | 16.37 | 7.22 1.87 | 45.0 | 2.05 | 7.88 0.09 | 1.1 | 24[38] |
| LESS68.1 | 3.70 0.56 | 22.8 | 12.58 | 8.07 2.31 | 8.38 1.98 | 45.0 | 3.60 | 8.58 0.06 | 3.4 | 28[32] |
| LESS69.1 | 4.85 0.63 | 22.8 | 13.14 | 13.97 | 9.14 | 87.91 15.00 | 2.34 | 8.63 0.05 | 2.2 | 25[24] |
| LESS69.2 | 2.36 0.56 | 22.8 | 13.42 | 13.97 | 9.62 | 45.0 | 4.75 | 8.71 0.09 | 2.6 | 48[35] |
| LESS69.3 | 2.05 0.56 | 22.8 | 13.14 | 12.68 | 7.00 | 45.0 | 4.80 | 9.02 0.10 | 2.3 | 45[19] |
| LESS70.1 | 5.23 0.45 | 325.40 7.60 | 24.09 4.78 | 33.89 5.13 | 33.25 4.61 | 436.16 15.00 | 2.28 | 8.78 0.04 | 7.9 | 31[33] |
| LESS71.1 | 2.85 0.60 | 199.00 8.70 | 24.41 4.83 | 49.13 6.02 | 51.97 5.98 | 609.47 15.00 | 2.48 | 8.62 0.08 | 14.3 | 38[52] |
| LESS71.3 | 1.36 0.38 | 22.8 | 14.00 | 16.42 | 17.82 | 45.0 | 2.73 | 8.22 0.11 | 2.7 | 42[41] |
| LESS72.1 | 4.91 0.50 | 22.8 | 13.14 | 15.33 | 11.80 | 45.0 | 4.15 | 9.13 0.04 | 4.1 | 40[19] |
| LESS73.1 | 6.09 0.47 | 24.00 6.30 | 10.60 | 8.00 | 7.00 | 45.0 | 5.18 | 8.97 0.03 | 5.6 | 38[32] |
| LESS74.1 | 4.64 0.69 | 48.00 8.20 | 12.52 3.06 | 21.47 4.12 | 20.57 3.45 | 164.91 15.00 | 1.80 | 8.27 0.06 | 2.8 | 27[38] |
| LESS75.1 | 3.17 0.45 | 74.90 8.50 | 25.68 5.01 | 29.18 4.80 | 23.99 3.84 | 1240.04 15.00 | 2.39 | 8.86 0.06 | 4.2 | 31[32] |
| LESS75.4 | 1.30 0.37 | 22.8 | 16.87 | 14.71 | 10.68 | 45.0 | 2.10 | 7.89 0.11 | 1.1 | 29[38] |
| LESS76.1 | 6.42 0.58 | 45.40 9.50 | 12.04 | 9.53 | 7.00 | 45.0 | 4.50 | 8.83 0.04 | 6.8 | 35[33] |
| LESS79.1 | 4.12 0.37 | 22.8 | 17.89 3.92 | 16.11 3.52 | 10.47 2.29 | 45.0 | 2.04 | 8.13 0.04 | 2.6 | 24[38] |
| LESS79.2 | 1.98 0.40 | 40.90 7.00 | 14.86 | 17.72 3.74 | 20.78 3.52 | 719.92 15.00 | 1.55 | 8.41 0.08 | 2.1 | 25[32] |
| LESS79.4 | 1.81 0.51 | 22.8 | 15.68 | 15.81 | 12.37 | 45.0 | 4.60 | 8.46 0.11 | 1.9 | 51[38] |
| LESS80.1 | 4.03 0.86 | 48.80 7.00 | 13.14 | 13.13 | 9.14 | 45.0 | 1.96 | 8.01 0.08 | 1.3 | 22[38] |
| LESS80.2 | 3.54 0.90 | 22.8 | 13.14 | 13.13 | 9.62 | 185.31 15.00 | 1.37 | 8.72 0.10 | 0.4 | 18[19] |
| LESS82.1 | 1.93 0.47 | 22.8 | 12.31 | 8.80 | 7.00 | 45.0 | 2.10 | 8.15 0.09 | 1.8 | 24[32] |
| LESS83.4 | 1.39 0.36 | 22.8 | 13.42 | 10.37 | 7.41 | 45.0 | 0.57 | 7.81 0.10 | 0.3 | 13[19] |
| ID | S870μm | S1.4GHz | S500μm | S350μm | S250μm | S24μm | () | |||
|---|---|---|---|---|---|---|---|---|---|---|
| (mJy) | (Jy) | (mJy) | (mJy) | (mJy) | (mJy) | ( 1012 ) | (K) | |||
| LESS84.1 | 3.17 0.63 | 38.90 6.80 | 21.99 4.50 | 25.53 4.47 | 17.34 3.22 | 204.78 15.00 | 1.92 | 8.27 0.08 | 2.7 | 24[38] |
| LESS84.2 | 3.25 0.77 | 22.8 | 14.86 | 14.36 | 11.36 2.49 | 146.23 15.00 | 1.75 | 8.60 0.09 | 1.0 | 20[24] |
| LESS87.1 | 1.34 0.35 | 122.30 9.30 | 12.31 | 12.28 2.96 | 16.58 3.04 | 504.78 15.00 | 3.20 | 8.78 0.10 | 3.2 | 41[32] |
| LESS87.3 | 2.44 0.59 | 22.8 | 10.60 | 9.15 | 7.00 | 45.0 | 4.00 | 8.93 0.09 | 2.5 | 39[19] |
| LESS88.1 | 4.62 0.58 | 33.60 6.80 | 20.96 4.38 | 19.71 3.94 | 14.82 2.83 | 378.07 15.00 | 1.84 | 8.67 0.05 | 2.2 | 22[24] |
| LESS88.11 | 2.51 0.71 | 22.8 | 22.44 4.57 | 19.37 3.92 | 11.71 2.62 | 45.0 | 2.57 | 8.29 0.11 | 2.3 | 27[38] |
| LESS88.2 | 2.14 0.50 | 22.8 | 16.18 | 16.47 | 15.50 | 45.0 | 5.20 | 8.62 0.09 | 2.3 | 60[37] |
| LESS88.5 | 2.86 0.72 | 38.20 6.60 | 12.56 3.08 | 22.98 4.26 | 17.05 3.13 | 143.40 15.00 | 2.30 | 8.29 0.10 | 4.5 | 31[41] |
| LESS92.2 | 2.42 0.68 | 22.8 | 11.79 | 11.76 | 7.00 | 45.0 | 1.90 | 9.01 0.11 | 0.4 | 22[19] |
| LESS94.1 | 3.18 0.52 | 22.8 | 10.87 2.76 | 11.44 2.85 | 8.19 1.92 | 168.21 15.00 | 2.87 | 8.94 0.07 | 1.9 | 30[24] |
| LESS98.1 | 4.78 0.60 | 145.00 8.20 | 36.86 6.33 | 65.47 6.65 | 64.74 6.76 | 217.63 15.00 | 1.63 | 8.67 0.05 | 4.7 | 27[35] |
| LESS99.1 | 2.05 0.43 | 22.8 | 10.60 | 8.00 | 7.00 | 45.0 | 5.00 | 8.59 0.08 | 2.2 | 48[32] |
| LESS102.1 | 3.08 0.50 | 38.50 9.10 | 10.65 2.70 | 12.79 3.03 | 9.16 2.08 | 202.01 15.00 | 1.76 | 8.56 0.06 | 1.4 | 22[24] |
| LESS103.3 | 1.43 0.41 | 22.8 | 14.86 | 12.68 | 10.14 | 45.0 | 4.40 | 8.82 0.11 | 1.6 | 49[19] |
| LESS107.1 | 1.91 0.39 | 22.8 | 12.58 | 10.24 2.67 | 10.77 2.32 | 45.0 | 3.75 | 8.28 0.08 | 3.5 | 40[41] |
| LESS107.3 | 1.46 0.40 | 22.8 | 12.04 | 13.97 | 12.94 | 45.0 | 2.12 | 7.88 0.10 | 1.1 | 31[38] |
| LESS110.1 | 4.11 0.47 | 22.8 | 10.60 | 11.96 2.89 | 10.41 2.33 | 45.0 | 2.55 | 8.28 0.05 | 5.2 | 27[40] |
| LESS110.5 | 2.39 0.60 | 22.8 | 10.60 | 9.94 | 9.14 | 45.0 | 3.70 | 8.94 0.10 | 2.3 | 39[19] |
| LESS112.1 | 7.62 0.49 | 22.8 | 20.82 4.33 | 20.86 4.02 | 18.13 3.20 | 161.26 15.00 | 1.95 | 9.36 0.03 | 1.0 | 23[19] |
| LESS114.1 | 2.99 0.78 | 22.8 | 18.20 4.00 | 17.95 3.71 | 16.34 2.97 | 45.0 | 3.00 | 8.86 0.10 | 6.2 | 34[19] |
| LESS114.2 | 1.98 0.50 | 97.80 6.80 | 10.87 2.80 | 32.58 5.07 | 41.62 5.37 | 513.43 15.00 | 1.56 | 8.64 0.10 | 2.6 | 33[32] |
| LESS116.1 | 3.08 0.47 | 22.8 | 18.41 3.98 | 17.53 3.65 | 11.89 2.43 | 45.0 | 3.54 | 8.51 0.06 | 2.6 | 38[38] |
| LESS116.2 | 3.42 0.57 | 41.90 6.80 | 17.26 3.83 | 17.09 3.60 | 8.67 2.00 | 45.0 | 4.02 | 8.80 0.07 | 4.2 | 39[33] |
| LESS118.1 | 3.20 0.54 | 43.50 7.80 | 12.30 3.00 | 16.71 3.56 | 14.43 2.79 | 45.0 | 2.26 | 8.24 0.07 | 2.4 | 29[38] |
| LESS119.1 | 8.27 0.54 | 22.8 | 12.85 | 11.29 | 7.65 | 45.0 | 3.50 | 8.95 0.03 | 4.3 | 27[24] |
| LESS122.1 | 3.69 0.42 | 207.50 7.40 | 32.08 5.79 | 42.54 5.70 | 48.26 5.73 | 1479.99 15.00 | 2.06 | 8.90 0.05 | 6.3 | 32[33] |
| LESS124.1 | 3.64 0.57 | 27.70 7.80 | 19.83 4.19 | 19.25 3.84 | 9.16 2.09 | 80.41 15.00 | 6.07 | 8.69 0.06 | 7.2 | 54[41] |
| LESS124.4 | 2.24 0.58 | 22.8 | 13.42 | 13.56 | 7.31 1.78 | 45.0 | 5.60 | 8.56 0.10 | 4.3 | 48[35] |
| LESS126.1 | 2.23 0.55 | 25.10 6.70 | 10.60 | 8.00 | 7.02 1.75 | 219.61 15.00 | 1.82 | 8.29 0.10 | 1.3 | 19[24] |
Notes: 3 upper limits are given in the case of non-detections. ∗ We provide two estimates of the dust temperature; the first value corresponds to the characteristic dust temperature as measured from a modified black-body fit to the far-infrared photometry at the photometric redshift. The second value (in parenthesis) corresponds to the wavelength of the peak of the best-fit dust SED template and assuming = 2.897 10-3 m.K.
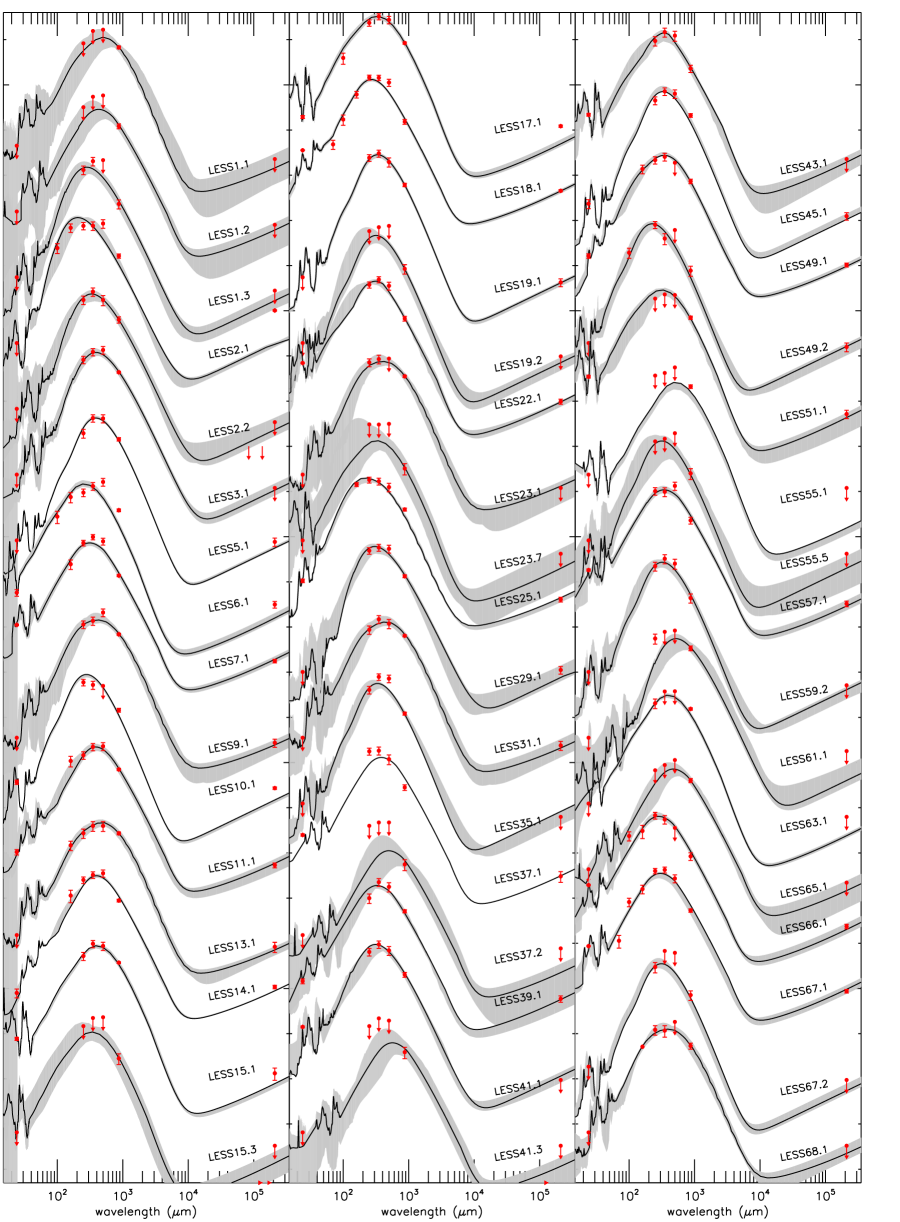
![[Uncaptioned image]](/html/1310.6362/assets/x16.png)