Population synthesis on high-mass X-ray binaries: prospects and constraints from the universal X-ray luminosity function
Abstract
Using an updated population synthesis code initially developed by Hurley et al. we modeled the synthetic X-ray binary (XRB) populations for direct comparison with the universal, featureless X-ray luminosity function (XLF) of high mass X-ray binaries (HMXBs) in star-forming galaxies. Our main goal is to use the universal XLF to constrain the model parameters, given the current knowledge of binary evolution. We find that the one-dimensional (1D) Maxwellian velocity dispersion of the natal kick can be constrained to be of the order of , supporting earlier findings that neutron stars (NSs) formed in binaries seem to receive significantly smaller natal kicks than the velocities of Galactic single pulsars would indicate. The super-Eddington accretion factor is further confirmed in the framework of stellar mass black holes (BHs), revealing the true origin of the most of the ultraluminous X-ray sources (ULXs) may indeed be the high-luminosity extension of ordinary HMXBs which harbor stellar-mass BHs rather than exotic intermediate-mass BHs or ones. We present the detail properties of the model-predicted present-day HMXBs, which may be investigated by future high-resolution X-ray and optical observations of sources in nearby star-forming galaxies.
1 Introduction
High mass X-ray binaries (HMXBs) are binary systems, in which a high mass primary star formed the compact star accreting from a secondary massive star. They are conventionally divided into two subgroups (van Paradijs, 1983). One group usually contains an evolved (super)giant star, generally , having strong stellar wind or filling its Roche lobe (RL) to power a bright X-ray source for yr. The compact star should be either a neutron star (NS; ) or a stellar-mass black hole (BH; for solar metallicity, but may reach in metal-poor environments, see Remillard & McClintock, 2006, for reviews) as a result of collapse of high mass primary star. Another possible type of accreting objects may be intermediate-mass () BH (i.e., IMBHs, see van der Marel, 2004, for a review), however its exact origin is still not well understood. The other group is so-called Be/X-ray binaries (Be-XRBs), in which it contains a Be (B-type star which shows emission-line spectra) companion, usually accreted by an NS during its periastron passage, showing as X-ray transients.
With Chandra’s unprecedented sensitivity and angular resolution (Weisskopf et al., 2000), a large number of HMXBs have been discovered in galaxies even beyond the Local Group (Fabbiano, 2006), allowing to do studies of the collective properties of HMXB populations as a whole. One of the most striking features of HMXB populations is that the X-ray luminosity function (XLF) takes a possibly universal form of a single, smooth power law giving an excellent account of HMXBs containing NSs, stellar-mass BHs and probably IMBHs over the entire X-ray luminosity range . This is first discovered by Grimm, Gilfanov & Sunyaev (2003a), based on Chandra and ASCA data of nearby star-forming galaxies and RXTE/ASM, ASCA, and MIR-KVANT/TTM observations of our Galaxy and the Magellanic Clouds. They showed that for a wide range of star formation rate (SFR), the HMXB XLF in a galaxy can be well described by a power law with slope of 1.6, the normalization of which is proportional to the SFR. They searched for but found no features corresponding to the Eddington luminosities of NS and BH in the averaged XLF. They argued, however, that the expected features may be smeared and diluted by various effects such as distance uncertainties. With a larger sample of galaxies and better control of systematic effects, Mineo, Gilfanov & Sunyaev (2012, hereafter MGS for short) revisited this problem and found that the average HMXB XLF is entirely consistent with the one obtained by Grimm, Gilfanov & Sunyaev (2003a). The accuracy of XLF slope has been improved to , and the values of the high luminosity break at are consistent within statistical uncertainties. They did not find any statistically significant feature in the XLF near the critical Eddington luminosity of NSs, either.
Although the absence of features in the HMXB XLF is striking and puzzling, theoretical investigations on this remain limited. Using the fundamental mass-luminosity and mass-radius relations for massive stars, as well as a natural assumption on the power-law initial mass function (IMF; Salpeter IMF or Miller-Scalo IMF) and following a semi-empirical approach, Postnov (2003) noted that the universal XLF can be readily explained by the universal properties of mass transfer rates in HMXBs. Bogomazov & Lipunov (2008), using the “Scenario Machine” code (Lipunov et al., 2009), instead argued that there should be no universal XLF in both observational and theoretical aspects. They suggested that the evolution of binaries and their lifetimes in their X-ray stages should be taken into account in future theoretical modelings. Recently, Bhadkamkar & Ghosh (2012) used a Jacobian transformation method to calculate the XLF and the binary-period distribution of HMXBs in the stellar fields of normal galaxies. Their model XLF can match the observed XLF shape quite closely. They suggested that a future Monte Carlo evolutionary population synthesis (EPS) scheme is promising to obtain more detailed understanding of the formation and evolution of HMXB populations.
In fact population synthesis studies on the XLF have already been examined and explored extensively in the past decade. Several authors focused on the XLF modeling for individual galaxies, the types of which cover almost the entire galaxy morphological sequence, for example the star forming galaxies (see Belczynski et al., 2004, i.e., NGC 1569), star-burst galaxies (Liu & Li, 2007, NGC 4038/4039, the Antennae), and elliptical galaxies (Fragos et al., 2008, 2009, NGC 3379 and NGC 4278). Specifically Linden et al. (2010, 2011) modeled the XLF for HMXBs and Be-XRBs in the Small Magellanic Cloud (SMC). Luo et al. (2012) studied the XLFs of XRB populations in NGC 1291, in both the bulge and ring regions. Additionally Lü et al. (2012) calculated the numbers and birthrates of symbiotic XRBs in the Galaxy. Several authors focused on X-ray/XLF evolution or their numbers of a specific type of galaxies globally, instead. However most of them are based on semi-empirical, semi-analytical approaches, with simplified assumptions adopted on the formation and evolution of XRBs (White & Ghosh, 1998; Van Bever & Vanbeveren, 2000; Ghosh & White, 2001; Wu K., 2001; Piro & Bildsten, 2002; Bildsten & Deloye, 2004; Revnivtsev et al., 2011; Bhadkamkar & Ghosh, 2012, 2013a, 2013b). It is worth noting that the more sophisticated, state-of-the-art EPS simulation has also been explored in this direction. The first attempt was done recently by Zuo & Li (2011) on the cosmic X-ray evolution of XRBs in late-type galaxies, and its dependence on the physical properties of galaxies (e.g., optical luminosity, stellar mass, and mass-to-light ratio), which is followed by Fragos et al. (2013) focusing mainly on the global scaling of emission from XRB populations with star-formation rate and stellar mass, and their evolution with redshifts, by using the Millennium-II simulation as initial conditions. As a series of works following Fragos et al. (2013), another two EPS studies are presented recently. One is by Tremmel et al. (2013) studying on the redshift evolution of the normal galaxy XLF as well as integrated XRB emission from entire galaxies, the other is by Tzanavaris et al. (2013) focusing on modeling the XLFs in galaxies in the Spitzer Infrared Nearby Galaxy Survey (SINGS).
In the present work, we use a most up-to-date EPS code to model the observed XLF (both the shape and the absolute source number) of HMXBs in star-forming galaxies. We also evaluate the effects of several input parameters such as the IMF of binary stars, the natal kick distribution, common envelop (CE) efficiency and super-Eddington factor (see Sec 2.1 for details) on the results. One particular objective of this study is to use the universal featureless XLF to constrain the model parameters. We also aim to explore the detailed components of HMXB populations, which may help understand the nature of the sources and may be testified by future observations.
This paper is organized as follows. In §2 we describe the population synthesis method and the input physics for X-ray binaries (XRBs) in our model. The calculated results and discussion are presented in §3. Our conclusions are in §4.
2 Models
2.1 Assumptions and input parameters
We calculate the expected numbers for various types of HMXB population using a version of EPS code developed by Hurley et al. (2000, 2002) and updated as described in Liu & Li (2007, see Appendix A in their paper) and Zuo et al. (2008). In the present code, the compact object masses are calculated in a different way than originally suggested by Hurley et al. (2000) and Liu & Li (2007). We use a prescription the same as Fryer et al (2012, i.e., the Rapid supernova mechanism), which can reproduce successfully the mass gap observed in Galactic XRBs when combined with binary evolution (Belczynski et al., 2012). We also allow for the formation of low mass NSs through ECS (Podsiadlowski et al., 2004). The maximum NS mass is assumed to be , above which BH is assumed to form. We change the recipes for mass loss of stellar winds by using the metal-dependent fitting formulae given by Vink et al. (2001, see also Belczynski et al. 2010). The wind velocity is difficult to determine accurately, and usually set to be proportional to the escape velocity from the surface of the mass-losing star, as a ratio . The values of must depend on the spectral type of the mass-losing star (Lammers et al., 1995; Kucinskas, 1999). We adopt (i.e., slow winds) for He-rich stars and extended () H-rich giants, for high-mass () main sequence (MS) stars, and the default value 0.5 for others.
Another two major updates are related to the CE evolution. One (and of the most important improvements recently) is on the CE coefficient, , which describes the binding energy of the envelope. We now use a more physical estimate of (Xu & Li, 2010; Loveridge et al., 2011, see below) rather than the constant value conventionally assumed by most previous studies. The other is on the updated critical mass ratio criterion for CE initiated by Hertzsprung gap (HG) donor stars, recently developed by Shao & Li (2013, private communication, see Appendix A). The values of other parameters are adopted the same as the default ones in Hurley et al. (2002) if not mentioned otherwise.
The HMXBs studied by MGS all reside in nearby star-forming galaxies (see their Table 1 for details). Due to heterogeneous data of these galaxies, the metallicity estimation for each galaxy is still not available, however the rough value is most likely to be around subsolar as a whole (private communication with Mineo S.). So we adopted a fixed subsolar metallicity (0.5) in our basic model. A lower metal abundance mainly affect stellar wind, making it weaker, so we designed a “WEAK” wind model (i.e.,model M8) to test this effect. For star formation, a constant SFR of 50 Myr is assumed in our basic model. In each model, we evolve primordial systems111We also vary the number of the binary systems by a factor of eight, and found no significant difference in the final results., all of which are initially binary systems. We set up the same grid of initial parameters (primary mass, secondary mass and orbital separation) as Hurley et al. (2002) did and then evolve each binary. In the following we describe the assumptions and input parameters in our basic model (i.e., model M1, listed in Table 1).
(1) initial parameters
We take the IMF of Kroupa (2001, hereafter KROUPA01, with power law slope of -1.3
in 0.08-0.5, and -2.3 in 0.5-80.0) for the
distribution of the primary mass (). For the secondary’s mass (),
a uniform distribution is assumed for the mass ratio between 0 and 1.
We also adopt a uniform distribution for the logarithm of the orbital separation
(Hurley et al., 2002).
(2) CE evolution
When mass transfer becomes dynamically unstable, a binary may enter a CE phase.
An important parameter determining the outcome of the CE is the CE parameter
(Paczyński, 1976; Iben & Livio, 1993). It describes the efficiency of converting orbital energy
() into the kinetic energy,
resulting in the ejection of the envelope ().
We use the standard energy prescription (Webbink, 1984; Kiel & Hurley, 2006) to compute the
outcome of the CE phase.
| (1) |
where is the gravitational constant, and denote the initial and final orbital separations, respectively; is the helium-core mass of the primary star (); the binding energy of the hydrogen-rich envelope. Conventionally, a so-called envelope-structure parameter, , defined by
| (2) |
is used to compute the binding energy, where is the RL radius of the primary star. The parameter is often assumed to be a constant value (Hurley et al., 2002; Zuo & Li, 2010), however in reality it will vary for stars of different masses and different evolutionary phases, far from constant (Dewi & Tauris, 2000; van der Sluys et al., 2006). Recent work by Loveridge et al. (2011) presents accurate analytic prescriptions of the envelope binding energy for giants as a function of basic stellar parameters such as the metallicity, mass, radius, and evolutionary phase of the star. They computed the envelope binding energy by integrating the gravitational and internal energies from the core-envelope boundary to the surface of the star as follows,
| (3) |
where is the internal energy per unit of mass, containing terms such as the thermal energy of the gas and the radiation energy, but not the recombination energy (for more details, see van der Sluys et al., 2006). Here we adopt Loveridge et al. (2011)’s prescription for CE evolution.
(3) super-Eddington radiation
In the literature it is often implicitly assumed that the luminosities of
accreting NS/BH binaries were constrained by the critical Eddington limit:
| (4) |
where is the Thomson cross section, is the proton mass and the velocity of light. However we note that in reality this limit may fail for several systems. One possible example is the recently discovered large population of ultra-luminous X-ray sources (ULXs, non-nuclear point-like sources with isotropic X-ray luminosity exceeding ), often associated with star-forming regions (Zezas Georgantopoulos & Ward, 1999; Roberts & Warwick, 2000; Fabbiano, Zezas & Murray, 2001). Its luminosity is even higher than the Eddington luminosity for a accreting BH. Several different scenarios have been proposed to explain its origin, such as HMXBs powered by stellar mass BHs with anisotropic X-ray emission (“beaming” model, King et al., 2001) or with super-Eddington accretion rate/luminosity (due to photon bubble instability, Begelman, 2002) or with a combination of the two mechanisms (King, 2008). Accretion binaries with a BH mass of (IMBHs) can also be a possibility, however can hardly account for all the ULXs observed in the galaxies, but only the most luminous sources (with ). Here we introduce a parameter , i.e. “Begelman factor” (Rappaport, Podsiadlowski & Pfahl, 2004) to examine the allowed maximum super-Eddington accretion rate if powered by stellar mass BHs. In our basic model, is adopted as 100 for BH XRBs. We also reduce its value to 80, 50, 30, 10 and 5 (i.e., model M4), to examine its effect. On the other hand, NS accretors seem to provide at most several times the Eddington-limited luminosity (Levine et al., 1991, 1993; Grimm et al., 2003b; Rappaport et al., 2005; Fragos et al., 2008), here we adopt for NS XRBs as 5 and keep this assumption throughout.
(4) SN kicks
At the time of birth NSs and BHs receive a velocity kick due to any asymmetry in the supernova (SN)
explosions (Lyne & Lorimer, 1994). We assign a Maxwellian kick distribution with
a dispersion velocity of for newborn NSs in our basic model. For BHs, we scale down the natal kick by multiplying the kick by the fraction
of material which does not fall back onto the compact objects. Additionally, BHs
formed with small amounts of fall back () are assumed to
receive full kicks. In situations where BHs form silently (without a SN explosion) via direct collapse, we apply no
natal kick in our basic model (Fryer et al, 2012; Dominik et al., 2012). Moreover, for ECS NSs,
no natal kick is assumed since these are weak SN occurring for the lowest stars (, Hurley et al., 2000; Eldridge & Tout, 2004a, b; Belczynski et al., 2008).
We also construct several other models by varying the key input parameters, as listed in Table 1.
(1) Variations of the CE parameter can change the orbital separation of the binary considerably, resulting in different outcomes of the final evolution. However a reliable value for is difficult to estimate due to a lack of understanding of the complicated processes involved, although it is adopted extensively from 0.1 to 3.0 (e.g., Taam & Bodenheimer 1989; Tutukov & Yungelon 1993; Podsiadlowski, Rappaport & Han 2003) in the literature. Here we adopt in our basic model and change it to 1.0 (model M2) to examine its effect.
(2) Surveys of M dwarfs within 20 pc from the Sun have indicated that the binary fraction may be a function of stellar spectral types (Fischer & Marcy, 1992). For example, recent works by Lada (2006) and Kobulnicky & Fryer (2007) find that for G stars while for massive O/B stars in the Cygnus OB2 association. So we set in our basic model and modify it to (model M3) for comparison.
(3) Observations show that compact young massive clusters contain more massive stars preferentially (Sternberg, 1998; Smith & Gallagher, 2001), so we also make use of the IMF of Matteucci & Tornambè (1987, hereafter MT87, with power law slope of -1.3 in 0.08-1.0, but -1.95 in 1.0-80.0, model M6), which is more skewed towards high mass than in KROUPA01. For the mass of the secondary star (), a power-law distribution of is assumed, where . We adopt both the conventional choice of flat mass spectrum, i.e., (our basic model, M1, Mazeh et al., 1992; Goldberg & Mazeh, 1994; Shatsky & Tokovinin, 2002) and (model M5), since recent observations are more in accord with “twins” being a general feature of the close binary population (Dalton & Sarazin, 1995; Kobulnicky & Fryer, 2007).
(4) The kick velocity can affect not only the global velocity of the binary system (Zuo & Li, 2010) but also the outcome of the XRB evolution. Though the research on natal SN kicks has already had a long history (Bailes, 1989), its functional form of the underlying speed distribution is still poorly constrained. Measurements of proper motions for isolated radio pulsars indicate the typical kick speed is in excess of (Lyne & Lorimer, 1994; Hansen & Phinney, 1997; Cordes & Chernoff, 1998; Arzoumanian et al., 2002; Hobbs et al., 2005), however recent observation of NSs found in binaries seems to reveal that they receive a smaller natal kick (Pfahl et al., 2002; Belczynski et al., 2010b; Wong et al., 2010; Bodaghee et al., 2012), of the order of . So we also adopt (i.e., model M7, Hobbs et al., 2005), 190 (Hansen & Phinney, 1997), 170 (Belczynski et al., 2010b), 100 , and 50 (Bodaghee et al., 2012) for comparison.
(5) Stellar winds from massive stars show a number of puzzles contrasting observational and theoretical aspects. The two most prominent are the “wind clumping” (e.g., Osterbrock & Flather, 1959; Markova et al., 2004; Repolust et al., 2004; Lépine & Moffat, 2008) and “weak wind problem” (e.g., Chlebowski & Garmany, 1991; Kudritzki et al., 1991; Herrero et al., 2002). The former is related to the fact that mass loss rates might be twice overestimated since stellar winds might be forming dense clumps rather than being distributed uniformly. The latter suggests that wind mass loss rates from late O and early B type stars reveal a severe drop, by a factor of 100 than theoretically predicted. Based on this we reduce the wind mass loss rates by a factor of 2 to examine its effects (e.g., weak winds, model M8). This is done for all stars at all points in their nuclear evolution.
2.2 X-ray luminosity and source type
For super-giant/main-sequence (SG/MS) HMXBs we use the same methods to compute the keV X-ray luminosities and divide types of different sources as in Zuo & Li (2011). Accreting NS/BH in XRBs are powered by either disk fed by RLOF or stellar wind. When a star expands to fill its RL, a disk may form transferring masses to the compact star. Otherwise, wind accretion is needed to power an observable X-ray source. For wind accretion, we explore the classical Bondi & Hoyle (1944)’s formula to calculate the mass transfer rate to the compact star. In the RLOF case, we discriminate transient and persistent sources using the criteria of Lasota (2001, i.e., Eq 36 therein) for MS and red giant stars, and of Ivanova & Kalogera (2006, i.e., Eqs 20 and 24 therein) for white dwarf (WD) donors, respectively. For transient systems, the duty cycle (DC) is empirically thought to be less than 1% (Taam et al., 2000). We adopt DC=1% (probability of finding a system in outburst) in our calculations. The corresponding X-ray luminosity form is as follows:
| (7) |
where the bolometric luminosity (where is the average mass accretion rate), the bolometric correction factor converting the bolometric luminosity () to the keV X-ray luminosity (Belczynski et al., 2004), adopted as 0.4 though its range is for different types of XRB. is the ’Begelman’ factor to allow super-Eddington luminosities, as stated above. For transient sources the outburst luminosity is taken as a fraction () of the critical Eddington luminosity. We take for NS transients and for BH transients with orbital period less and longer than 1 day and 10 hr, respectively (Chen et al., 1997; Garcia et al., 2003; Belczynski et al., 2008).
We adopt a phenomenological way to define Be-XRBs as in Belczynski & Ziolkowski (2009). A HMXB is recognized as Be-XRB if: (1) it hosts NS accretors. We do not consider BH Be-XRBs since no such system has been found so far (Liu et al., 2005, 2006); (2) the donor should be massive () MS star (i.e., O/B star with burning H in its core); (3) accretion proceeds only via stellar wind (no RLOF); (4) only systems with orbital period in the range of 10-300 days are considered; (5) only a fraction of the above systems are designated as hosting a Be star, as this seems to be the fraction of Be stars among all regular B-type stars (, Slettebak, 1988; Ziolkowski, 2002; McSwain & Gies, 2005). So technically, we randomly selected only 25% () of the massive binaries hosting a B/O star to predict their numbers in our EPS calculations. The X-ray luminosities of Be-XRBs are estimated based on its orbital periods using Eq. 11 presented by Dai et al. (2006), the formula of which is obtained by fitting the observed data for 36 Be-XRBs compiled by Raguzova & Popov (2005). For Be transients, the outbursts are short-lived, typically covering a relatively small fraction of the orbital period (, Reig, 2011). Here we adopt an upper value to give the expected maximum source numbers.
3 Results and Discussion
Based on a population of compact sources, MGS constructed the average XLF of HMXBs in galaxies. The HMXB XLF they derived follows a power law with a slope of 1.6 in the broad luminosity range and shows a moderately significant evidence for a luminosity break or cut-off at . In addition, they did not find any significant features at the Eddington limit for NS or a stellar mass BH. Moreover when compared with each individual galaxy in their primary sample, which is normalized to their respective SFRs, there are still considerable dispersions in the amplitude (i.e., total number of HMXBs per unit SFR). Here we modeled the HMXB XLF from a theoretical point of view. The results are presented below.
3.1 Comparison with Mineo, Gilfanov & Sunyaev (2012) and model predictions
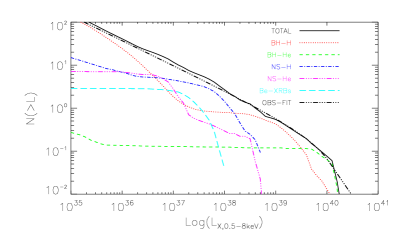
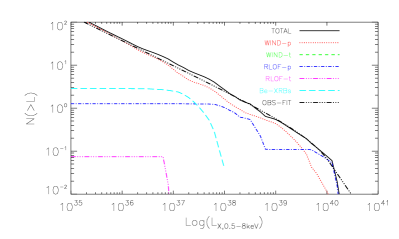
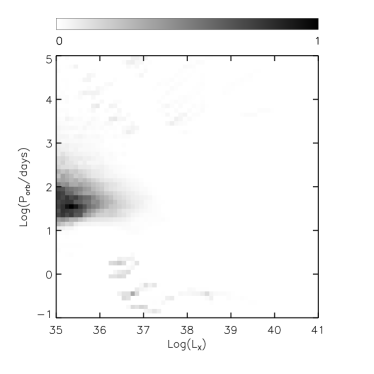
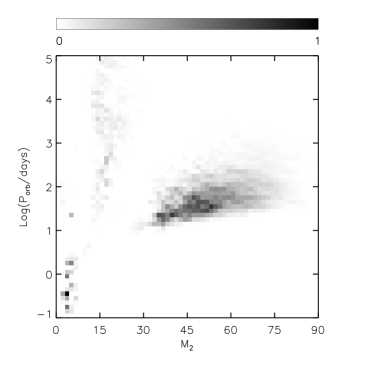
We adopted several models with different assumptions for the input parameters (see Table 1). Specifically the input parameters in our basic model (i.e., model M1) are SFH Myr, , , , and the KROUPA01 IMF, while other models are designed by changing only one parameter each time to test its effect. Fig. 1 shows the simulated cumulative XLF and its detailed components contributed by accreting NS/BH with hydrogen-rich (NS/BH-H) and helium-rich (NS/BH-He) MS/SG donors, and Be-XRBs (left panel) and accretion modes of simulated XRBs (right panel), respectively. Note that our simulated XLF can match the observed average XLF pretty well. One can see that BH-H systems dominate the XLF of both the very high luminosity () and low luminosity () end, while NS-H systems play a major role in the luminosity range of . Moreover they are mainly persistent sources (the transients are very rare). Our calculation shows that the BH-H ULX systems are contributed mainly by two species. They are all persistent sources, the majority of which are mainly wind-fed BH-XRBs with massive () SG donors (i.e., BH-SG HMXBs), whose orbital period is in the range of several thousands days to even hundreds of years, with a nearly flat eccentricity distributed from 0 to 1. The other specy is mainly RLOF-fed BH-XRBs, with less massive (typically ) MS donors, whose orbital period is much shorter, typically on the order of days. While BH XRBs at the low luminosity end are mainly wind-fed BH systems powered by higher mass () MS stars (i.e., BH-MS HMXBs), with orbital period from about months to days, as shown in Fig. 2 for the current orbital period (left) and (right) distribution, respectively. In addition, the Be-XRB population is predicted to be very small. It is mainly due to the low duty cycle transient characters of Be-XRBs relative to the long-term average of observed XLF, supporting the expectation by Bhadkamkar & Ghosh (2012).
We note that, quantitatively, our calculation is in general consistent with current HMXB population statistics. Our prediction that XRBs with luminosity larger than are mainly NS systems is in general consistent with observational statistics by Liu et al. (2006). The most luminous sources (for example ULXs) are predicted to be BH systems, which is also not in contradiction with current observation and theoretical expectations. The prediction that HMXB with naked He donor stars is relatively less than HMXB containing H-rich donors is also not at odds with current observational statistics (one He-HMXB confirmed in the Galaxy, i.e., Cyg X-3, van Kerkwijk et al. 1992, and another two extragalactic He-HMXBs IC10 X-1 and NGC300 X-1 confirmed by Crowther et al. 2003, 2010). The predicted ULX HMXBs usually have massive () donor stars, accreted by BHs in its SG phase, or less massive () MS donors accreted by BH in RLOF phase, which are very similar to the sources identified by Liu et al. (2002, i.e., NGC 3031 X-11), Roberts et al. (2001) and Liu et al. (2004, i.e., ULX in NGC 5204), Zampieri et al. (2004, i.e., NGC 1313 X-2), and Soria et al. (2005, i.e., NGC 4559 X-7). We also predict a preponderance of wind-fed BH HMXBs powered by massive MS stars in relative low luminosities () which has not yet been uncovered in nearby star-forming galaxies. Future high resolution X-ray and optical observations of this population may be used as a further test of the results obtained here.
To illustrate the formation and evolution of these BH HMXBs in detail, we present two example evolutionary sequences for , , , of BH-SG and BH-MS HMXBs in Figures 3 and 4, respectively. In Fig. 3, we consider a primordial binary system in a circular orbit. The initial stellar masses are 30.119 and 27.158 for the primary and secondary, respectively. The primary first evolves across the HG, expands and fills its RL in the core helium burning (CHeB) stage (time 6.3257 Myr), then transfers mass to the secondary star, which is still on the MS. As mass transfer proceeds the orbit of the system first shrinks slightly then expands to as the mass ratio gets flipped at the time of 6.5931 Myr until the binary gets detached again (time 6.9195 Myr). As the binary evolves the orbit of the system expands slightly until the time of 7.0079 Myr when the primary forms a BH (the CO core mass , hence partial fall-back with reduced natal kicks), the orbital separation of which is sharply increased to with a large eccentricity of . At this time, the system consists of a 6.50 BH and a massive () MS companion. Then the rejuvenated MS star, as the primary, evolves across the HG, expanding its radius to become a SG star at the time of Myr. At this time the SG donor which has extremely large radii () has sufficiently strong stellar winds to power a bright HMXB activity before SN explosion which results in another BH and the disruption of the binary system.
Next, we use a binary with initially , and , to give a quick illustration of BH-MS HMXB formation and evolution, as shown in Fig. 4. The primary fills its RL on its MS, and mass transfer proceeds as it evolves across HG till the end of CHeB, at which point (time 5.1369 Myr) it is a 12.632 naked HeMS star in a orbit with a 45.730 MS companion. Then the HeMS star evolves across the HeHG, and explodes at the time of 5.7680 Myr, leaving a 5.497 BH with a 45.327 MS companion in an orbit of 163.7139. The strong stellar wind from the MS star is then accreted by the BH at a moderately low rate compared with the SG case above, resulting in relatively low luminosity BH-MS XRBs powered by stellar wind. As the MS star evolves across the HG and fills its RL, the BH will spiral into its envelope due to the extremely large mass ratio, leading to a coalescence finally at the time of 8.4605 Myr, immediately after entering the CE phase.
We note that the above evolutionary sequence example may explain why BH binaries with massive MS donors can dominate at lower luminosities, rather than binaries with NS accretors. It is mainly because of the fact that the SN kicks the compact stars receive during SN explosion are quite different. As illustrated above, the BH in BH-MS HMXB always receives a small or no SN kick, which facilitates the survival of a wide binary, which would probably produce a faint HMXB. However it is not the case for NSs. Due to the much larger SN kicks, the NS is more likely to escape from its companion, leading to the disruption of the binary system. Or if survived luckily it may expand its orbit greatly, showing likely as Be/X-ray transients when active. However even so, such a channel is still insignificant when compared with BH-MS HMXBs, as already estimated.
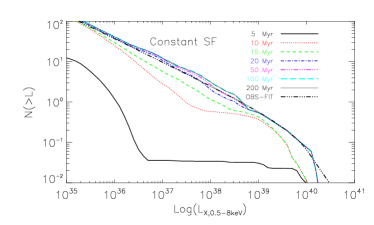
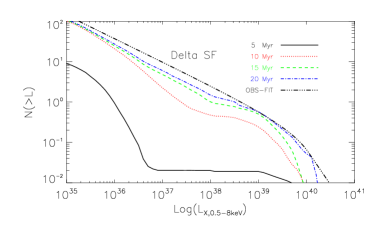
In Fig. 5, we show the evolution of XLF in our basic model, in order to study the nature of the sources, as well as its evolution. Both constant star formation (left) and a -function like star formation (right) cases are studied. We note that most of the sources are produced within 20 Myr after the star formation, which is in general agreement with observations (Swartz et al., 2009) and previous studies (Linden et al., 2010). We suggest that the short formation and lived time scale of sources may explain why the universal XLF should exist naturally in the star-forming galaxies. Additionally we see that the more recent star formation seems to have more luminous sources, resulting in a much flatter XLF at the high luminosity end. Our results are consistent with earlier observations (see Fabbiano, 2006, and references therein), revealing that the different or more complex XLFs are mainly because of the complexity and evolution of the X-ray source populations. Moreover the BH-MS HMXBs seem to emerge a little earlier than BH-SG HMXBs. This can be understood when considering the fact that the sources in both luminosity extremes have distinct formation channels. As illustrated above, we can see that the appearance of BH-MS sources always accompanies with the birth of the BH accretors, the progenitors of which have a shorter nuclear evolution timescale when compared to the BH-SG HMXBs, the occurrence of which while is mainly driven by the expanding of the less massive donor stars. However the SG donors have always much stronger stellar winds than MS stars, leading to much brighter BH-SG HMXBs when compared to BH-MS sources.
3.2 Effects of parameters on XLFs
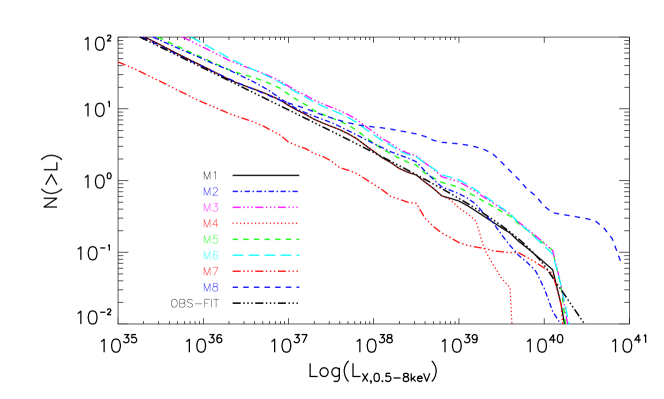
Fig. 6 shows XLFs for different models compared to our basic model M1 (solid line). Each model is chosen to examine the effect that each parameter has on both the shape and the absolute source number of the XLF. Several parameters have significant effects on either the shape or the source number or both of the XLFs, while others have only minor effects.
The parameters that have minor effects include the CE efficiency parameter (), and the initial mass ratio distribution of the secondary star, as shown by models M2 and M5, respectively. The parameter dictated how efficiently orbital energy is transformed into the kinetic energy that expels the donor’s envelope during the CE phase. It mainly affects the formation and evolution of binary systems which must go through a CE phase, such as low mass X-ray binaries (LMXBs) (Tremmel et al., 2013) and cataclysmic variables (Paczyński, 1976). However this is not the case for HMXBs, as the major formation channels of HMXBs do not involve CE phases as severely as LMXBs (Linden et al., 2010; Valsecchi et al., 2010). We also change to other values and forms (for details see Zuo & Li, 2013, and comparisons with the -algorithm). Changing the initial binary mass ratio from a flat distribution (model M1) to a “twins” distribution (model M5) has little effect on the XLF, although there is a slight increase in the number of bright HMXBs. This is because HMXBs require mass ratios close to one which is achieved by the “twins” model which forces mass ratios close to unity.
The binary fraction only affects the absolute source number of the XLF. As shown in Fig. 5 an increase of binary fraction (i.e., model M3) means more XRBs are produced, hence an overall shift of the XLF curve compared to that of the basic model. A flatter IMF (i.e., model M6) implies a larger number of massive stars, resulting in more compact objects compared to a steeper one. Hence a flatter IMF will results in more luminous HMXBs.
We suggest that the diversity of stellar components may explain the normalization dispersions of XLFs between galaxies. We note that the simulated star-forming galaxy in our basic model only represents a typical case for this kind of galaxies. While for each individual galaxy, it may have its specific stellar properties, such as different stellar mass distributions (for both the primary and the secondary), and different binary fractions. Our parameter studies (IMF, f and ) precisely support the idea that the normalization dispersion is of a physical origin, proposed by MGS. However we emphasize that the intrinsic physics governing the binary evolution should keep the same for binaries in these galaxies, as examined below.
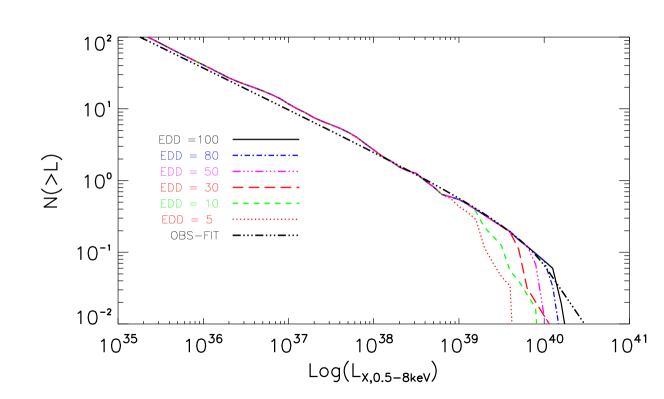
In model M4, a significant luminosity break emerges when decreasing the ’Begelman factor’ by a factor of 20 (dotted line in Figures 6 and 7, respectively). A similar trend has been found previously (Liu & Li, 2007; Linden et al., 2010). In order to better constrain the super-Eddington factor, we modify the ’Begelman factor’ to 80 (dash-dotted line), 50 (dash-dot-dotted line), 30 (long-dashed line), 10 (short-dashed line), respectively, as shown in Fig. 7. We note the luminosity break exists clearly even for as high as . This marked contrast with the observed smooth XLF implies that the actual maximum luminosities of accreting BHs can be as high as even times the corresponding Eddington luminosities, as suggested by Begelman (2002).
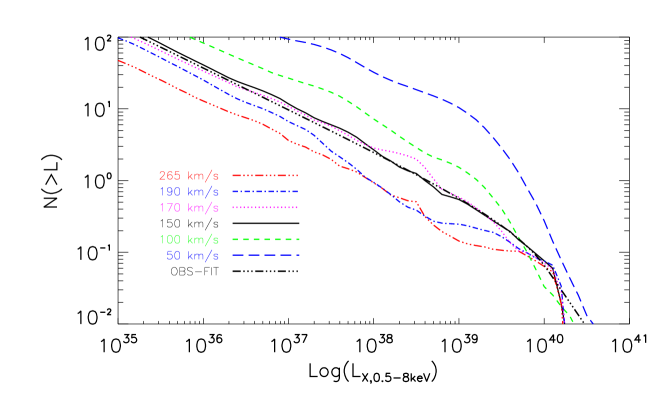
Increasing the dispersion velocity means that natal kicks of high magnitude are chosen more frequently from the Maxwellian distribution. As a consequence more binaries are disrupted during the SN explosions. This decreases the pool of potential HMXBs and may account for the smaller number of HMXBs in model M7 (dash-dot-dotted line) as shown in Figures 6 and 8, respectively. Additionally, a larger natal kick can move the wind-fed BH-MS HMXBs into a much wider orbit, too widely separated for stellar material to be effectively accreted onto the BH, resulting in much lower luminosities, and hence a smaller number of BH-MS XRBs in this luminosity range. This phenomenon is shown clearly in Fig. 8 where the dispersion of kick velocity is modified to 190 (dash-dotted line), 170 (dotted line), 100 (short-dashed line), and 50 (long-dashed line), respectively. We note that compared with our basic model the predicted number of low luminosity HMXBs decreases with increasing natal kicks, while smaller may increase the formation rate of HMXBs remarkably. Specifically, models with high natal kicks (i.e., model M7) predict significantly less HMXBs than are observed, while models with low natal kicks (i.e., ) predict too many HMXBs. Based on these results, we conclude that our models in which the natal kick velocity dispersion above or below are inconsistent with the observations. The typical kicks that match the observed HMXB XLF are on the order of . Using a similar method Belczynski et al. (2010b) proposed a comparable value of natal kick dispersion ( ) to match the observed intrinsic ratio of double and single recycled pulsars in the Galactic disc. Our finding is in general consistent with theirs. It is not surprising as isolated recycled pulsars and double neutron star (DNS) binaries are both presumably the descendant of NS HMXBs. Our conclusions may further support earlier findings that NSs formed in binaries receive significantly smaller natal kicks than the velocities of Galactic isolated pulsars would seem to indicate.
Stellar winds play an important role in the evolution of high mass stars in two major competing ways. A stronger stellar wind will increase the accretion rate of wind-fed HMXBs, making it more luminous. On the contrary, a weaker stellar wind will result in a larger pre-SN mass, and hence the formation of more numerous and more massive BHs. This may increase the luminosities of HMXB populations, as on the one hand, BH-XRBs can form stable RLO XRBs with more massive companions compared to NS-XRBs, and on the other hand, more massive BHs may drive higher accretion rate, and therefore higher luminosities. Comparing models M1 and M8, we can see that weaker stellar winds increase both the number and luminosity of bright HMXBs, so the latter effect is the dominant one. We note here that our findings are also consistent with the results obtained by Fragos et al. (2013) and Tremmel et al. (2013).
Our results are subject to some uncertainties and simplified treatments. For example, in our calculations, only HMXBs with stellar mass BHs are considered. However IMBH which is presumably formed through BH mergers may also show up as ULXs. Though it is expected to be significantly less frequent than stellar mass BHs, we should caution that, even only one of this kind of source may change the high luminosity tail of XLF significantly. A further careful modeling of IMBH considering dynamical formation processes may resolve this problem, however it is beyond the scope of this paper. On the other hand in the framework of stellar mass BHs, we may see that the ULX population can be generally accounted for by normal HMXBs, only in the case of mild super-Eddington accretion rate allowed. Additionally, since little is yet known about, either the detail SFH and IMF in star-forming galaxies, or key processes, such as the detailed accretion modes in XRBs, it is difficult to ascertain which parameter combinations are the best or most realistic by comparison with observations. For example, the normalization of the simulated XLF depends on the adopted values of several parameters, such as the bolometric correction factor and binary fraction . These two parameters show some degeneracy, and a slightly lower bolometric correction factor would favor a larger binary fraction. However the overall shape of the simulated XLF depends most strongly on two parameters: the natal kick dispersion and the allowed boost factor of super-Eddington accretion rate . The former, related to the binary interactions, determines the final outcome of the SN explosion. The latter is related to the accretion behavior, and constrains the location of the break in the XLF. They jointly determine the shape of the XLF. Conversely, the confirmed universal featureless XLF can make a good decision for the precise choice of the corresponding parameters.
4 SUMMARY
We have used an EPS code to model the universal featureless XLF of HMXBs in star-forming galaxies. We used the apparent universal XLF to constrain models of XRBs. Our study shows that the single, smooth power law XLF can be excellently reproduced with all models considered, but with two parameters strongly affecting its overall shape: the dispersion of natal kick velocity and the introduced parameter “Begelman factor” . The overall shape and normalization of HMXB XLF need the natal kick dispersion , which is generally consistent with the finding by Belczynski et al. (2010b) based on the statistics of double and single recycled pulsars. Our XLF modeling further strengthens earlier finding that NSs formed in close interacting binaries receive significantly smaller natal kicks than the velocities of Galactic single pulsars would indicate. The absence of features in the XLF near the critical Eddington luminosity of a NS or a stellar-mass BH and the cut-off luminosity at need the allowed boost factor of super-Eddington accretion rate as high as . Our results give strong supports for the suggestion by Grimm, Gilfanov & Sunyaev (2003a) that the bulk of ULXs may indeed be the high-luminosity extension of ordinary HMXBs which harbor stellar-mass BHs with mildly super-Eddington accretion rate, rather than exotic intermediate-mass objects. We present the detail components of HMXB populations which contribute to the observed XLF, and emphasize that the low luminosity sources of are mainly wind-fed BH systems powered by high mass () MS stars with orbital periods around months to days which have not yet been verified in nearby star-forming galaxies due to limited instrument capabilities. Our work motivates further high-resolution X-ray and optical observations of HMXB populations in nearby star-forming galaxies.
References
- Arzoumanian et al. (2002) Arzoumanian, Z., Chernoff, D. F., & Cordes, J. M. 2002, ApJ, 568, 289
- Bailes (1989) Bailes, M., 1989, ApJ, 342, 917
- Baldry & Glazebrook (2003) Baldry, I. K., & Glazebrook, K. 2003, ApJ, 593, 258
- Begelman (2002) Begelman, M. C., 2002, ApJ, 568L, 97
- Belczynski et al. (2008) Belczynski, K., Kalogera, V., Rasio, F. A., Taam, R. E., Zezas, A., Bulik, T., Maccarone, T. J., & Ivanova, N. 2008, ApJS, 174, 223
- Belczynski et al. (2004) Belczynski, K., Dalogera A., Zezas A., & Fabbiano, G., 2004, ApJ, 601, L147
- Belczynski & Taam (2004) Belczynski, K., & Taam, R. E. 2004, ApJ, 616, 1159
- Belczynski et al. (2010a) Belczynski, K., Bulik, T., Fryer, C., Ruiter, A., Valsecchi, F., Vink, J. S., & Hurley, J. R., 2010a, ApJ, 714, 1217
- Belczynski et al. (2010b) Belczynski, K., Lorimer, D. R., Ridley, J. P., & Curran, S. J., 2010b, MNRAS, 407, 1245
- Belczynski et al. (2012) Belczynski, K., Wiktorowicz, G., Fryer, C. L., Holz, D. E., & Kalogera, V., 2012, ApJ, 757, 91
- Belczynski & Ziolkowski (2009) Belczynski, K., & Ziolkowski, J. 2009, ApJ, 707, 870
- Bhadkamkar & Ghosh (2012) Bhadkamkar, H, & Ghosh, P., 2012 ApJ, 476, 22
- Bhadkamkar & Ghosh (2013a) Bhadkamkar, H, & Ghosh, P. 2013a, astro-ph/1301.1269
- Bhadkamkar & Ghosh (2013b) Bhadkamkar, H, & Ghosh, P. 2013b, astro-ph/1301.1283
- Bildsten & Deloye (2004) Bildsten, L., & Deloye, C. J. 2004, ApJ, 607, 119
- Bodaghee et al. (2012) Bodaghee, A., Tomsick, J. A., Rodriguez, J., & Berian James, J. 2012, 744, 108
- Bogomazov & Lipunov (2008) Bogomazov, A. I., & Lipunov, V. M. 2008, Astronomy Reports, 52, 299
- Bondi & Hoyle (1944) Bondi, H., & Hoyle, F. 1944, MNRAS, 104, 273
- Chen et al. (1997) Chen, W., Shrader, C. R., & Livio, M. 1997, ApJ, 491, 312
- Chlebowski & Garmany (1991) Chlebowski, T., & Garmany, C. D. 1991, ApJ, 368, 241
- Cordes & Chernoff (1998) Cordes, J. M., & Chernoff, D. F. 1998, ApJ, 505, 315
- Crowther et al. (2003) Crowther, P.A., Drissen, L., Abbott, J.B., Royer, P., Smartt, S.J. 2003, A&A, 404, 483
- Crowther et al. (2010) Crowther, P. A., Barnard, R., Carpano, S., Clark, J. S., Dhillon, V. S., Pollock, A. M. T. 2010, MNRAS, 403, 41
- Dalton & Sarazin (1995) Dalton, W. W., & Sarazin, C. L. 1995, ApJ, 448, 369
- Dai et al. (2006) Dai, H. L., Liu, X. W. & Li, X. D. 2006, ApJ, 653, 1410
- Dewi & Tauris (2000) Dewi, J. D. M., & Tauris, T. M., 2000, A&A, 360, 1043
- Dominik et al. (2012) Dominik, M., Belczynski, K., Fryer, C., Holz, D., Berti, E., Bulik, T., Mandel, I., & O’Shaughnessy R., 2012, ArXiv e-prints
- Eldridge & Tout (2004a) Eldridge, J., & Tout, C., 2004a, MNRAS, 348, 201
- Eldridge & Tout (2004b) Eldridge, J., & Tout, C., 2004b, MNRAS, 353, 87
- Fabbiano (2006) Fabbiano, G. 2006, ARA&A, 44, 323
- Fabbiano, Zezas & Murray (2001) Fabbiano, G., Zezas, A., & Murray, S. S., 2001, ApJ, 554, 1035
- Fischer & Marcy (1992) Fischer, D. A., & Marcy, G. W. 1992, ApJ, 396, 178
- Fragos et al. (2008) Fragos, T., et al., 2008, ApJ, 683, 346
- Fragos et al. (2009) Fragos, T., et al., 2009, ApJ, 702, 143
- Fragos et al. (2013) Fragos, T., Lehmer, B., Tremmel, M., Tzanavaris, P., Basu-Zych, A., Belczynski, K., Hornschemeier, A., Jenkins, L., Kalogera, V., Ptak, A., & Zezas, A. 2013, ApJ, 764, 41
- Fryer et al (2012) Fryer, C. L., Belczynski, K., Wiktorowicz, G., Dominik, M., Kalogera, V., & Holz D. E., 2012, ApJ, 749, 91
- Garcia et al. (2003) Garcia, M. R., Miller, J. M., McClintock, J. E., King, A. R., & Orosz, J. 2003, ApJ, 591, 388
- Ghosh & White (2001) Ghosh, P. & White, N. E. 2001, ApJ, 559, L97
- Goldberg & Mazeh (1994) Goldberg, D., & Mazeh, T. 1994, A&A, 282, 801
- Grimm, Gilfanov & Sunyaev (2003a) Grimm, H.-J., Gilfanov, M., & Sunyaev, R., 2003a, MNRAS, 339, 793
- Grimm et al. (2003b) Grimm, H., Gilfanov, M., & Sunyaev, R., 2003b, Chin. J. Astron. Astrophys. Suppl., 3, 257
- Hansen & Phinney (1997) Hansen, B., & Phinney, E., 1997, MNRAS, 291, 569
- Herrero et al. (2002) Herrero, A., Puls, J., & Najarro, F. 2002, A&A, 396, 949
- Hobbs et al. (2005) Hobbs, G., Lorimer, D. R., Lyne, A. G., & Kramer, M., 2005, MNRAS, 360, 963
- Hurley et al. (2000) Hurley, J. R., Pols, O. R., & Tout, C. A., 2000, MNRAS, 315, 543
- Hurley et al. (2002) Hurley, J. R., Tout, C. A., & Pols, O. R., 2002, MNRAS, 329, 897
- Iben & Livio (1993) Iben, Jr. I., & Livio, M. 1993, PASP, 105, 1373
- Ivanova & Kalogera (2006) Ivanova, N., & Kalogera, V. 2006, ApJ, 636, 985
- Kiel & Hurley (2006) Kiel, P.D., & Hurley, J.R., 2006, MNRAS, 369, 1152
- King et al. (2001) King, A. R., Davies, M. B., Ward, M. J., Fabbiano, G., & Elvis, M., 2001, ApJL, 552, 109
- King (2008) King, A. R., 2008, MNRAS, 385L, 113
- Kobulnicky & Fryer (2007) Kobulnicky, H. A., & Fryer, C. L. 2007, ApJ, 670, 747
- Kroupa (2001) Kroupa, P. 2001, MNRAS, 322, 231
- Kucinskas (1999) Kucinskas, A. 1999, Ap&SS, 262, 127
- Kudritzki et al. (1991) Kudritzki, R. P., Puls, J., Gabler, R., & Schmitt, J. H. M. M. 1991, in Extreme Ultraviolet Astronomy, ed. R. F. Malina & S. Bowyer, 130
- Lada (2006) Lada, C. J. 2006, ApJ, 640, L63
- Lammers et al. (1995) Lamers, H. J., Snow, T. P., & Lindholm, D. M., 1995, ApJ, 455, 269
- Lasota (2001) Lasota, J. P. 2001, New Astronomy Reviews, 45, 449
- Lépine & Moffat (2008) Lépine, S., & Moffat, A. F. J. 2008, AJ, 136, 548
- Levine et al. (1993) Levine, A., Rappaport, S., Deeter, J. E., Boynton, P. E., & Nagase, F. 1993, ApJ, 410, 328
- Levine et al. (1991) Levine, A., Rappaport, S., Putney, A., Corbet R., & Nagase F. 1991, ApJ, 381, 101
- Linden et al. (2010) Linden, T., kalogera, V., Sepinsky, J. F., Prestwich, A., Zezas, A., & Gallagher, J. S. 2010, The Astrophysical Journal, 725, 1984
- Linden et al. (2011) Linden, T., Sepinsky, J. F., kalogera, V., & Belczynski, K. 2009, ApJ, 699, 1573
- Lipunov et al. (2009) Lipunov, V. M., Postnov, K. A., Prokhorov, M. E., & Bogomazov, A. I. 2009, Astronomy Reports, 53, 915
- Liu et al. (2002) Liu, J. F., Bregman, J.N., Seitzer, P. 2002, ApJ, 580, L31
- Liu et al. (2004) Liu, J. F., Bregman, J.N., Seitzer, P. 2004, ApJ, 602, 249
- Liu et al. (2005) Liu, Q. Z., van Paradijs, J., & van den Heuvel, E. P. J. 2005, A&A, 442, 1135
- Liu et al. (2006) Liu, Q. Z., van Paradijs, J., & van den Heuvel, E. P. J. 2006, A&A, 455, 1165
- Liu & Li (2007) Liu, X. W., & Li, X. D., 2007, ChJA&A, 7, 389
- Loveridge et al. (2011) Loveridge, A. J., van der Sluys, M. V., & Kalogera V., ApJ, 2011, 743, 49
- Luo et al. (2012) Luo, B., et al. 2012, ApJ, 749, 130
- Lü et al. (2012) Lü G. L., Zhu, C. H., Postnov, K. A., Yungelson, L. R., Kuranov, A. G., Wang, N., 2012, MNRAS, 424, 2265
- Lyne & Lorimer (1994) Lyne, A. G., & Lorimer, D. R., 1994, Nature, 369, 124
- Markova et al. (2004) Markova, N., Puls, J., Repolust, T., & Markov, H. 2004, A&A, 413, 693
- Matteucci & Tornambè (1987) Matteucci, F., & Tornambè A., 1987, A&A, 185, 51
- Mazeh et al. (1992) Mazeh, T., Goldberg, D., Duquennoy, A., & Mayor, M. 1992, ApJ, 401, 265
- McSwain & Gies (2005) McSwain, M. V., & Gies, D. R. 2005, ApJS, 161, 118
- Mineo, Gilfanov & Sunyaev (2012) Mineo S., Gilfanov M., & Sunyaev R., 2012, MNRAS, 419, 2095 (MGS)
- Osterbrock & Flather (1959) Osterbrock, D., & Flather, E. 1959, ApJ, 129, 26
- Paczyński (1976) Paczyński B., 1976, in Eggleton P., Mitton S., Whelan J. (eds.) Structure and Evolution in Close Binary Systems. Proc. IAU Symp. 73, Reidel, Dordrecht, p. 75
- Pfahl et al. (2002) Pfahl, E., Rappaport, S., Podsiadlowski, P., & Spruit, H., 2002, ApJ, 574, 364
- Piro & Bildsten (2002) Piro, A. L., & Bildsten, L. 2002, ApJ, 571, 103
- Podsiadlowski et al. (2003) Podsiadlowski, P., Rappaport, S. A., & Han, Z. 2003, MNRAS, 341, 385
- Podsiadlowski et al. (2004) Podsiadlowski, P., Langer, N., Poelarends, A. J. T., Rappaport, S., Heger, A., & Pfahl, E. 2004, ApJ, 612, 1044
- Postnov (2003) Postnov, K., 2003, Astr Let, 29, 372
- Raguzova & Popov (2005) Raguzova, N. V., & Popov, S. B. 2005, Astron. Astrophys. Trans., 24, 151
- Rappaport, Podsiadlowski & Pfahl (2004) Rappaport, S. A., Podsiadlowski, P., & Pfahl, E., 2004, MNRAS, 361, 971
- Rappaport et al. (2005) Rappaport, S. A., Podsiadlowski, P., & Pfahl, E., 2005, MNRAS, 356, 401
- Reig (2011) Reig, P. 2011, Ap&SS, 332, 1
- Remillard & McClintock (2006) Remillard, R.A., & McClintock, J.E. 2006, ARA&A, 44, 49
- Repolust et al. (2004) Repolust, T., Puls, J., & Herrero, A. 2004, A&A, 415, 349
- Revnivtsev et al. (2011) Revnivtsev, M., Postnov, K., Kuranov, A., & Ritter, H. 2011, A&A, 526, 94
- Roberts et al. (2001) Roberts, T. P., Goad, M. R., Ward, M. J., Warwick, R. S., O’Brien, P. T., Lira, P., Hands, A. D. P. 2001, MNRAS, 325, L7
- Roberts & Warwick (2000) Roberts, T., & Warwick, R., 2000, MNRAS, 315, 98
- Shao & Li (2013) Shao, Y., & Li, X. D. 2013, in preparation
- Shatsky & Tokovinin (2002) Shatsky, N., & Tokovinin, A. 2002, A&A, 382, 92
- Slettebak (1988) Slettebak, A. 1988, PASP, 100, 770
- Smith & Gallagher (2001) Smith, L. J., & Gallagher, J. S. 2001, MNRAS, 326, 1027
- Smith & Wilson (2003) Smith, D. A., & Wilson, A. S. 2003, ApJ, 591, 138
- Soria et al. (2005) Soria, R., Cropper, M., Pakull, M., Mushotzky, R., & Wu, K. 2005, MNRAS, 356, 12
- Sternberg (1998) Sternberg, A., 1998 ApJ, 506, 721
- Swartz et al. (2009) Swartz, D. A., Tennant, A. F., & Soria, R. 2009, ApJ, 703, 159
- Taam & Bodenheimer (1989) Taam, R., & Bodenheimer, P. 1989, ApJ, 337, 849
- Taam et al. (2000) Taam, R. E., King, A. R., & Ritter, H. 2000, ApJ, 541, 329
- Tremmel et al. (2013) Tremmel, M., Fragos, T., Lehmer, B. D., Tzanavaris, P., Belczynski, K., Kalogera, V., Basu-Zych, A. R., & Farr W. M., et al., 2013, ApJ, 766, 19
- Tutukov & Yungelon (1993) Tutukov, A. V., & Yungelon, L. R. 1993, MNRAS, 260, 675
- Tzanavaris et al. (2013) Tzanavaris, P., et al. 2013, ApJ, 774, 136
- Valsecchi et al. (2010) Valsecchi, F., Glebbeek, E., Farr, W. M., Fragos, T., Willems, B., Orosz, J. A., Liu, J., & Kalogera, V. 2010, Nature, 468, 77
- Van Bever & Vanbeveren (2000) Van Bever, J., & Vanbeveren, D. 2000, A&A, 358, 462
- van der Marel (2004) van der Marel R. P., 2004, in Ho L., ed., Coevolution of Black Holes and Galaxies, Cambridge Univ. Press, p. 37
- van der Sluys et al. (2006) van der Sluys, M. V., Verbunt F., & Pols O. R., 2006, A&A, 460, 209
- van Kerkwijk et al. (1992) van Kerkwijk, M. H. et al. 1992, Nature, 355, 703
- van Paradijs (1983) van Paradijs, J. 1983, in Accretion Driven Stellar X-ray Sources, ed. W. H. G. Lewin, & E. P. J. van den Heuvel, Cambridge, 189
- Vink et al. (2001) Vink, J. S., de Koter, A., & Lamers, H. J. G. L. M., 2001, A&A, 369, 574
- Webbink (1984) Webbink, R.F., 1984, ApJ, 277, 355
- Weisskopf et al. (2000) Weisskopf, M.C., Tananbaum, H.D., Van Speybroeck, L.P., & O’Dell S.L., 2000. Proc. SPIE, 4012, 2
- White & Ghosh (1998) White, N. E. & Ghosh, P. 1998, ApJ, 504, L31
- Wu K. (2001) Wu K., 2001, PASA, 18, 443
- Wong et al. (2010) Wong, T.-W., Willems, B., & Kalogera, V. 2010, ApJ, 721, 1689
- Xu & Li (2010) Xu, X. J., & Li X. D., 2010, ApJ, 716, 114
- Zampieri et al. (2004) Zampieri, L., Mucciarelli, P., Falomo, R., Kaaret, P., Di Stefano, R., Turolla, R., Chieregato, M., Treves, A. 2004, ApJ, 603, 523
- Zezas Georgantopoulos & Ward (1999) Zezas, A., Georgantopoulos, I., & Ward, M. J., 1999, MNRAS, 308, 302
- Ziolkowski (2002) Ziolkowski, J. 2002, MmSAI, 73, 1038
- Zuo et al. (2008) Zuo, Z. Y., Li, X. D., & Liu, X. W. 2008, MNRAS, 387, 121
- Zuo & Li (2010) Zuo, Z. Y., & Li, X. D. 2010, MNRAS, 405, 2768
- Zuo & Li (2011) Zuo, Z. Y., & Li, X. D. 2011, ApJ, 733, 5
- Zuo & Li (2013) Zuo, Z. Y., & Li, X. D. 2013, in preparation
| Model | P(q) | IMF | winds | ||||
|---|---|---|---|---|---|---|---|
| M1 | 0.5 | KROUPA01 | 0.5 | 100 | 150 | STD | |
| M2 | 1.0 | KROUPA01 | 0.5 | 100 | 150 | STD | |
| M3 | 0.5 | KROUPA01 | 0.8 | 100 | 150 | STD | |
| M4 | 0.5 | KROUPA01 | 0.5 | 5 | 150 | STD | |
| M5 | 0.5 | KROUPA01 | 0.5 | 100 | 150 | STD | |
| M6 | 0.5 | MT87 | 0.5 | 100 | 150 | STD | |
| M7 | 0.5 | KROUPA01 | 0.5 | 100 | 265 | STD | |
| M8 | 0.5 | KROUPA01 | 0.5 | 100 | 150 | WEAK |


5 APPENDIX A
Rather than a constant value adopted conventionally, a critical mass ratio determining the allowed parameter space for stable mass transfer in the plane is developed recently by Shao & Li (2013). For a specific binary consisting of a massive primary star and a less massive secondary, if is initially too short, the orbital separation will always decrease with mass transfer, a sufficiently dense gas flow may exceed the Roche lobe, leading to a CE phase. On the other hand, if the is too long, the primary may have climbed to the (super)giant branch and developed a deep convective envelope around the compact core prior to mass exchange, a runaway mass transfer will happen, leading to the CE evolution. Thus for each mass ratio , there exist both upper and lower limits of the orbital period ( and ), between which the binary can evolve smoothly with stable mass transfer on thermal timescale.
Shao & Li (2013) provide two choices of metallicity ( and ). In our cases, the higher and more appropriate value, i.e., is adopted, the grid of which we believe can be used without too much loss in accuracy. The corresponding upper and lower limits of orbital period ( and ) for a certain mass ratio are fitted as a function of initial primary mass () in the form of binomial:
coefficients of which are listed in Table 2. The upper part of Table 2 is for lower limits, with eleven discrete values of in the range of 2 to 12. The upper limits of orbital period for each are very similar, so we give only one rough fitting, the coefficients of which are listed in the lower part of Table 2 (labeled as ’ALL’).
| q | ||||||
|---|---|---|---|---|---|---|
| 2 | -7.55E-1 | 4.577E-1 | -2.06E-2 | 3.88E-4 | -2.57E-6 | |
| 2.5 | -1.955E+0 | 1.026E+0 | -4.937E-2 | 9.36E-4 | -6.14E-6 | |
| 3 | -3.278E+0 | 1.565E+0 | -6.628E-2 | 1.07E-3 | -6.01E-6 | |
| 3.5 | 2.4E-1 | 4.05E-1 | 1.299E-1 | 6.44E-3 | 1.06E-4 | -5.75E-7 |
| 4 | -1.341E+1 | 5.232E+0 | -1.496E-1 | 1.144E-3 | ||
| 4.5 | 1.143E+2 | -1.997E+0 | 4.168E-3 | |||
| 5 | 1.612E+2 | -2.44E+0 | -6.85E-4 | |||
| 6 | 1.911E+2 | 1.558E+1 | -6.27E-1 | 5.35E+3 | ||
| 8 | 5.8938E+3 | -1.9817E+2 | 1.6907E+0 | |||
| 10 | 3.96712E+4 | -1.38555E+3 | 1.2168E+1 | |||
| 12 | 7.86627E+4 | -2.64895E+3 | 2.2478E+1 | |||
| ALL | 8.9493E+0 | -2.7841E+3 | 6.285E-1 | 2.7E-3 |