Search for Neutron Flux Generation in a Plasma Discharge Electrolytic Cell
Abstract
Following some recent unexpected hints of neutron production in setups like high-voltage atmospheric discharges and plasma discharges in electrolytic cells, we present a measurement of the neutron flux in a configuration similar to the latter. We use two different types of neutron detectors, poly-allyl-diglicol-carbonate (PADC, aka CR-39) tracers and Indium disks. At 95% C.L. we provide an upper limit of 1.5 neutrons cm-2 s-1 for the thermal neutron flux at cm from the center of the cell. Allowing for a higher energy neutron component the largest allowed flux is 64 neutrons cm-2 s-1. This upper limit is two orders of magnitude smaller than what previously claimed in an electrolytic cell plasma discharge experiment. Furthermore the behavior of the CR-39 is discussed to point our possible sources of spurious signals.
pacs:
52.80.Wq, 24.10.-i, 28.20.-v, 29.40.WkThe possibility that completely new sources of neutrons could be devised and exploited is a topic of paramount importance on both the applicative and theoretical grounds. Some impressive hints on neutron production in high-voltage atmospheric discharges are reported in a recent paper fulmini as well as production of neutrons in plasma discharges in electrolytic cells are discussed in Cirillo . Great resonance had also the approval of the patent patent similarly claiming the existence of a neutron producing electrolytic cell.
We focus here on an experimental set-up similar to the one discussed in Cirillo ; patent albeit the underlying physical mechanisms could be in common with Refs. fulmini , the so called Low Energy Nuclear Reactions (LENR).
From the theoretical point of view, there is an open debate on whether inverse- nuclear transmutations could justify such observations Widom ; Ciuchi . Experiments are therefore needed to guide the research in the field. To this aim, we have reproduced the experimental setup of Ref. Cirillo and searched for a neutron flux with two different detection techniques: the CR-39 detectors, also used in the experiment on atmospheric discharges fulmini and Indium activation, commonly used in neutron flux measurements. A dedicated effort was devoted to understanding the behavior of the CR-39 detectors.
The experimental setup. The two main elements of this measurement are the electrolytic cell and the neutron detectors. For reasons that will be evident after the results are presented, the experiment consisted of three data-taking campaigns, Run1, Run2 and Run3, that took place in February-March, June, and September 2013, respectively. The experimental setup and the changes between the campaigns will be discussed in the following.
The electrolytic cell. Plasma electrolysis can be considered an hybrid between the conventional electrolysis process and the atmospheric-pressure plasma production. In aqueous solutions the electrochemical process can produce plasma with applied voltages of at least V.
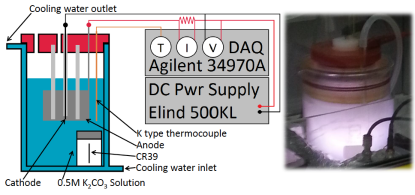
The electrochemical cell we use (see Fig. 1) consists of a water cooled pyrex vessel with the anodic and the cathodic areas separated by a quartz cylinder of 45 mm inner diameter, 4 mm thick. The anode consists of a cylindric grid of titanium plated with platinum positioned outside the quartz cylinder, while the tungsten cathode is a pipe having outer diameter of 2 mm and lateral wall thickness of 1.4 mm during Run1 or a cylindrical rod with a diameter of 2.1 mm during Run2 and Run3. The cathode is partially covered by a quartz tube, in order to reduce its conductive active area, thus increasing the electric impedance of the electrochemical system. This makes the plasma discharge rise at the electrolyte-cathode interface. The electrolyte consists of 1.16 liters of 0.5M K2CO3 aqueous solution.
The cell is covered with an araldite cap having two passages, through which the gases produced both in the cathodic zone (hydrogen and oxygen basically produced by plasma discharge) and in the anodic zone (oxygen only from the Faradic current) are separately collected. We use a bubble flowmeter to measure the anodic gas flux and from it we derive the Faradic current. The experiment has been performed in voltage-control conditions. The power supplier is an Elind model 500KL2,4/6. The acquisition system is composed by an Agilent 34970A data logger and by a National Instruments NIDAQPad-6015. Electrolyte temperature has been measured by a K type thermocouple.
Plasma formation has been observed (see Fig. 1) within a voltage range from 150 V to 300 V, with current ranging from 1.5 A to 3.0 A. The average oxygen flow value was measured to be cm3 s-1, corresponding to a Faradic current of 0.25 A. The exceeding current is responsible for plasma discharge formation.
The neutron detectors. To detect the neutron flux, two different types of detectors were used: poly-allyl-diglicol-carbonate (PADC, CR-39 in the following) track detectors and Indium disks. To optimize their sensitivity they were located close to the cathode, where the plasma is produced, i.e. 5 cm when placed outside the cell, 2 cm when inside.
The CR-39 detectors. The CR-39 detectors produced by Intercast used in this tests are intrinsically sensitive to fast neutrons that produce tracks on them. Thermal neutrons can also be detected by wrapping the detectors in Boron: the reaction generate particles of MeV that create tracks in CR-39.
The samples used during the Run1 campaign belonged to a different stock than those used during the Run2 and Run3 campaigns. Each stock is expected to have different sensitivities and background levels and will be considered separately in the following. The CR-39 detectors were coupled with a thin (50m) layer of pure 10B . Furthermore, since in the original experiment Cirillo the CR-39 detectors were completely covered by a thick layer of boric acid, we also used some of the Run1 detectors with a cm thick surrounding layer of Boron.
To estimate the number of neutrons that traversed the detector since its production, the CR-39 slabs are etched for 90 min in a 6.25 N KOH solution at 70oC. The number of tracks consistent with particles is then estimated with an in-house automated reader consisting of an epi-illumination microscope on which a 8 Mpixel CCD camera is mounted bedogni . Such number, divided by the detector area (2.224 cm2), yields the track density ().
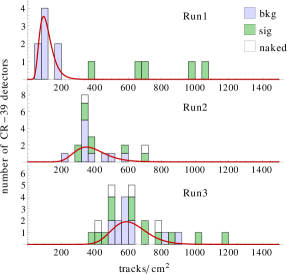
Spurious signals or ambient backgrounds are subtracted by analyzing a set of detectors not exposed to the neutron source under study. The distributions of in the three background samples used in this study and described later are shown in Fig. 2. Indicating with the mean value of on such detectors we estimate the neutron flux on the irradiated detectors as where is the duration of the exposure. The calibration constant was obtained separately for the two stocks of detectors by exposing part of the detectors to a calibrated thermal neutron flux of at the Casaccia ENEA-INMRI facility for different exposure times.
There are four systematic error contributions to such measurements: the Poisson fluctuations of the number of observed tracks, a 10% uncertainty on the number of tracks due to the counting process, the uncertainty on the calibration , and the propagation of the error on . When quoting the measured fluxes all errors will be summed in quadrature.
We also estimated the compatibility of irradiated samples with the background: we first fit the measured distributions on background with a log-normal distribution, , with bedogni2 and then we estimate the probability of a measured value of to be consistent with the background to be .
To quantify the sensitivity of a negative result, when we also compute, with a bayesian approach, the minimum neutron flux that is inconsistent with the measured track density at 95% C.L., .
The Indium disks. If exposed to a neutron flux the Indium produces, by the 115In(n,)116In transition, mainly 1293, 1097, and 416 keV lines with a half life of 54 minutes. The photon production cross-section depends on the energy of the neutrons, ranging from 1.5 barn for the expected spectrum from partially moderated fast neutrons (”PM” in the following) to barn for thermal neutrons.
Indium disks of a diameter of 5 cm and 30 g total mass are therefore used as neutron detectors with a two stages process: they are first exposed to a potential neutron flux and then their activity is measured by means of a high purity absolutely calibrated germanium detector of 60% efficiency. In absence of prior knowledge of the neutron spectrum, the conversion between the measured activity and the neutron flux is established by exposing the disks to a moderated AmBe neutron source of known rate (n/s ) and by correcting for the decay times of the Indium isotopes. In case no signal is observed, the 95% C.L. upper limit on the photon rate, and therefore on the neutron flux, is computed from the background level, the germanium detector efficiency and the conversion factors.
As a check, an Indium disk and a CR-39 detector were also simultaneously exposed to the neutrons produced by a n/s AmB neutron source placed at the cathode of the electrolytic cell filled with water and not powered. The comparison with detailed simulations confirmed the calibration of the Indium technique, while the consistency between Indium disks and CR-39 detectors within 30% showed that within this range the calibration of the CR-39 detectors holds up to PM neutrons.
We will report upper limits computed assuming a thermal neutron flux. In case of a PM neutron spectrum the limits would be a factor 40 larger.
| Run | Duration | Voltage Range | n-flux (In) | n-flux (CR-39) |
| [’] | [V] | [n cm-2 s-1] | [n cm-2 s-1] | |
| 1A | 8 | 150-200 | (ins.) | |
| (ins.) | ||||
| 1B | 5 | 250 | ||
| 1C | 12 | 150-200 | (ins.) | |
| 1D | 4 | 150-300 | (ins.) | |
| 2 | 13 | 220-300 | , | |
| , (Al) | ||||
| , (Cd) | ||||
| 3A | 20 | 150 | , | |
| (Al) | ||||
| , (Cd) | ||||
| 3B | 21 | 200-300 | , | |
| , (Cd) | ||||
| (Al) |
Results of the Run1 data taking. In our first experimental campaign the CR-39 detectors were calibrated by exposing three sets of three detectors at the ENEA-INMRI thermal neutron facility for 1, 2, and 5 minutes respectively. The background was estimated from a sample of eight detectors that were not irradiated and not wrapped with boron and that were analyzed at the same time as the calibration samples. From a linear fit to the dependence of the measured tracks density after background subtraction on the known neutron flux, the calibration constant is estimated to be tracks/neutrons.
At the same time, CR-39 detectors covered with a thick boron coating were exposed to the calibration flux, but no significant signal was observed: the Boron indeed absorbs the neutrons and stops the particles. This observation contrasts with the measurement of neutron fluxes made in a similar configuration in Ref. Cirillo .
Several weeks afterwards we performed four different runs where we placed neutron detectors both close to the electrolytic cell and inside it. The runs differed by voltage applied to the cell, by duration, and by type and number of CR-39 detectors located inside and outside the cell. During two of these runs we also used the Indium disks. The results are summarized in Tab. 1, where a letter is appended to Run1 to distinguish among the configurations. In analyzing the results we used the same background estimated for calibration, which means that the exposed detectors were analyzed 40 days after the corresponding background ones.
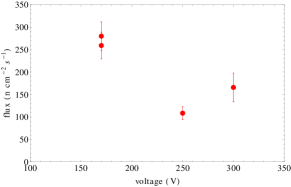
As shown in Tab. 1 and Fig. 2, the detectors presented a small but significant deviation from the background. Such deviation did not show any dependence on whether the detector was placed inside or outside the cell, nor on the voltage (see Fig. 3). Even attributing this excess to neutrons produced in the cell, the measured fluxes range between 110 and 280 neutrons cm-2 s-1, incompatibly with the neutrons cm-2 s-1 reported in Ref. Cirillo .
Indium disks instead never measured any signal, establishing that the thermal (fast) neutron flux is smaller than 1.5 (64) neutrons cm-2 s-1 at 95% C.L.
CR-39 background studies The inconsistency between the results obtained with the CR-39 and the Indium techniques led us to further investigate the background subtraction in the analysis of the CR-39 detectors. In the Run1 analysis the background was treated differently from the signal because it had not been wrapped with boron and it was analyzed 40 days before the exposed detectors.
To this aim, in the Run2 and Run3 campaigns the background detectors were covered with the thin boron film and analyzed simultaneously with the exposed detectors. Furthermore, we studied the time evolution of the background by measuring it at a distance of 60 days. Fig. 2 shows a significant increase of background with time (from Run2 to Run3) that we estimated to be tracks cm-2 day-1.
Furthermore, we have left some detectors without boron. As it can be seen in Fig. 2, where they are marked as “naked”, such detectors behave like the background. This suggests that the background is not due to thermal neutrons, but rather to cosmic rays (that arrive at a rate of particles cm-2 day-1) or by natural neutrons, that have a similar rate AtmNeu . Assuming the same calibration as thermal neutrons, tracks/neutron, the observed neutron flux would be 460 neutrons cm-2 day-1. We therefore conclude that such background increases with time at a rate that can easily cause significant systematic errors if not properly accounted for. On this basis, we considered flawed the results of the CR-39 detectors during the Run1 data taking and repeated the experiment.
Results of the Run2 and Run3 data taking. We have performed the last two data-taking campaigns with the same setup but separated by two months, paying attention to a consistent treatment of exposed and background detectors. To study the nature of a possible excess, we have wrapped some of the detectors in aluminum (to screen electromagnetic radiation) and Cadmium (to screen thermal neutrons). The calibration constant used is tracks/neutrons, see above.
The results of both the CR-39 and the Indium detectors, summarized in Tab. 1 and Fig. 2, show that the exposed detectors yield tracks densities consistent with the background. The only two outliers are those that were wrapped in aluminum during Run3, as though the wrapping could cause some spurious tracks. Considering conservatively the detector with the largest deviation from the background, we set a limit on the neutron flux neutrons cm-2 day-1 from the CR-39 detectors and neutrons cm-2 day-1 from the Indium disks under the assumption that the neutron spectrum is thermal (PM).
Conclusions. We have searched for neutron production in plasma discharges inside an electrolytic cell, with the attempt of reproducing the results reported in Ref. Cirillo with two different types of detectors, CR-39 tracers, as in the original experiment, and Indium disks. The results found and the techniques used are of relevance also to the experiment discussed in fulmini as the underlying physics of neutron production could be the same.
Since Indium disks never showed a signal, we conclude that the produced neutron flux is smaller than 1.5 (64) neutrons cm-2 s-1 at 95% C.L. assuming thermal (PM) neutrons. From the measurements with CR-39 detectors in Run2 and Run3, when the background was treated properly, we can exclude fluxes larger than 105 neutrons cm-2 s-1 at 95% C.L. Such limits are at least two orders of magnitude smaller than the measured fluxes in Ref. Cirillo (72000 neutrons cm-2 s-1).
The initial inconsistency between the results from Indium disks and CR-39 detectors lead us to study the behavior of the latter in detail. We have first verified, contrarily to Ref. Cirillo , that if the layer of boron in which they are immersed is larger than hundreds of m the sensitivity to thermal neutrons is lost. Next, we demonstrated that CR-39 detectors, regardless of the presence of Boron, integrate tracks cm-2 day-1, likely due to cosmic radiation. It is therefore critical to pay attention to the treatment of the background, since a delay in analyzing the irradiated detectors with respect to the background ones could lead to false positives.
We confirmed that non-irradiated CR-39 show long tails in the track density bedogni2 and we noted a small signal in detectors wrapped in aluminum. Therefore, especially when very low neutron fluxes are expected, the use of CR-39 detectors should be accompanied by careful consideration of disturbing effects. In addition, each batch of CR-39 detectors needs an individual characterization in terms of background distribution and calibration curve.
Acknowledgements. We thank L. Maiani and G. Ruocco for stimulating discussions and S. Loreti(INMRI-ENEA, Rome, Italy) for the CR-39 calibration .
References
- (1) A.V. Agafonov et al., Phys. Rev. Lett. 111, 115003 (2013).
- (2) D. Cirillo, R. Germano, V. Tontodonato, A. Widom, Y.N. Srivastava, E. Del Giudice, and G. Vitiello, Key Engineering Materials 495, 104 (2012).
- (3) Patent US 8419919 B1, “System and methods for generating particles”. See also patent WO 1999049471 A1, “Reactor for producing energy and neutrons by electrolytic reaction in light- or heavy- water solution”.
- (4) A. Widom and L. Larsen, Eur. Phys. J. C 46, 107 (2006); See also Y. N. Srivastava, A. Widom and L. Larsen, arXiv:0810.0159 [nucl-th]; A. Widom, Y. N. Srivastava and L. Larsen, arXiv:0804.2647 [nucl-th]; A. Widom, Y. N. Srivastava and L. Larsen, arXiv:0709.1222 [nucl-th]; A. Widom and L. Larsen, nucl-th/0608059.
- (5) S. Ciuchi, et al., Eur. Phys. J. C 72, 2193 (2012);
- (6) R. Bedogni, et al, Radiat. Meas. 43, S491 (2008);
- (7) R. Bedogni, et al, Radiat. Meas. 43, 1108 (2008);
- (8) M. S. Gordon, et al., IEEE Trans. on Nucl. Sci. 51, 3427 (2004).