Global non-spherical oscillations in 3-D simulations of the H-ingestion flash
Abstract
We performed 3-D simulations of proton-rich material entrainment into -rich He-shell flash convection and the subsequent H-ingestion flash that took place in the post-AGB star Sakurai’s object. Observations of the transient nature and anomalous abundance features are available to validate our method and assumptions, with the aim to apply them to very low metallicity stars in the future. We include nuclear energy feedback from H burning and cover the full geometry of the shell. Runs on and grids agree well with each other and have been followed for and . After a long quiescent entrainment phase the simulations enter into a global non-spherical oscillation that is launched and sustained by individual ignition events of H-rich fluid pockets. Fast circumferential flows collide at the antipode and cause the formation and localized ignition of the next H-overabundant pocket. The cycle repeats for more than a dozen times while its amplitude decreases. During the global oscillation the entrainment rate increases temporarily by a factor . Entrained entropy quenches convective motions in the upper layer until the burning of entrained H establishes a separate convection zone. The lower-resolution run hints at the possibility that another global oscillation, perhaps even more violent will follow. The location of the H-burning convection zone agrees with a 1-D model in which the mixing efficiency is calibrated to reproduce the light curve. The simulations have been performed at the NSF Blue Waters supercomputer at NCSA.
Subject headings:
stars: AGB and post-AGB, evolution, interior, individual (V4334 Sagittarii) — physical data and processes: turbulence, hydrodynamics, convection1. Introduction
Convective-reactive H-combustion events are encountered when the Damköhler number , where is the reaction time scale for the reaction and is the convective advection time scale (Dimotakis, 2005). In such events H is ingested into He-shell flash convection, and this is encountered in many instances of stellar evolution, especially at very low or zero metallicity. Examples have been found in 1-D stellar evolution simulations and include the He-core and He-shell flashes with H-ingestion events in low-mass stars with [Fe/H] (e.g. Fujimoto et al., 2000; Iwamoto et al., 2004; Campbell & Lattanzio, 2008; Cristallo et al., 2009; Lau et al., 2009; Campbell et al., 2010), and in massive stars (Ekström et al., 2008; Heger & Woosley, 2010).
During H-ingestion events, nuclear energy release on the convective turn-over time scale is coupled with multi-scale turbulent mixing, and therefore results from 1-D simulations are unreliable (Herwig et al., 2011; Arnett et al., 2013). Mocák et al. (2011) presented simulations of a H-burning convective shell induced by an artificially inward shifted H-profile on top of the He-core flash convection zone. However, in their H-burning convection region the nuclear time scale of the reaction can be estimated from the available and information to be , which implies . Therefore, their H-burning convection zone is not convective-reactive, and therefore not a H-ingestion event in terms of our definition. There is a small amount of H penetrating through the interface between the two convection zones, and it does not have dynamical relevance (just as in our simulations in the first few hours, see below).
Stancliffe et al. (2011) present H-ingestion AGB shell flash convection simulations for a low-metallicity case. They report a H-burning luminosity difference of orders of magnitude between simulations with two different grid resolutions, and an almost complete transport of protons through the entire convection zone all the way to the bottom, where the highest temperatures () are reached and the protons are reacting with . Contrary to one-dimensional stellar evolution calculations, which place the location of H-burning in the He-shell flash convection zone at , those 3-D hydrodynamic simulations do not show any apparent hydrodynamic feedback from the energy release from H-burning.
These examples demonstrate the challenge that these phases of stellar evolution present to simulation efforts. It would be very helpful to check the simulation approach for a case for which meaningful validation data is available to check the results. Therefore, before turning our attention to the interesting problem of H-ingestion events in metal-poor stars, we perform for the first time 3-D hydrodynamic simulations of the H-ingestion flash in Sakurai’s object (V4334 Sgr), a post-AGB star that experienced a very late thermal pulse (VLTP). Real-time observations of the light curve (e.g. Duerbeck & Benetti, 1996; Hajduk et al., 2005) as well as post-flash abundance observations (Asplund et al., 1999) provide constraints on the details of the He-shell flash with H-ingestion in this case.
Herwig (2001) showed that the times faster rise time of Sakurai’s object compared to standard mixing-length theory (MLT) stellar evolution predictions can be accounted for if it is assumed that in H-ingestion phases the convective mixing efficiency is reduced by a factor of to , which leads to a H-combustion energy release closer to the stellar surface, where the time scale for thermal response is shorter.
Herwig et al. (2011) showed that an early mixing split between the He-shell flash convection zone (reduced in size) and the newly emerging H-burning convection zone prevents standard stellar evolution models from reproducing the observed abundance features, especially the pronounced overabundance of first-peak neutron capture elements. However, an assumed mixing permeability of the interface between the two convection zones lasting for after the H-ingestion event started does enable one to account for most observed abundance features.
2. Methods and simulations
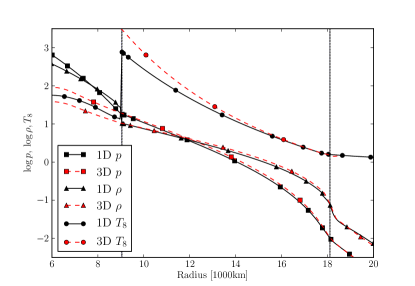
We use the 3-D gas dynamics code and the initial setup method described in detail in Woodward et al. (2013). The code features the Piecewise-Parabolic-Boltzmann (PPB) moment-conserving advection scheme (see Woodward et al., 2008a), which provides an effective resolving power of the fluid distribution that requires two to three times the grid resolution to be matched by a code based on the Piecewise-Parabolic Method (PPM) without PPB. As in previous investigations (e.g. Porter & Woodward, 2000; Herwig et al., 2006) we adopt a monatomic ideal gas equation of state which represents the conditions in He-shell flash convection in the post-AGB He-shell flash model for Sakurai’s object well (Fig. 1).
The nuclear burn module considers just the reaction (Angulo et al., 1999) with an energy release of . The two-fluid setup consists of a convectively unstable shell and a stable layer below with initially the -rich fluid ’conv’, and a stable layer above the convection zone with the H-rich fluid ’H+He’. Both of these composite fluids have realistic mean molecular weights reflecting the abundance mix for intershell and envelope material according to the corresponding stellar evolution model. The nuclear burn module takes appropriately into account that in each of the fluids only a certain fraction participates in the nuclear reaction. We ignore for now the energy release of from the subsequent -decay of with a half life of . Using the reaction rate length scale introduced by Herwig et al. (2011) as a 1-D estimate of the geometric scale of the H-burning layer would decay after being homogenized throughout a layer approximately 20 times the thickness of the burn layer. Here we are interested in the emergence and initial evolution of any hydrodynamic response to H-ingestion and burning which we assume to depend on the localized energy release from the reaction.
The full shell of the convectively unstable layer is included in the simulation, which ensures that any global or large-scale motions can be captured. The initial setup has been constructed by using the model at from Herwig et al. (2011), which was taken from the post-AGB stellar evolution track presented first in Herwig et al. (1999) and further modified in Herwig (2001). The convection is driven by a constant heating of corresponding to the He-shell flash luminosity of the stellar evolution model. The initial stratification (Fig. 1) is constructed from piecewise polytropic layers that closely resemble the stellar evolution model. A reflective spherical outer boundary condition is located at .
For our simulation approach we have investigated in detail the numerical resolution requirements (Woodward et al., 2013). In addition we have performed numerous test simulations for the Sakurai’s star setup, on the Canadian WestGrid computer Orcinus with grid sizes up to while simulations with , and grids where performed on NSF’s Blue Waters sustained petaflops computing system at NCSA.
The PPMstar code (Woodward et al., 2013), which was originally designed to run on the Los Alamos Roadrunner machine (cf. Woodward et al., 2009), performed our run at resolution within a single four-day period on Blue Waters. It ran on CPU cores, roughly half the Blue Waters machine, at a sustained rate of with 64-bit precision. At this computing rate, it took about of real time to simulate of time for the star and to write to disk of visualization data. With data dumps, of data from this run was written, which was used to generate the movies at http://www.lcse.umn.edu/movies. The movies were generated using our HVR volume rendering utility on the GPU nodes on Blue Waters. This computational performance was possible, because our code scales extremely well on Blue Waters. Each node with CPU cores ran eight MPI processes, each with four threads updating a tiny grid brick of just cells.
3. Results and discussion
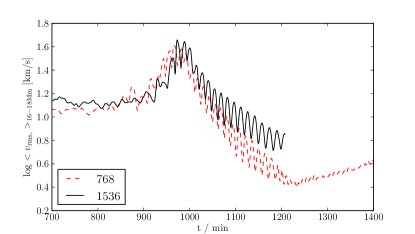
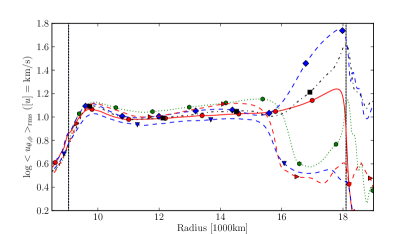
We present the results from two runs with a a grid for a minimum duration of star time. The simulations start in the same way as the entrainment simulations presented by Woodward et al. (2013). An initial transient phase of less than quickly gives way to fully developed He-shell flash convection with dominant global modes that cause hydrodynamic shear instabilities at the top convection boundary. Downdrafts of H-rich material from above originate where large-scale upwellings and consequently coherent horizontal motions along the convective boundary converge. H-rich clouds descend into the deeper layers and represent a large-scale inhomogeneous distribution in the region where protons start to react with . During this initial phase of the spherically and radially averaged velocities in both runs agree reasonably well (Fig. 1, bottom panel). The overall entropy in the convection zone rises due to the addition of energy from nuclear reactions, and mixing throughout the convection zone is efficient enough to maintain a flat spherically averaged entropy profile. The H-accumulation rate (entrainment minus burning) is and for the and runs during this initial quiet phase, about a factor four smaller than the converged entrainment rate of found by Woodward et al. (2013) for slightly different runs without H burning. As discussed there, this entrainment rate is too small to cause hydrodynamic feedback from the burning of entrained H if the entrainment rate is equated with the H burn rate. It is therefore consistent that we do not observe noticeable differences in the early quiescent phase between these simulations with H burning and the entrainment simulations of Woodward et al. (2013) without H burning. The quiescent phase lasts for around . In test simulations with a sponging boundary condition the motions in the upper stable layer are much more pronounced in this setup. These and other details of the simulations can alter the duration of the quiescent phase significantly. However, none of our tests indicate that nature of the violent events to follow depend on the details of the quiescent lead-up phase.
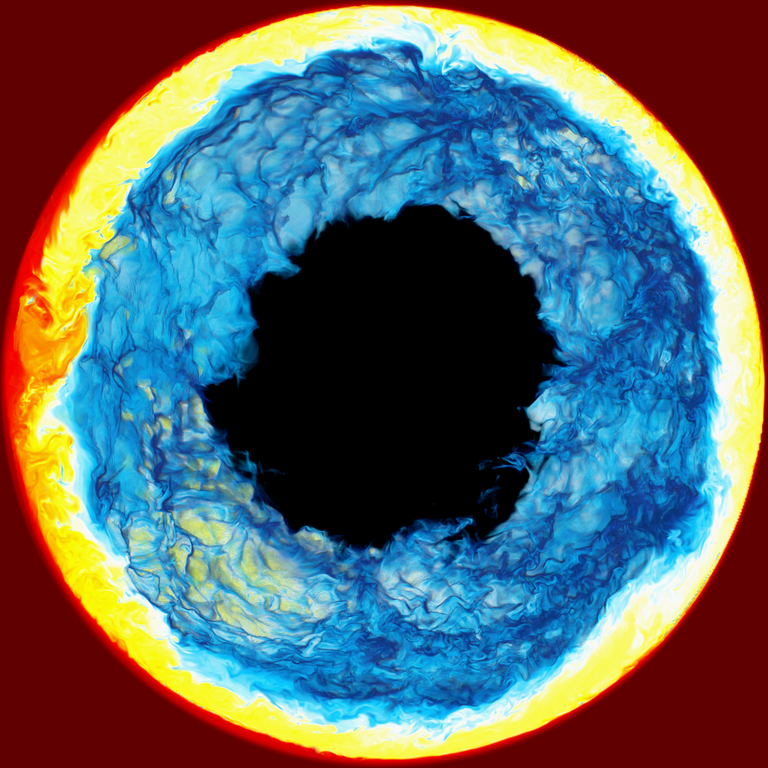
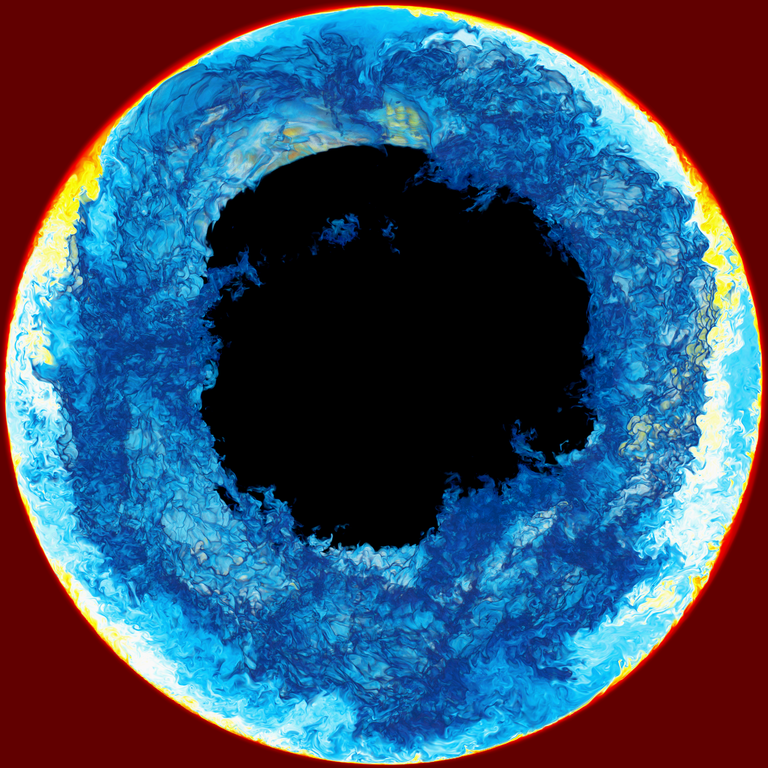
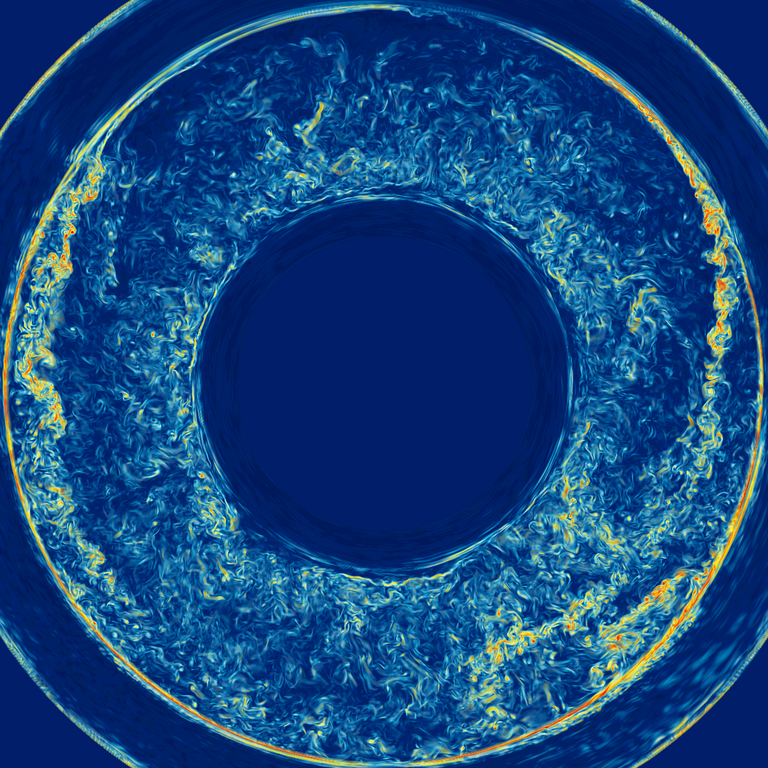
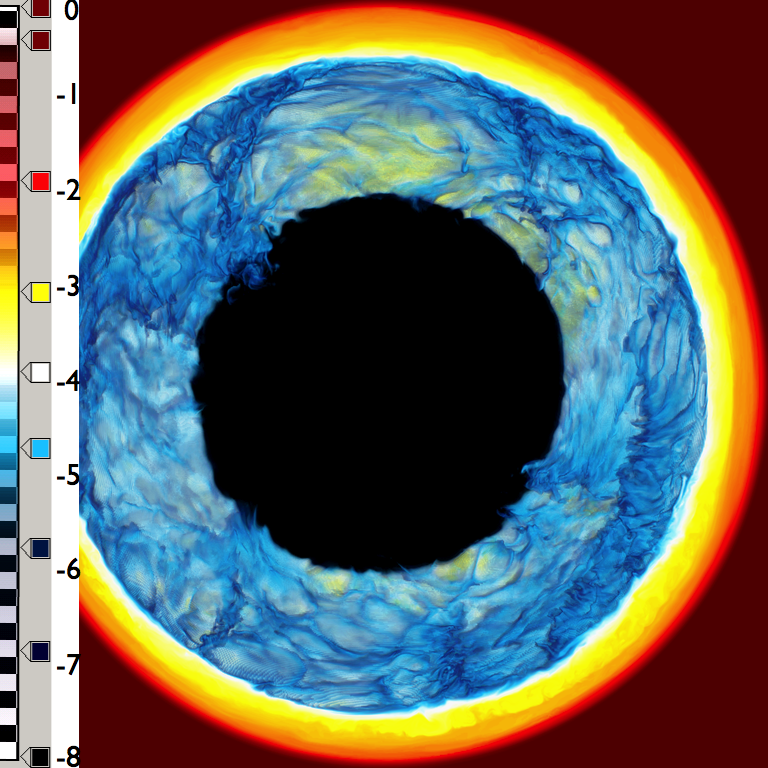
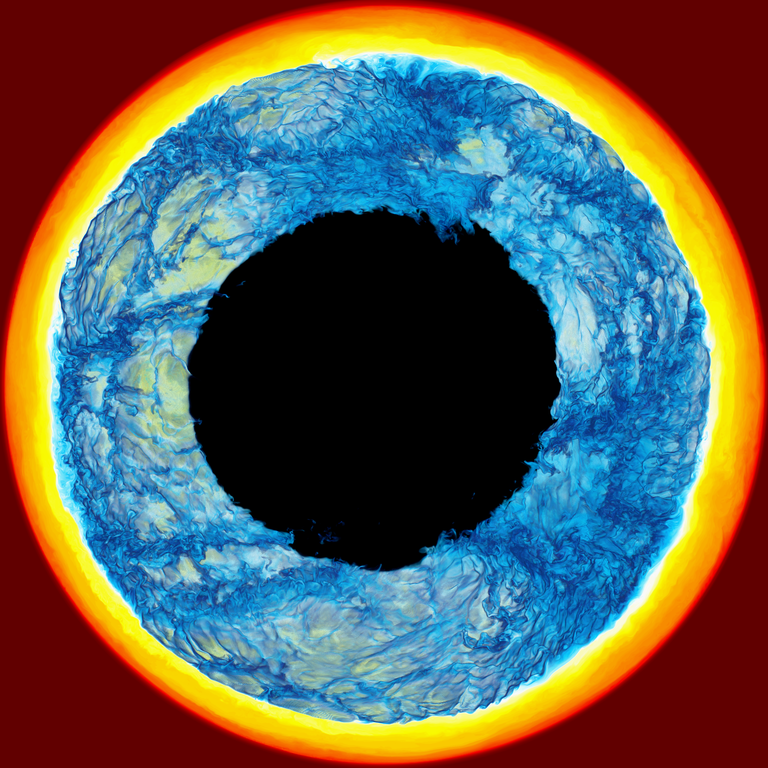
The convection hydrodynamics changes dramatically around (Fig. 1) when a major global fluid flow oscillation is about to be launched. The overall shape of the rise and decay of the oscillation mode agrees well between the two runs, the major difference being that in the lower resolution run the event starts earlier. The visualization of the 3-D flow for time shows the moment when the flow has already started to respond strongly to the energy input from H burning (Fig. 2). The fractional volume images from the two runs appear to differ more than at the later time (). However, this is mostly because we see in the -run image a later time in the event. Overall the agreement between the two runs is good.
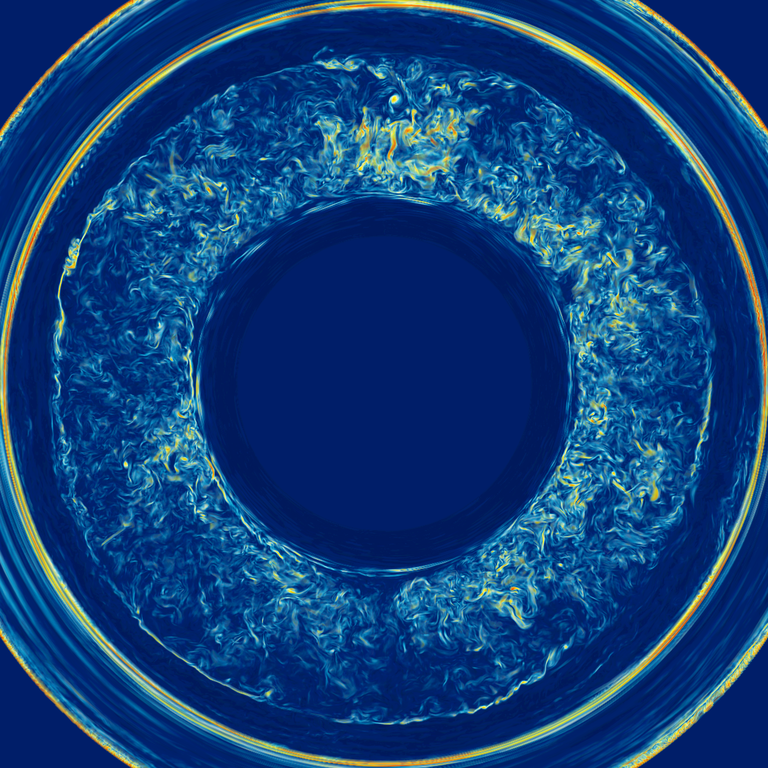
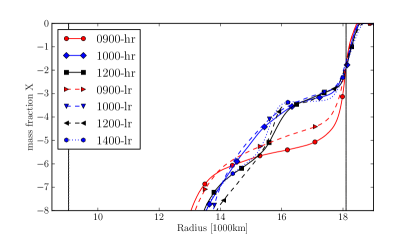
During the lead-up to this transition at eventually a large enough reservoir of H is accumulated in the upper part of the convection zone (Fig. 3) so that pockets of H-rich material advected into the burn region carries an increasing fraction of fuel. At that point individual, particularly strong ignition events launch very pronounced, identifiable upwellings. As these hit the stiff convective boundary above they are deflected in all directions and create enhanced levels of entrainment. The Kelvin-Helmholtz instability vorticity-entrainment trains can be clearly identified in the vorticity image (top row, Fig. 2). The horizontal flows proceed along the convective boundary all the way to the antipode where their collision is forcing the H-rich entrainment layer into a downdraft. This next fuel-enhanced advection stream causes an even more violent ignition event and subsequent launching of the next fast upwelling, which in turn causes the next circumferential flow back close to the point of origin of the first ignition. This oscillatory back-and-forth repeats for about a dozen times and is clearly identifiable in the averaged velocity time evolution shown in the bottom panel of Fig. 1. We refer to this new phenomenon in stellar physics as the Global Oscillation of Shell H-ingestion (GOSH). During the rise time of and are accumulated in the and runs, corresponding to an accumulation rate of and close to the critical entrainment rate for hydrodynamic feedback estimated in Woodward et al. (2013). These highly time-variable and global fluid flows are better observed in the animated movies available at http://www.lcse.umn.edu/movies.
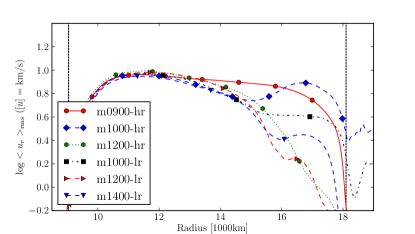
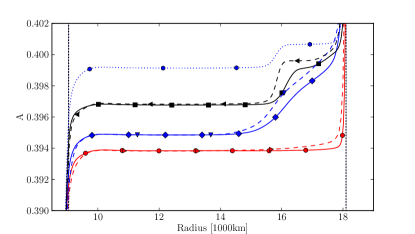
Although the GOSH proceeds beyond the initial rise time, its amplitude decreases until convective motions in the upper region of the initially unstable zone are significantly suppressed (see vorticity image at later time and spherically averaged radial and horizontal velocities shown in Fig. 3). This suppression follows from the entrainment of entropy that goes along with the entrainment of H-rich material from the stable layer above the convection zone (lower panel Fig. 3). In the simulation a new upper boundary of the He-luminosity driven convection forms at that can be seen clearly in both runs for the later time in the fractional volume and the vorticity image. However, the burning of entrained H-rich material continues to add entropy to the convection zone as well and causes an entropy plateau to develop in the upper region. The run did not yet get to that point when we stopped it. But the run with its generally higher entrainment rate shows an upper convection zone is about to form between and .
When we continued this lower-resolution run beyond it developed a further non-radial, violent event in which the velocity amplitude in the upper layer above the initial convection zone increases significantly. This simulation outcome is not reliable because the outer boundary of the domain needs to be moved further out to simulate this following phase accurately. During the GOSH significant and mostly tangential motions are set in place in the stable layer above the convection zone that die down when the oscillations subside. In terms of the averaged velocities (as those shown in Fig. 3) these motions are agreeing fairly well between the two grid simulations up to when the GOSH is ending. At later times larger differences are evident. This is the phase that we need to explore in more detail with higher resolution grids.
What connections can we make between these preliminary results of the 3-D hydrodynamic simulations and the constraints we have so far from comparing simulations with calibrated 1-D models? Herwig et al. (2011) reproduced observed n-capture element abundances by assuming a constant entrainment rate of for to before terminating further neutron exposure by assuming mixing between the upper and lower region of the convection became inefficient. Our simulations so far show that compared to the very low entrainment we found in He-shell flash convection without feedback from H burning (Woodward et al., 2013), entrainment rates are significantly enhanced by the GOSH. However, the GOSH leads as well, at least initially, to a self-quenching of convective motions close to the original upper convection boundary due to the entrainment of entropy. Convection is restarted in this layer by H burning and during one (or perhaps several) subsequent violent outburst(s) the entrainment rates may further increase. These enhanced entrainment rates will have to be sustained so that the observed 2-dex enhancement of first-peak elements Sr, Rb, Zr, Y can be reproduced. In which way this may be possible will have to be revealed by future simulations. The present simulations show that the H-ingestion is proceeding through periodic bursts of global-mode oscillations and highly variable entrainment rates, and we will have to investigate if such entrainment histories would fundamentally allow the reproduction of the observed abundance features in Sakurai’s object. In our present simulations the reflective boundary condition is likely unrealistic when the flow becomes very violent in the initially stable layer above.
The location of H-ingestion energy release is related to the time-scale of the born-again light curve of VLTP objects (Herwig, 2001). During the long quiescent phase of our 3-D simulations H burning takes place in deeper layers of the He-shell flash convection zone, around . However, when the feedback from H burning becomes evident burning moves up to to , and here the new convective boundary forms after the GOSH. Herwig (2001) has associated the light curve time scale of Sakurai’s object with the mixing efficiency. Our 3-D setup (Fig. 1) is based on this same 1-D model used by Herwig (2001). The unmodified stellar evolution track shows the H-burning location at (corresponding to a radius ) with a born-again time of , compared to () for a modified model with reduced mixing efficiency calibrated to reproduce the observed time of . The entropy profile (Fig. 3) shows that the H-burning location in the 3-D hydrodynamic simulation indeed agrees very well with the lower-mixing efficiency solution of the calibrated 1-D model, and would lead to a fast born-again time as observed. This agreement between the location of H-burning in a stellar evolution model calibrated from the light curve, and the location found in the 3-D simulation that has no free parameters provides a first validation of our simulation approach.
Our simulations show highly non-radial, global and variable modes with periods of the order of a convective turn-over time. These global modes of the H-ingestion event cannot be captured in 1-D models. However, 1-D stellar evolution simulations do agree with some aspects of our 3-D simulations, as for example the relatively early emergence of a H-burning convection zone in terms of the entrained mass of H, and the fact that energy-release from H-burning has some influence on the convective properties of the He-burning shell. This is, for example, opposite to the finding of Stancliffe et al. (2011) that H is mixed all the way to the bottom of the He-shell flash convection zone (their Fig. 9), a result that we do not confirm in our 3-D simulations (Fig. 3). However, the low-Z AGB thermal pulse has due to lower density a smaller gas pressure fraction () compared to post-AGB H-ingestion case where . This may limit direct comparisons between their and our work. Another difference is that the transition to a H-burning driven convection zone that we report here appears after in our simulation, whereas the Stancliffe et al. (2011) runs stop after . Perhaps those authors did not see a significant hydrodynamic response from H-burning energy release because they stopped the run too early. However, as we have pointed out here, even with our much longer simulations we can be certain that we have not yet seen the full story of the H-ingestion flash.
Finally, we note that our results reported here have to be considered as preliminary. We have to postpone a more detailed analysis of the results of our simulations until we are able to carry the high resolution run further forward in time.
References
- Angulo et al. (1999) Angulo, C., Arnould, M., & Rayet, M. et al. 1999, Nucl. Phys., A 656, 3
- Arnett et al. (2013) Arnett, W. D., Meakin, C., & Viallet, M. 2013, eprint arXiv:1312.3279
- Asplund et al. (1999) Asplund, M., Lambert, D. L., Kipper, T., Pollacco, D., & Shetrone, M. D. 1999, Astronomy and Astrophysics, 343, 507
- Campbell & Lattanzio (2008) Campbell, S. W., & Lattanzio, J. C. 2008, A&A, 490, 769
- Campbell et al. (2010) Campbell, S. W., Lugaro, M., & Karakas, A. I. 2010, A&A, 522, L6
- Cristallo et al. (2009) Cristallo, S., Piersanti, L., Straniero, O., et al. 2009, Publications of the Astronomical Society of Australia, 26, 139
- Dimotakis (2005) Dimotakis, P. E. 2005, Annu. Rev. Fluid Mech., 37, 329
- Duerbeck & Benetti (1996) Duerbeck, H. W., & Benetti, S. 1996, ApJ Lett., 468, L111
- Ekström et al. (2008) Ekström, S., Meynet, G., Chiappini, C., Hirschi, R., & Maeder, A. 2008, Astronomy and Astrophysics, 489, 685
- Fujimoto et al. (2000) Fujimoto, M. Y., Ikeda, Y., & Iben, I., J. 2000, ApJ Lett., 529, L25
- Hajduk et al. (2005) Hajduk, M., Zijlstra, A. A., Herwig, F., et al. 2005, Science, 308, 231
- Heger & Woosley (2010) Heger, A., & Woosley, S. E. 2010, ApJ, 724, 341
- Herwig (2001) Herwig, F. 2001, The Astrophysical Journal, 554, L71
- Herwig et al. (1999) Herwig, F., Blocker, T., Langer, N., & Driebe, T. 1999, Astronomy and Astrophysics, 349, L5
- Herwig et al. (2006) Herwig, F., Freytag, B., Hueckstaedt, R. M., & Timmes, F. X. 2006, ApJ, 642, 1057
- Herwig et al. (2011) Herwig, F., Pignatari, M., Woodward, P. R., et al. 2011, ApJ, 727, 89
- Herwig et al. (2011) Herwig, F., Pignatari, M., Woodward, P. R., et al. 2011, The Astrophysical Journal, 727, 89
- Iwamoto et al. (2004) Iwamoto, N., Kajino, T., Mathews, G. J., Fujimoto, M. Y., & Aoki, W. 2004, ApJ, 602, 378
- Lau et al. (2009) Lau, H. H. B., Stancliffe, R. J., & Tout, C. A. 2009, Monthly Notices of the Royal Astronomical Society, 396, 1046
- Mocák et al. (2011) Mocák, M., Siess, L., & Müller, E. 2011, A&A, 533, A53
- Porter & Woodward (2000) Porter, D. H., & Woodward, P. R. 2000, ApJS, 127, 159
- Stancliffe et al. (2011) Stancliffe, R. J., Dearborn, D. S. P., Lattanzio, J. C., Heap, S. A., & Campbell, S. W. 2011, ApJ, 742, 121
- Woodward et al. (2008a) Woodward, P., Herwig, F., Porter, D., et al. 2008a, in American Institute of Physics Conference Series, Vol. 990, First Stars III, 300–308
- Woodward et al. (2013) Woodward, P. R., Herwig, F., & Lin, P. H. 2013, arXiv.org, astro-ph.SR
- Woodward et al. (2009) Woodward, P. R., Jayaraj, J., Lin, P.-H., & Dai, W. 2009, Concurrency and Computation: Practice and Experience, 21, 2160
- Woodward et al. (2008b) Woodward, P. R., Porter, D. H., Herwig, F., et al. 2008b, in Nuclei in the Cosmos (NIC X)