d+Au Hadron Correlation Measurements from PHENIX
Abstract
Recent observations of extended pseudorapidity correlations at the LHC in p+p and p+Pb collisions are of great interest. Here we present related results from d+Au collisions at PHENIX. We present the observed and discuss the possible origin in the geometry of the collision region. We also present new measurements of the pseudorapidity dependence of the ridge in d+Au collision. Future plans to clarify the role of geometry in small collision systems using 3He+Au collisions are discussed.
keywords:
The highly asymmetric nuclear collisions d+Au and p+Pb have been studied at ultra-relativistic energies primarily to establishing a baseline of cold nuclear matter effects for in heavy ion collisions. In 2003 measurements from RHIC [1, 2, 3, 4] conclusively established that the jet quenching observed at RHIC [5] was due to a final state effect in the hot nuclear matter rather than an initial state effect.
In heavy ion collisions at both RHIC and the LHC the properties of the matter are understood to be described by hydrodynamics with a very small sheer viscosity to entropy density ratio, [6]. The is constrained via measurements of Fourier coefficients of the azimuthal distribution of particles ( where is the order of the Fourier coefficient). Measurements of the particle pair correlations in heavy ion collisions have been well described by products of the same [7, 8]. One prominent feature of these correlation functions is the so-called ridge a long range in pseudorapidity, small correlation resulting from the sum of positive correlations around = 0.
Surprisingly, a similar long range correlation was seen in very high multiplicity p+p collisions at the LHC [9] where a hydrodynamical system was not generally expected to be created. Recently, at the LHC a double ridge structure has been observed also in p+Pb collisions at 5.02 TeV [10, 11]. Once the jet and dijet correlations were subtracted out the residual distribution was largely described by a modulation. Extractions of resulted in values with a similar magnitude to those in heavy ion collisions [10, 11], which was suggestive of a similar hydrodynamic origin. However, such correlations were also expected from the Color Glass Condensate model [12].
Given these exciting discoveries at the LHC, it was of course natural to ask if such effects could be seen in d+Au collisions at RHIC and what could be understood about the physical origin of these effects from the comparison between RHIC and LHC measurements. A large sample of d+Au collisions at = 200 GeV was taken in 2008. Here report on measurements by the PHENIX collaboration using that data.
1 Midrapidty Correlations
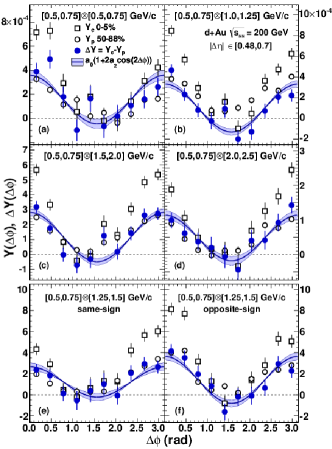
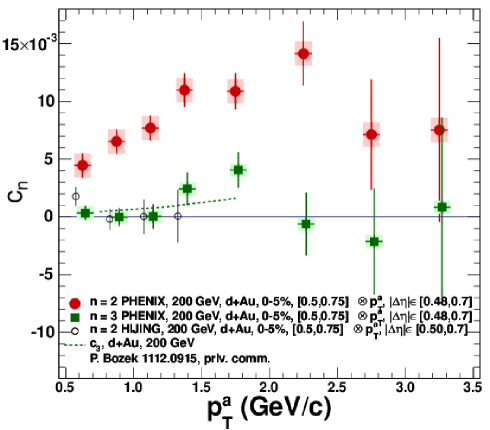
PHENIX has measured charged hadron azimuthal angular pair correlations in central (the top 5% of centrality) and peripheral (50-88% centrality) d+Au events at = 200 GeV. The correlations for a selection of combinations are shown in the left panel of Fig. 1. The trigger particle is always 0.50.75 GeV/c and partner particle () is varied. In order to reduce same side jet contributions a separation greater than 0.48 is required between the particles. The difference of the central and peripheral correlations, , is also shown. An extraction of the second Fourier component, is overlaid. The curve describes the data well. The values, as a function of the of the partner are shown in the right panel of Fig. 1. reaches a maximal value of about 1% at around = 1.5 GeV/c. Also shown on the same Figure is the third Fourier coefficient, ; this is consistent zero in the measured range. Predictions at RHIC in the Color Glass Condensate model have been made [17].
PHENIX lacks the pseudorapidity acceptance necessary to completely suppress same side jet correlations (which are a small and small effect) in these correlations. In order to constrain the possible effects of jet correlations in the observed signal we repeat the same procedure with d+Au events generated with HIJING [20]. The results of this study are also shown in the right panel of Fig. 1. in HIJING is consistent with zero and much smaller than that observed in the data. Additionally, we have tested the sensitivity to the cut used by varying it from the nominal 0.48 value to 0.36 and 0.60; no significant change in the extracted value is observed. A direct measure of the large correlations will be discussed in Sec. 2.
The factorization assumption [21, 22, 7],
| (1) |
is used to extract the single particle anisotropies, , which are shown in Fig. 2. rises with reaching a maximal value of about 15%. Also shown on the plot are hydrodynamic calculations from three groups [14, 15, 18, 19]. All three calculations agree rather well with the data. Refs. [14, 15, 18] use = 0.08. The calculation in Ref. [19] is for ideal hydrodynamics.
Since the values observed are not significantly larger than zero, it is not possible to extract from the current data. However, it is possible to turn a calculation for into , which is shown in Fig 1 for the calculation in Ref. [14, 15]. The calculation agrees well with the data.
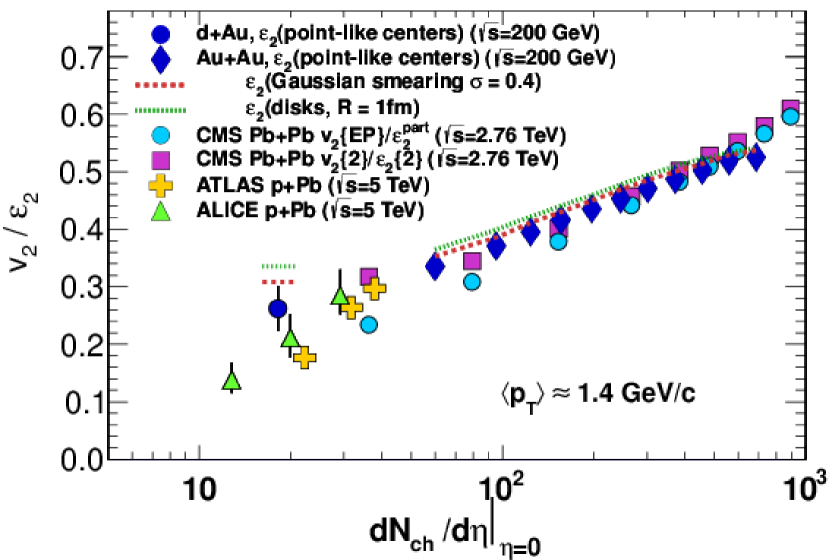
In order to investigate the possible relationship between the geometry of the collision system and the observed we compare the values (at 1.4 GeV/c) scaled by estimates of the initial state second order eccentricity, . The values are shown as a function of at mid-rapidity in Fig. 3 for d+Au, p+Pb, Au+Au and Pb+Pb collisions. The values are from a Glauber Monte Carlo calculation is consistent between central d+Au and midcentral p+Pb (systems which have a similar ) despite the factor of 25 difference in collision energy. The value in central d+Au collisions is approximately 50% larger than in in midcentral p+Pb. rises as a function and follows approximately a common trend between the four collisions systems.
There are uncertainties within the Glauber Monte Carlo calculation on the values. We have investigated the uncertainty due to the representation of the nucleons within the calculation. The default values take the nucleons as point-like centers. We have also investigated treating the nucleons as solid disks with a radius of 1 fm and Gaussians with = 0.4 in d+Au and Au+Au collisions. In d+Au collisions these variations change by approximately 30%. In Au+Au the effect is much smaller. One estimate is that there is a factor of two uncertainty on in central p+Pb collisions [18].
2 Rapidity Separated Correlations
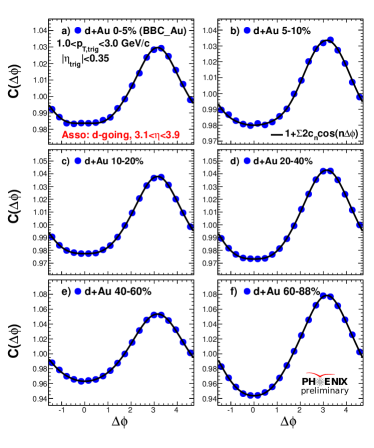
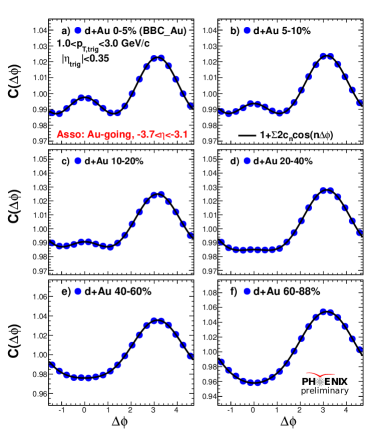
In order to investigate whether the correlations seen at mid-rapidity are long range and if so, what the rapidity dependence is we have measured correlations between mid-rapidity hadrons (0.35) and electromagnetic energy in the Muon Piston Calorimeters [23]. These calorimeters sit on either side of the interaction region at 3.1 3.7 (3.9) in the Au-going (d-going) direction. With this large gap no same side jet correlations remain.
The azimuthal correlations for both the deuteron going and Au-going MPC are shown in Fig. 4 as a function of centrality. In all cases the dominant feature of the correlation functions is the peak at =. This peak has contributions from jet correlations and momentum conservation. In the d-going correlations no near side correlations are seen at any centrality.
In the Au-going correlations, peripheral correlations look similar to those observed in the d-going direction. However in central collisions a distinct small correlation is observed for the top 20% most central events. The magnitude of the correlation relative to the peak at = increases toward more central events. This is the first observation of the ridge in d+Au collisions. Work is ongoing to extract values from these correlations in the presence of the large correlation.
3 Future Investigations
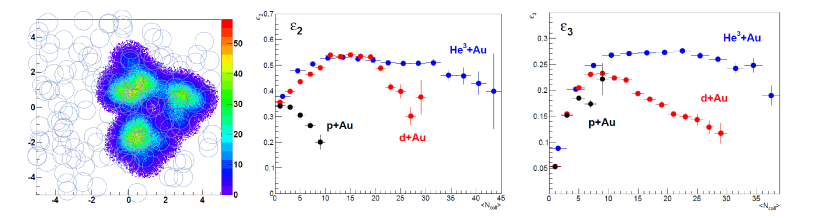
While many of the existing measurements in p+Pb and d+Au are suggestive of hydrodynamic behavior in d+Au collisions further investigations of this surprising effect are certainly necessary. As discussed above, we see no significant in d+Au collisions. In the hydrodynamic description this is consistent with the large driven by the elongated shape of the deuteron and, as discussed above, the values extracted from the d+Au data are consistent with zero and much smaller than . If the geometry of the deuteron drives the observed values then it should be possible to induce a large (and thereby a large ) by using a projectile nucleus with a large . PHENIX has proposed running 3He+Au (or +Au), d+Au and p+Au collisions at RHIC in 2015 to understand the relationship between and geometry.
Fig. 5 shows the results of Glauber Monte Carlo calculations of 3He+Au, d+Au and p+Au collisions. decreases with an increasing number of binary nucleon-nucleon collisions () in p+Au collisions while for d+Au and 3He+Au collisions it increases up to a maximal value of approximately 0.4. For 3He+Au collisions reaches 0.25 at about 10 collisions and remains approximately constant for all more central collisions. In the 0-5% central d+Au collisions studied here the mean value is about 18, thus the value in central 3He+Au collisions will be approximately 40% bigger than in d+Au collisions.
Additionally, in the 2015 run PHENIX will have additional tracking provided by the silicon vertex detectors. This will provide not only increase coverage around midrapidity, but also increased hadron acceptance leading to more precise measurements. Thus, it will be possible to determine whether the increased in 3He+Au collisions leads to a correspondingly large as a conclusive test of the role of geometry in generating the observed in p+A and d+A collisions.
4 Conclusions
Over the past year, there has been much excitement around the novel effects observed in p+Pb and d+Au collisions. We have presented PHENIX results on the d+Au at midrapidity and shown new results using our MPC detector which provide the first evidence for long range ( 3.5) correlations at small in d+Au collisions. We have also discussed future plans to constrain the role of geometry in small collision systems by varying the shape of the projectile nucleus to significantly vary the value of the collision region. The collision system variation possible at RHIC make feature studies in this direction extremely exciting at RHIC.
References
- [1] B. Back, et al., Phys.Rev.Lett. 91 (2003) 072302. arXiv:nucl-ex/0306025.
- [2] S. Adler, et al., Phys.Rev.Lett. 91 (2003) 072303. arXiv:nucl-ex/0306021.
- [3] J. Adams, et al., Phys.Rev.Lett. 91 (2003) 072304. arXiv:nucl-ex/0306024.
- [4] I. Arsene, et al., Phys.Rev.Lett. 91 (2003) 072305. arXiv:nucl-ex/0307003.
- [5] S. Adler, et al., Phys.Rev.Lett. 91 (2003) 072301. arXiv:nucl-ex/0304022.
- [6] A. Adare, et al., Phys.Rev.Lett. 107 (2011) 252301. arXiv:1105.3928.
- [7] K. Aamodt, et al., Phys.Lett. B708 (2012) 249–264. arXiv:1109.2501.
- [8] G. Aad, et al., Phys.Rev. C86 (2012) 014907. arXiv:1203.3087.
- [9] V. Khachatryan, et al., JHEP 1009 (2010) 091. arXiv:1009.4122.
- [10] B. Abelev, et al., Phys.Lett. B719 (2013) 29–41. arXiv:1212.2001.
- [11] G. Aad, et al., Phys.Rev.Lett. 110 (2013) 182302. arXiv:1212.5198.
- [12] K. Dusling, R. Venugopalan, Phys.Rev. D87 (2013) 054014. arXiv:1211.3701.
- [13] N. Ajitanand, J. Alexander, P. Chung, W. Holzmann, M. Issah, et al., Phys.Rev. C72 (2005) 011902. arXiv:nucl-ex/0501025.
- [14] P. Bozek, Phys.Rev. C85 (2012) 014911. arXiv:1112.0915.
- [15] P. Bozek, private communication.
- [16] A. Adare, et al.arXiv:1303.1794.
- [17] K. Dusling, R. Venugopalan, Phys.Rev. D87 (2013) 094034. arXiv:1302.7018.
- [18] A. Bzdak, B. Schenke, P. Tribedy, R. VenugopalanarXiv:1304.3403.
- [19] G.-Y. Qin, B. MullerarXiv:1306.3439.
- [20] M. Gyulassy, X.-N. Wang, Comput.Phys.Commun. 83 (1994) 307. arXiv:nucl-th/9502021.
- [21] M. Luzum, Phys.Lett. B696 (2011) 499–504. arXiv:1011.5773.
- [22] B. H. Alver, C. Gombeaud, M. Luzum, J.-Y. Ollitrault, Phys.Rev. C82 (2010) 034913. arXiv:1007.5469.
- [23] A. Adare, et al., Phys.Rev.Lett. 107 (2011) 172301. arXiv:1105.5112.