Fundamental Vibrational Transitions of HCl Detected in CRL 2136 ,††thanks: Based on data collected in CRIRES open-time program [289.C-5042] at the VLT on Cerro Paranal (Chile), which is operated by the European Southern Observatory (ESO). ,††thanks: Based on data collected in IRCS program [S12A-075] at Subaru Telescope on Mauna Kea, Hawaii, operated by the National Astronomical Observatory of Japan (NAOJ).
Abstract
Aims. We would like to understand the chemistry of dense clouds and their hot cores more quantitatively by obtaining more complete knowledge of the chemical species present in them.
Methods. We have obtained high-resolution infrared absorption spectroscopy at 3–4 m toward the bright infrared source CRL 2136.
Results. The fundamental vibration-rotation band of HCl has been detected within a dense cloud for the first time. The HCl is probably located in the warm compact circumstellar envelope or disk of CRL 2136. The fractional abundance of HCl is (4.9–8.7)10-8, indicating that approximately 20% of the elemental chlorine is in gaseous HCl. The kinetic temperature of the absorbing gas is 250 K, half the value determined from infrared spectroscopy of 13CO and H2O. The percentage of chlorine in HCl is approximately that expected for gas at this temperature. The reason for the difference in temperatures between the various molecular species is unknown.
Key Words.:
astrochemistry — infrared: general — ISM: molecules — line: identification — stars: individual (CRL 2136) — stars: formation1 Introduction
Hydrogen chloride (HCl) was first detected in the interstellar medium by Blake et al. (1985) in the dense molecular cloud OMC-1 via its 1-0 rotational emission line. Subsequent observations in OMC-1 (Schilke et al., 1995), in Sgr B2 (Zmuidzinas et al., 1995; Lis et al., 2010; Menten et al., 2011), in Orion A and Mon R2 molecular clouds (Salez et al., 1996), and in other star forming regions (Peng et al., 2010) established that HCl is a common constituent of dense clouds, with typical column densities of (1–20) cm-2 and fractional abundances with respect to hydrogen of (1–30). In these clouds chlorine in HCl comprises less than one percent of elemental chlorine, with the rest presumably frozen on dust grains (Schilke et al., 1995; Peng et al., 2010).
Lines of the fundamental vibration-rotation band of HCl, located in the 3.2–3.8 m region, were first detected in sunspot spectra by Hall & Noyes (1972), and in the photosphere of an S-type star by Ridgway et al. (1984). Here we report the first detection of fundamental band lines of HCl in the interstellar medium, within the dark cloud containing CRL 2136 most probably in the circumstellar disk or envelope of that object. CRL 2136 is a massive (), luminous () young star in formation at a distance of 2 kpc (Kastner et al., 1992). It is bright at thermal infrared wavelengths (e.g., 3.0 mag in the WISE band, 3.4 m), and serves as an archetypal line of sight for the study of gas in dense clouds via absorption spectroscopy. One of the first detections of interstellar H (Geballe & Oka, 1996) was made toward it near 3.7 m, as well the first infrared detection of HF near 2.5 m (Indriolo et al., 2013a). High S/N spectroscopy of CRL 2136 at other infrared wavelengths has the potential of yielding detections of additional species.
2 Observations
The observations reported here were carried out at two telescopes. On 12 September 2012 spectra of CRL 2136 were obtained at the VLT on Paranal using the CRIRES spectrograph (Kaeufl et al., 2004) for DDT program 289.C-5042, whose aim was to search for the (3,3)l absorption line of H (which was not detected). A 02 wide slit (of length 40″) was used to achieve a spectral resolution of =100,000. The adaptive optics system MACAO (Bonnet et al., 2004) was used to increase the slit throughput by using a nearby visible star as a wavefront reference. The wavelength regions observed were centered at 3.576 m, 3.658 m, and 3.668 m, each meant to cover key H lines: (3,3)l, (2,2)l and the doublet (1,0)/(1,1)u, respectively. The slit was oriented at position angle 45° to avoid the diffuse nebulosity near CRL 2136. The telescope was nodded along the slit by 10″ every two exposures in order to sample the sky emission spectrum in the same rows as CRL 2136 was observed and subtract it from the object spectrum. No spatially extended line-emission greater than 1% of the continuum level was detected at the wavelengths of HCl lines in two-dimensional spectral images before the sky subtraction, and thus the observed absorption lines could only be slightly affected by extended line emission. The integration time was 6 min for each grating setting. A spectroscopic standard star HR 6879 (B9.5 III; 1.707 mag; Bouchet et al., 1991) was observed to allow accurate removal of telluric absorption lines. Other standard calibration data, including spectroscopic flat field and dark current images, were obtained at the end of the night.
Spectra of CRL 2136 in the 3–4 m region were also obtained at the Subaru Telescope on Mauna Kea on 15 June 2012 with the cross-dispersing spectrograph IRCS in the open-time program S12A-075. A 01467 slit was used to record the spectra at =20,000. The slit was oriented at position angle 0°. Two grating settings were used to cover selected wavelength intervals from 3.25 m to 4.13 m. The integration times for the two grating settings were 6 min and 12 min. The telescope was nodded by 34 along the slit to sample the sky emission. A spectroscopic standard star HR 6556 (A5 III; 1.61 mag111From UKIRT standards. http://www.jach.hawaii.edu/UKIRT/astronomy/calib/phot_cal/lm_stds.html) was observed before the observation of CRL 2136. Other calibration data were obtained on the morning after the observation. Another observation was performed with IRCS on UT 12 May 2013 in the open-time program S13A-077, using three grating settings which provided complete coverage from 3.20 m to 4.15 m continuously. In this case the slit was oriented at position angle 45° and the integration times were 6 to 24 min. The spectroscopic standard star HR 7001 (Vega; A0 V; 0.00 mag222From UKIRT standards. http://www.jach.hawaii.edu/UKIRT/astronomy/calib/phot_cal/lm_stds.html was observed before the science observation for the purpose of telluric line removal.
The CRIRES data were reduced using the CRIRES pipeline recipe333http://www.eso.org/sci/software/pipelines/crire/crire-pipe-recipes.html ver. 2.3.1 on Gasgano444http://www.eso.org/sci/software/gasgano/ and EsoRex555http://www.eso.org/sci/software/cpl/esorex.html platforms provided by the European Southern Observatory (ESO). The pipeline reduction included correction of the detector linearity, subtraction of the sky emission, normalization of the detector pixel responses, and extraction of one-dimensional spectra. The spectra obtained at the two locations of CRL 2136 on the slit were extracted separately to avoid degrading the spectral resolution of the combined spectrum due to the distortion of the slit image and the different degrees of defocusing at the different locations on the slit. Wavelength calibration was achieved by matching the observed telluric absorption lines to the model atmospheric transmission spectrum calculated by LBLRTM (Clough et al., 2005). In terms of velocity the uncertainty in the calibration is typically less than 1 km s-1. The telluric absorption lines were removed by dividing the spectra of CRL 2136 by those of the standard stars. Slight mismatches of the wavelength, spectral resolution, and optical depth of the absorption lines between the object and the standard star spectra were manually corrected to the extent possible. The spectra extracted at the two locations on the slit were added together after the wavelength calibration and the removal of the telluric lines were performed individually. The calibrated wavelengths were converted to the velocities with respect to the local standard of rest. The data obtained by IRCS were reduced in a similar manner except that the spectral extraction was done with the IRAF aperture extraction package666IRAF is distributed by the National Optical Astronomy Observatories, which are operated by the Association of Universities for Research in Astronomy, Inc., under cooperative agreement with the National Science Foundation.. Wavelength calibration was performed in the same way as for the CRIRES data; the uncertainty corresponds to a few km s-1. The IRCS spectra from 2012 and 2013 were coadded to increase the signal-to-noise ratio in those instances where the same lines were observed.
| CRIRES | IRCS | |||||||||
|---|---|---|---|---|---|---|---|---|---|---|
| [m] | [K] | [s-1] | [10-6 m] | [1014 cm-2] | [10-6 m] | [1014 cm-2] | ||||
| H35Cl | (5) | 3.3355 | 449.95 | 17.72 | 88 | 104 | 3.7 0.5 | 10.8 1.4 | ||
| (3) | 3.3746 | 180.14 | 17.39 | 56 | 72 | 6.9 1.6 | 17.9 4.2 | |||
| (2) | 3.3957 | 90.10 | 16.90 | 40 | 56 | 6.6 0.7 | 15.9 1.8 | |||
| (1) | 3.4178 | 30.04 | 15.89 | 24 | 40 | 3.8 2.6 | 8.0 5.4 | |||
| (0) | 3.4409 | 0.00 | 13.32 | 8 | 24 | 5.5 2.4 | 7.4 3.3 | |||
| (1) | 3.4903 | 30.04 | 40.33 | 24 | 8 | 2.8 0.7 | 10.6 2.5 | |||
| (2) | 3.5166 | 90.10 | 26.97 | 40 | 24 | 3.6 0.4 | 11.1 1.1 | |||
| (3) | 3.5441 | 180.14 | 24.33 | 56 | 40 | 4.9 1.0 | 13.5 2.8 | |||
| (4) | 3.5728 | 300.12 | 23.20 | 72 | 56 | 3.9 0.3 | 10.1 0.8 | 2.8 1.3 | 7.1 3.4 | |
| (5) | 3.6026 | 449.95 | 22.57 | 88 | 72 | 2.7 0.1 | 6.6 0.3 | 2.4 0.4 | 5.8 1.0 | |
| (6) | 3.6337 | 629.54 | 22.14 | 104 | 88 | 2.0 0.1 | 4.5 0.3 | |||
| (7) | 3.6660 | 838.80 | 21.83 | 120 | 104 | 0.9 0.3 | 2.1 0.6 | |||
| H37Cl | (2) | 3.3982 | 89.96 | 16.85 | 40 | 56 | 3.5 1.0 | 8.4 2.4 | ||
| (1) | 3.4203 | 29.99 | 15.84 | 24 | 40 | 2.8 0.4 | 5.8 0.9 | |||
| (0) | 3.4434 | 0.00 | 13.28 | 8 | 24 | 1.6 0.6 | 2.1 0.8 | |||
| (1) | 3.4928 | 29.99 | 40.21 | 24 | 8 | 1.6 0.6 | 5.9 2.2 | |||
| (2) | 3.5192 | 89.96 | 26.89 | 40 | 24 | 3.8 0.5 | 11.7 1.4 | |||
| (3) | 3.5467 | 179.87 | 24.26 | 56 | 40 | 1.5 0.9 | 4.0 2.4 | |||
| (4) | 3.5753 | 299.67 | 23.13 | 72 | 56 | 1.7 0.3 | 4.4 0.7 | 2.0 1.0 | 5.1 2.5 | |
| (5) | 3.6051 | 449.27 | 22.50 | 88 | 72 | 1.3 0.7 | 3.1 1.7 | |||
5
3 Results
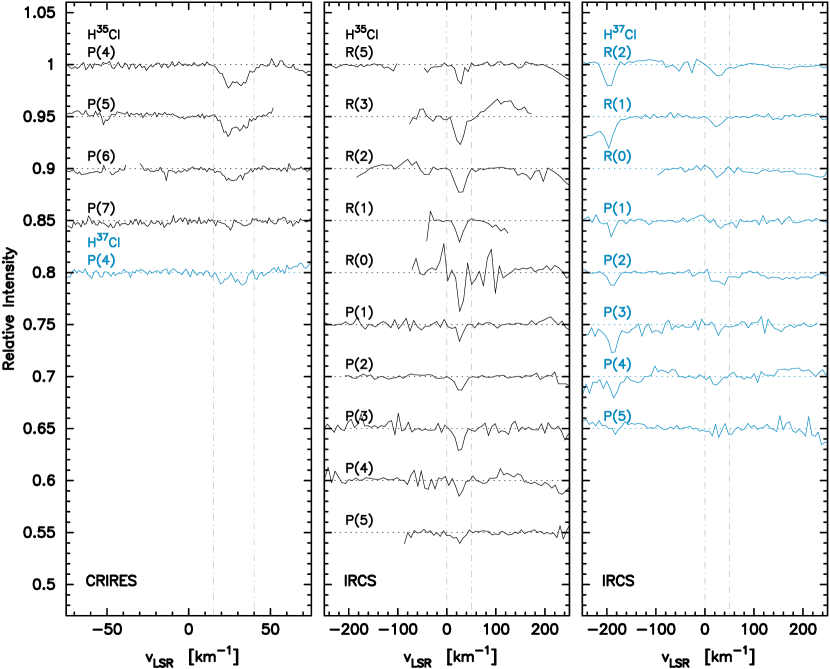
Absorption by the v=1-0 (4)–(7) lines of H35Cl and the (4) line of H37Cl are clearly detected in the CRIRES spectra (left panel in Fig. 1) and are centered at 28 km s-1. The lines have full widths at half maximum of 15 km s-1. Although some of the profiles appear to be double-peaked, the S/N is low and the peaks do not match well in velocity from line to line. Further investigation will require spectra of higher accuracy. The (5), (3)–(0), and (1)–(5) absorption lines of H35Cl and the (2)–(0) and (1)–(5) absorption lines of H37Cl were detected in the IRCS spectra at the same velocity as the CRIRES detections (middle and right panels in Fig. 1). The lines as viewed by the IRCS are barely resolved.
The line equivalent widths have been measured by integrating the absorptions over the velocity intervals 1540 km s-1 for the CRIRES spectra and 050 km s-1 for the IRCS spectra. The uncertainties in equivalent widths were conservatively estimated from the standard deviations of the continuum level in nearby wavelength intervals (where the dispersion of continuum values is relatively large) multiplied by the wavelength intervals of the integration divided by the square root of the number of the data points that sample the line absorption profile.
The column densities of the lower levels of the transitions have been calculated from using
where is the wavelength of the transition, and the statistical weights of the upper and the lower states, and the spontaneous emission coefficient of the transition. The coefficients and statistical weights are taken from the HITRAN database (Rothman et al., 2009), retrieved through the web interface HITRAN on the Web888http://hitran.iao.ru/. The results are summarized in Table 1.
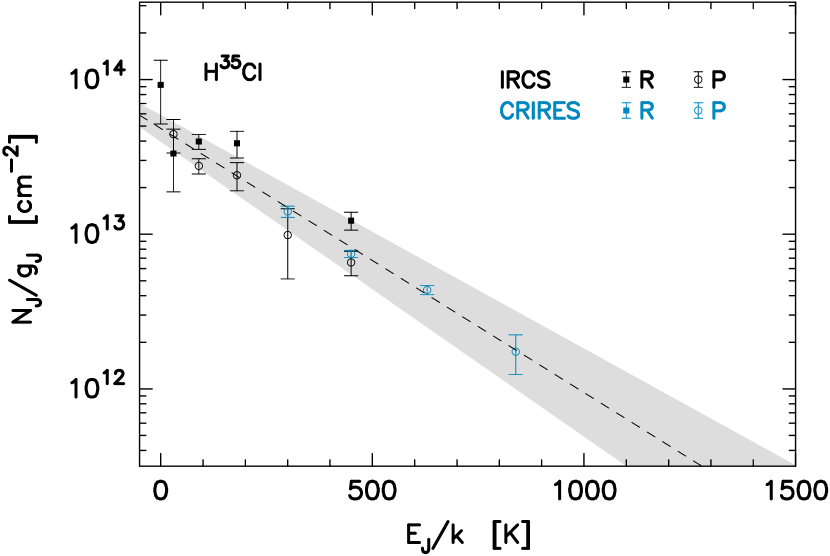
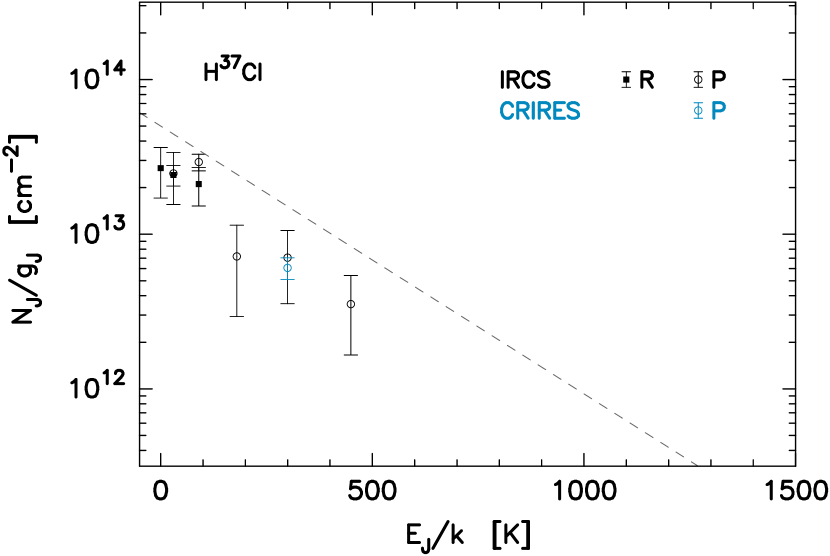
For each HCl isotopomer the level column densities divided by the statistical weights of the lower levels are plotted in Fig. 2 as a function of lower level energy. For (H35Cl) the column densities obtained from the CRIRES and the IRCS spectra can be simultaneously fit by a single straight line without adjustment between the two data sets. The total column density is given by , where is the ordinate intercept of the line and is the partition function. The latter was calculated up to =26 using the HITRAN database and the excitation temperature determined from the slope of the line. The resulting total column density (H35Cl) is (6.70.4) cm-2, and the excitation temperature is 25410 K. The uncertainties include the fitting uncertainties only. The same treatment cannot be applied to H37Cl because of insufficient sampling of the level column densities. However, the isotope ratio [H35Cl]/[H37Cl] can be estimated by comparing the level column densities at =4, as the (4) line was detected for both H35Cl and H37Cl by CRIRES. Assuming identical excitation temperatures, which is justified by the similar slopes of the population diagrams, [H35Cl]/[H37Cl] = 2.30.4. The total column density of HCl (both isotopomers) is then (9.6 0.7) cm-2.
4 Discussion
Infrared spectroscopy of 13CO by Mitchell et al. (1990) toward CRL 2136 indicates that the line of sight to the star passes through clouds with two distinct temperatures, cold gas (17 K) and warm gas (580 K), with two-thirds of the total column density residing in the warm gas. The difference between the latter temperature and that derived for HCl is discussed below. The density of the warm gas is high, as is shown by 13CO levels being populated up to at least 24 (implying cm-2). Gas at these temperatures and densities is likely to be directly involved in the star formation process, and is probably in a circumstellar envelope or disk. The intensity-weighted mean of the centers of the HCl lines (as measured by CRIRES) is 27.50.5 km s-1, which is identical within the uncertainties to that of the 13CO lines (26.52.8 km s-1 Mitchell et al., 1990) and close to that of HF (23.7–24.8 km s-1 Indriolo et al., 2013a). The above velocities are red-shifted from the systemic velocity of CRL 2136 derived from the rotational lines of CO (22 km s-1; Kastner et al., 1994) and CS (22.8 km s-1; van der Tak et al., 2000), but agree well with the radial velocity of the water masers (26.5 km s-1; Menten & van der Tak, 2004). The near-match of the velocities reinforces the above conclusion that the gas absorption lines are formed in the envelope or disk of CRL 2136. However, the small but significant positive velocity shift relative to the pure rotational emission lines suggest that the infrared-absorbing gas is infalling or contracting.
The total column density of HCl may be compared with that of molecular hydrogen, whose v=1-0 (0) line at 2.223 m was detected in absorption by Kulesa (2002). Indriolo et al. (2013a) have estimated the H2 column density in the warm component, assuming that [CO]/[H2] is constant along the line of sight and that the excitation temperature of H2 is same as that determined by Mitchell et al. (1990) from the 13CO v=1-0 lines. They obtain (H2) = (5.5–9.8) cm-2, and therefore (HCl)/(H) = (4.9–8.7). Assuming the solar abundance of chlorine, (Asplund et al., 2009) in CRL 2136, approximately 20% (15–27%) of the chlorine in the warm CRL 2136 envelope is in the form of gaseous HCl.
In diffuse clouds chlorine is singly ionized, as the ionization potential of the neutral form (13.0 eV) is slightly lower than that of atomic hydrogen; Cl+ can directly react with H2, leading to additional reactions that produce neutral HCl (see Monje et al., 2013, for details). In dense clouds, where virtually no photoionization photons are available, the formation of HCl is initiated by the proton hop reaction of Cl with H, and subsequent reaction of the cation with H2,
As the ionization fraction is very low, dissociative recombination of H2Cl+ on electrons is not important. Instead H2Cl+ participates in a second proton hop reaction with either CO or H2O,
to form HCl. In CRL 2136 the gas temperature is sufficiently high that the only slightly endothermic neutral-neutal reaction ( K)
can also contribute.
Destruction of neutral HCl is expected to be inefficient in dense clouds. Photodissociation is slow because of the lack of UV photons. Cations as reaction partners to promote more efficient ion-neutral reactions are also in short supply. Reactions with H will occur, but will lead to another cycle of HCl formation. In the circumstellar envelope of CRL 2136, where the gas is shielded from photodissociating UV photons, yet the temperature is both high enough for neutral-neutral reactions to occur and to keep HCl from accumulating on dust grains, several tens of percent of elemental chlorine are expected to be present in HCl, with most of the rest in neutral atomic form (Neufeld & Wolfire, 2009, their Fig. 13). Our result is consistent with this.
| Transition | Wavelength | Excitation | Telescope/ | Spectral | Reference | |
|---|---|---|---|---|---|---|
| Temperature [K] | Instrument | resolution | ||||
| HCl | 3.5 m | 25410 | VLT/CRIRES | =100,000 | 1 | |
| CO2 | 15.0 m | 300 | ISO/SWS | =1,500 | 2 | |
| SO2 | 7.4 m | 350 | ISO/SWS | =2,500 | 3 | |
| H2O | 6.2 m | 500 | ISO/SWS | =1,500 | 4 | |
| H2O | 2.5 m | 50625 | VLT/CRIRES | =100,000 | 5 | |
| 13CO | 4.7 m | 580 | CFHT/FTS | =37,000 | 6 | |
| HCN | 14.0 m | 600 | ISO/SWS | =1,800 | 7 | |
| C2H2 | 13.7 m | 800 | ISO/SWS | =1,800 | 7 |
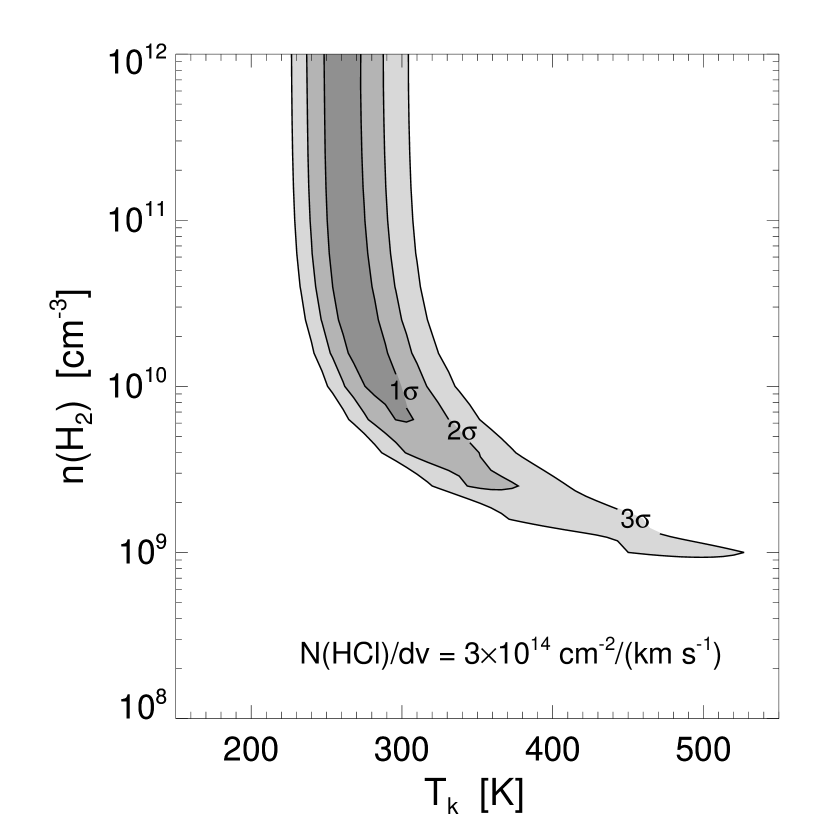
A collisional excitation and line radiation transfer model (Neufeld, 2012) has been used to estimate the gas density and the kinetic temperature (Fig. 3). The parameters that best reproduce the observed population diagram are 250 K and (H2) cm-3 for a column density over velocity (HCl) cm-2/(km s-1) that matches the observed line widths. The accurate straight line fit to the population diagram (Fig. 2) implies that the HCl is in LTE. However, as mentioned earlier, this value of the kinetic temperature is considerably lower than the temperature of 500 K determined from absorption spectroscopy of 13CO (Mitchell et al., 1990) and of H2O (Boonman & van Dishoeck, 2003; Indriolo et al., 2013b), whose lines appear to be formed in gas of similar density to the HCl lines. The reason for this difference in temperature is unclear. The high gas density required to populate the observed rotational levels of HCl clearly excludes the possibility that most of the observed HCl is in cold gas in the outer part of the dense cloud (17 K; Mitchell et al., 1990).
In terms of temperature, HCl is not the only outlier, but neither is it consistent with all other temperature determinations. Six other molecules in the line of sight, all observed using infrared absorption spectroscopy, have excitation temperatures ranging from 300 K to 800 K, which cannot be reconciled by the reported uncertainties (Table 2). Moreover, in this regard CRL 2136 may not be an exception. The excitation temperatures of different molecules have a substantial dispersion in the hot cores of six high-mass star forming regions studied by Keane et al. (2001) with some sightlines producing values from 180 K to 800 K (see their Table 1). A cautionary note for CRL 2136 is that the majority of the observations in Table 2 were made by the Infrared Space Observatory’s moderate resolution SWS spectrometer, for which vibration-rotation bands are not resolved and therefore appear broad and smooth. Excitation temperatures for these data were estimated by comparing model spectra convolved to the spectral resolution of SWS (=1500–2500) with the observed spectrum. For NGC 7538 IRS 1 Knez et al. (2009) have pointed out that, by reducing the Doppler broadening parameter from 5 km s-1 of Lahuis & van Dishoeck (2000) to 1 km s-1, which is indicated by their much higher resolution spectra, the best-fit excitation temperature decreased from 800 K to 190–230 K for C2H2 and 600 K to 250–450 K for HCN. Furthermore, they point out that bands of other molecules overlap with those of the dominant species and, if not identified, also affect temperature determinations for these species.
The band structures of HCl in the present study and of H2O by Indriolo et al. (2013b) are spectrally resolved, and each observed rotational line is velocity-resolved. Thus, the above cautionary note probably does not apply to our data. It is possible that H2O observed at high resolution by Indriolo et al. (2013b) mainly traces the hottest gas where the water ice evaporates most rapidly. The excitation temperature of HCl may be regulated by the endothermic formation reaction of HCl that sharply kicks in at 250 K. However, until more detailed observations of these and additional molecular species are available the disagreement in the excitation temperatures of the various species remains an open issue.
Acknowledgements.
We thank all the staff and crew of the VLT and Subaru Telescope for their valuable assistance in obtaining the data. We appreciate the hospitality of the Chilean and Hawaiian community that made the research presented here possible. We appreciate the constructive criticisms of the anonymous referee that improved the manuscript. M.G. is supported by DFG grant GO 1927/3-1. T.R.G. is supported by the Gemini Observatory, which is operated by the Association of Universities for Research in Astronomy, Inc., on behalf of the international Gemini partnership of Argentina, Australia, Brazil, Canada, Chile, and the United States of America.References
- Asplund et al. (2009) Asplund, M., Grevesse, N., Sauval, A. J., & Scott, P. 2009, ARA&A, 47, 481
- Blake et al. (1985) Blake, G. A., Keene, J., & Phillips, T. G. 1985, ApJ, 295, 501
- Bonnet et al. (2004) Bonnet, H., Abuter, R., Baker, A., et al. 2004, The Messenger, 117, 17
- Boonman & van Dishoeck (2003) Boonman, A. M. S. & van Dishoeck, E. F. 2003, A&A, 403, 1003
- Boonman et al. (2003) Boonman, A. M. S., van Dishoeck, E. F., Lahuis, F., & Doty, S. D. 2003, A&A, 399, 1063
- Bouchet et al. (1991) Bouchet, P., Schmider, F. X., & Manfroid, J. 1991, A&AS, 91, 409
- Clough et al. (2005) Clough, S., Shephard, M., Mlawer, E., et al. 2005, J. Quant. Spectr. Radiat. Transf., 91, 233
- Geballe & Oka (1996) Geballe, T. R. & Oka, T. 1996, Nature, 384, 334
- Hall & Noyes (1972) Hall, D. N. B. & Noyes, R. W. 1972, ApJ, 175, L95
- Indriolo et al. (2013a) Indriolo, N., Neufeld, D. A., Seifahrt, A., & Richter, M. J. 2013a, ApJ, 764, 188
- Indriolo et al. (2013b) Indriolo, N., Neufeld, D. A., Seifahrt, A., & Richter, M. J. 2013b, ApJ, 776, 8
- Kaeufl et al. (2004) Kaeufl, H.-U., Ballester, P., Biereichel, P., et al. 2004, Proc. SPIE, 5492, 1218
- Kastner et al. (1992) Kastner, J. H., Weintraub, D. A., & Aspin, C. 1992, ApJ, 389, 357
- Kastner et al. (1994) Kastner, J. H., Weintraub, D. A., Snell, R. L., et al. 1994, ApJ, 425, 695
- Keane et al. (2001) Keane, J. V., Boonman, A. M. S., Tielens, A. G. G. M., & van Dishoeck, E. F. 2001, A&A, 376, L5
- Knez et al. (2009) Knez, C., Lacy, J. H., Evans, N. J., van Dishoeck, E. F., & Richter, M. J. 2009, ApJ, 696, 471
- Kulesa (2002) Kulesa, C. A. 2002, PhD Thesis, Univ. Arizona
- Lahuis & van Dishoeck (2000) Lahuis, F. & van Dishoeck, E. F. 2000, A&A, 355, 699
- Lis et al. (2010) Lis, D. C., Pearson, J. C., Neufeld, D. A., et al. 2010, A&A, 521, L9
- Menten & van der Tak (2004) Menten, K. M. & van der Tak, F. F. S. 2004, A&A, 414, 289
- Menten et al. (2011) Menten, K. M., Wyrowski, F., Belloche, A., et al. 2011, A&A, 525, 77
- Mitchell et al. (1990) Mitchell, G. F., Maillard, J.-P., Allen, M., Beer, R., & Belcourt, K. 1990, ApJ, 363, 554
- Monje et al. (2013) Monje, R. R., Lis, D. C., Roueff, E., et al. 2013, ApJ, 767, 81
- Neufeld (2012) Neufeld, D. A. 2012, ApJ, 749, 125
- Neufeld & Wolfire (2009) Neufeld, D. A. & Wolfire, M. G. 2009, ApJ, 706, 1594
- Peng et al. (2010) Peng, R., Yoshida, H., Chamberlin, R. A., et al. 2010, ApJ, 723, 218
- Ridgway et al. (1984) Ridgway, S. T., Carbon, D. F., Hall, D. N. B., & Jewell, J. 1984, ApJS, 54, 177
- Rothman et al. (2009) Rothman, L., Gordon, I., Barbe, A., & et al. 2009, J. Quant. Spectr. Radiat. Transf., 110, 533
- Salez et al. (1996) Salez, M., Frerking, M. A., & Langer, W. D. 1996, ApJ, 467, 708
- Schilke et al. (1995) Schilke, P., Phillips, T. G., & Wang, N. 1995, ApJ, 441, 334
- van der Tak et al. (2000) van der Tak, F. F. S., van Dishoeck, E. F., Evans, N. J., & Blake, G. A. 2000, ApJ, 537, 283
- Zmuidzinas et al. (1995) Zmuidzinas, J., Blake, G. A., Carlstrom, J., Keene, J., & Miller, D. 1995, ApJL, 447, L125
Note added in proof:
The isotopomer ratio [H35Cl]/[H37Cl] derived based on the equivalent widths of (4) lines of CRIRES data might be affected by a CH doublet at 3.575 m that overlaps with the H37Cl (4) line. The combined abundance of HCl may be affected consequently. The possibility is remote, though, since CH traces diffuse gas.