The portrait of Malin 2:
a case study of a giant low surface brightness galaxy
Abstract
The low surface brightness disc galaxy Malin 2 challenges the “standard” theory of galaxy evolution by its enormous total mass M⊙ which must have been formed without recent major merger events. The aim of our work is to create a coherent picture of this exotic object by using the new optical multicolor photometric and spectroscopic observations at Apache Point Observatory as well as archival datasets from Gemini and wide-field surveys. We performed the Malin 2 mass modelling, estimated the contribution of the host dark halo and found that it had acquired its low central density M⊙/pc3 and the huge isothermal sphere core radius kpc before the disc subsystem was formed. Our spectroscopic data analysis reveals complex kinematics of stars and gas in the very inner region ( kpc). We measured the oxygen abundance in several clumps and concluded that the gas metallicity decreases from the solar value in the centre to a half of that at kpc. We found a small satellite projected onto the galaxy disc at 14 kpc from the centre and measured its mass (1/500 of the host galaxy) and gas metallicity (similar to that of Malin 2 disc at the same distance). One of the unique properties of Malin 2 turned to be the apparent imbalance of the interstellar media: the molecular gas is in excess with respect to the atomic gas for given values of the gas equilibrium turbulent pressure. We explain this imbalance by the presence of a significant portion of the dark gas not observable in CO and the Hi 21-cm lines. We also show that the depletion time of the observed molecular gas traced by CO is nearly the same as in normal galaxies. Our modelling of the UV-to-optical spectral energy distribution favours the exponentially declined star formation history over a single-burst scenario. We argue that the massive and rarefied dark halo which had formed before the disc component well describes all the observed properties of Malin 2 and there is no need to assume additional “catastrophic” scenarios (such as a major merging) proposed previously to explain the origin of giant LSB galaxies.
keywords:
galaxies: individual: Malin 2; galaxies: ISM; cosmology: dark matter1 Introduction
A challenging task in contemporary extragalactic astrophysics is the development of a general theory of galaxy evolution consistent with modern cosmological concepts. With the advances in observational methods, numerous phenomena were revealed which become hard to explain within the existing and presently accepted evolutionary models. Therefore, eliminating contradictions between theory and observations has nowadays the crucial importance. For this purpose, it is useful to study in detail some peculiar objects that could have formed under unusual conditions “on the edge of the parameter space”: thanks to them we can perform critical tests to constrain theories of galaxy formation.
One such prominent peculiar galaxy class is low surface brightness (LSB) galaxies possessing discs with central -band surface brightness values staying below 22.5 mag arcsec-2. It includes a significant subset of galaxy population, in particular among dwarfs (Bothun et al., 1997; O’Neil & Bothun, 2000; Zhong et al., 2008). Moreover, we have to keep in mind that their number is likely underestimated due to the selection effects because they are difficult to observe. But, on the other hand, in most LSB galaxies the dark matter is assumed to dominate at all distances from the centre (Bothun et al., 1997) which makes them very attractive targets to study the dark haloes directly and gives some clues to the verification of different galaxy formation models (e. g. Macciò et al., 2007).
However, this galaxy class is not entirely homogeneous in observational properties. For example, there are both, metal poor LSB dwarfs and giant galaxies with redder colours and nearly solar values of [O/H]. The latter subclass includes objects such as Malin 1, Malin 2, UGC 6614 and some others.
LSB galaxies are believed to have thinner discs (Matthews, 2000; Bizyaev & Mitronova, 2002, 2009; Khoperskov et al., 2010) with larger exponential scalelengths (Zhong et al., 2008; Bothun et al., 1997; Bergvall et al., 1999) than “normal” galaxies. The bulges occur very rarely in LSB galaxies and are smaller in size than those in classical spirals. Typically, the bulge mass correlates with the metallicity (Galaz et al., 2006) and LSB galaxies follow this trend. From the dynamic modelling of rotation curves it turns out that the dark haloes contribute significantly to the total mass of LSB galaxies and that they are described rather by the pseudo-isothermal sphere than by the cuspy profile (Pickering et al., 1997; Swaters et al., 2003; Kuzio de Naray et al., 2006). Cosmological simulations show that LSB galaxies reside preferentially in the relatively less concentrated and fast-rotating dark haloes (Mo et al., 1998; Bullock et al., 2001; Macciò et al., 2007; Kim & Lee, 2013).
In the studies of physical conditions in low surface brightness discs the main points we need to understand is whether (1) the stellar disc surface density is low or (2) the stellar mass-to-light ratio (M/L) is high. The low disc density assumption requires low star formation rates and, hence, results in slow evolution. The second scenario involves the heavy baryon disc probably due to unusual bottom-heavy stellar initial mass function (IMF) (Fuchs, 2002; Saburova, 2011; Lee et al., 2004) which reduces the dark matter fraction estimates for these galaxies. In both cases, the most important subject of the study is the structure of the interstellar medium (ISM) in LSB galaxies.
The properties of the gas in LSB galaxies are often considered to be similar to ones at the periphery of the normal galactic discs (e.g. Abramova & Zasov, 2011). In particular, the observed gas surface density is too low for the large-scale gravitational instability (e.g. Pickering et al., 1997; Bothun et al., 1997). Hence, the common point of view exists that LSB galaxies lack molecular gas H2 (see Abramova & Zasov, 2011; O’Neil et al., 2003, and references therein). Therefore, the detection of H2 in the discs of some LSB galaxies in itself was a surprise (Das et al., 2006, 2010). Since we observe the UV-radiation of LSB discs (e.g. Boissier et al., 2008) then the question arises about how they can form stars in the conditions of the H2 shortage. What type of non-gravitational instability does play a key role here? Is the formation of stars directly from the atomic gas possible?
The observed features of LSB galaxies are often connected their poor environment (Rosenbaum & Bomans, 2004) and are considered to be the result of a the slow evolution (Bothun et al., 1997) thus explaining the observed unutilized atomic gas (O’Neil, 2000). A wide range of colours of LSB galaxies indicates that they might be observed at various evolution stages. The question is whether there is a single key mechanism responsible for the formation of low surface brightness discs for all sub-types of LSB galaxies.
The subject of our study is Malin 2 which is a member of the giant LSB galaxy family and possesses a number of peculiar properties. Despite its enormous total mass M⊙ and the size of kpc, Malin 2 has an extended disc with a clear spiral structure (the plateau of rotation curve is about 350 km s-1). Some difficulties exist to form this object within the hierarchical clustering concept in which the dark haloes hosting disc galaxies do not experience major mergers. So the dark halo of Malin 2 could not have undergone any significant transformation. On the other hand, in order to form a giant LSB disc, at some moment its progenitor, supposedly a “normal” size galaxy, should have experienced a catastrophic scenario of interaction with a companion (Mapelli et al., 2008; Peñarrubia et al., 2006). Although in most cases such interaction overheats and destroys the disc (e.g. Wilman et al., 2013) there may be a narrow range of parameters under which it can lead to the formation of a low surface brightness disc with a large scalelength (as those observed in giant LSBs). However, the central surface density in such interaction scenarios is difficult to change (e.g. O’Neil et al., 1998). The result is a very questionable picture that an unusual progenitor, already an LSB galaxy with the peculiar giant halo experienced a rare catastrophic scenario.
In this work we attempt to create a self-consistent portrait of the galaxy Malin 2 taking into account new observing data. The paper is organized as follows. Section 2 presents an overview of the photometric and kinematic observations and data reduction procedures. Sect. 3 presents the modelling of spectral energy distribution (SED). In Sect. 4, we describe the mass distribution model of Malin 2. In Sect. 5 we analyze the balance of gas components and estimate the turbulent pressure of the ISM. In Sect. 6 we discuss possible reasons for high fraction of molecular gas observed in the galaxy. There we also review the star formation history and the evolutionary scenarios suitable for Malin 2. Our conclusions are presented in Sect. 7.
2 Observations and data reduction
| Names | Malin 2 | ref. |
| F 568-06 | ||
| PGC 086622 | ||
| Equatorial coordinates | 10h39m52.483s | |
| (J2000.0) | [1] | |
| Distance | Mpc | [5] |
| Morphological type | Scd | [2] |
| Inclination angle | deg | [3] |
| Position angle | deg | [3] |
| kpc | [1] | |
| kpc | ||
| kpc | ||
| mag | [2] | |
| mag | [2] | |
| [4] | ||
| M⊙ | [5] | |
| M⊙ | [3] |
References: [1] NED (http://ned.ipac.caltech.edu), [2] HYPERLEDA (http://leda.univ-lyon1.fr), [3] Pickering et al. (1997), [4] McGaugh (1994), [5] Das et al. (2010).
aradius of the B-band 25 mag arcsec-2 isophote;
beffective R-band radius of bulge;
cthe stellar disc R-band radial scalelength;
dabsolute B-band magnitude;
egas metallicity;
fmolecular gas mass;
gatomic gas mass.
To provide basic comparison of Malin 2 with normal galaxies, we briefly discuss its position on known scaling relations of disc galaxies. The basic properties of Malin 2 are given in Table 1.
In the Tully-Fisher (1977) diagram vs , Malin 2 has the -band luminosity slightly lower than expected for such a rotation amplitude in normal spirals but it still remains within the uncertainties and in a good agreement with the relation found by McGaugh (2005). Malin 2 follows the correlation of disc scalelength vs. absolute -band magnitude found for the sample of LSB galaxies by Bergvall et al. (1999). At the same time, its scalelength is significantly higher than that in spiral galaxies of similar luminosities. Although, by some of its observational parameters Malin 2 looks like a high surface brightness (HSB) galaxy which by some reasons has an expanded giant disc. The gas mass fraction in Malin 2 is lower than that for the majority of LSBs (see e.g. van den Hoek et al. (2000) for the characteristic gas fraction of LSBs) and it is close to that expected in normal spirals. The oxygen abundance of Hii regions found by McGaugh (1994) is close to the solar value which is unusual for LSB systems which are often metal poor. However, on the stellar mass — metallicity diagram Malin 2 appears to be shifted toward lower metallicities compared to galaxies of the same stellar mass from the sample of Kuzio de Naray et al. (2004).
2.1 Photometric observations
To add constrains on the disc and bulge surface densities and radial scales to our dynamical modelling, we performed surface photometry of Malin 2 in the BVR bands using the observations collected with the 0.5m Apache Point Observatory telescope. In addition, we incorporate the archival griz photometry from Sloan Digital Sky Survey Data Release 7 (Abazajian et al., 2009) and archival g-band photometry from GMOS-N (Gemini). The photometric data were reduced in a standard way using the iraf and midas software packages111 midas is developed and maintained by the European Southern Observatory. iraf is distributed by NOAO which is operated by AURA, Inc. under contract with the NSF.. To calibrate our BVR-images, we observed photometric standard stars from Landolt (1992, 2009) during the same nights. The archival images from SDSS and GMOS-N were calibrated according to the information available at the official web sites222http://www.gemini.edu/ and http://www.sdss.org/ and the FITS file headers. The foreground stars were removed from all galactic images and replaced by the mean fluxes of surrounding regions before further analysis.
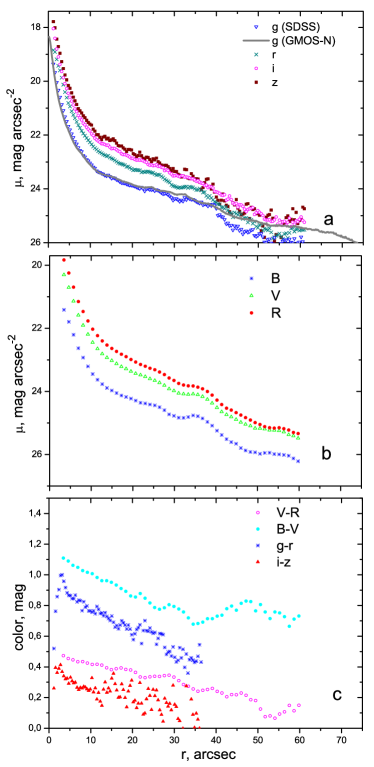
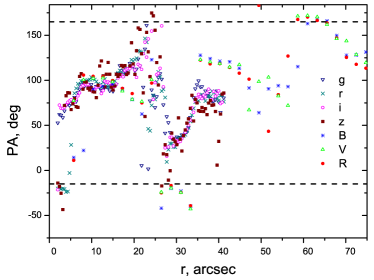
Using tools from midas, we calculated the radial profile of the position angle in all photometric bands (see Fig. 1). We obtained the azimuthally averaged radial light and colour profiles (Fig. 2) using ellipses with radially constant flatness and position angle deg. We corrected them for the Galactic extinction according to Schlafly & Finkbeiner (2011) but not for the internal extinction and the disc inclination.
| Date | 5/05 | 6/05 | 7/05 | 8/05 | 9/05 | |
| Band | Exposition time | seeing | ||||
| sec | arcsec | |||||
| B | 2900 | 4900 | 5900 | 4900 | 3900 | 2.2 |
| V | 900 | 3900 | 4900 | 4900 | 3900 | 2.0 |
| R | 900 | 3900 | 4900 | 4900 | 3900 | 2.1 |
The bump clearly seen in the surface brightness profiles at arcsec (Fig. 2a,b) is due to the prominent spiral arm patch located at this galactocentric distance. The colour profiles show significant gradients (Fig. 2c). The same colour gradient was found earlier by Bothun et al. (1990), however their values are somewhat mag bluer than those obtained in our study. In order to verify our colours we compared two types of photometric calibrations: that from the Landolt stars, and another one using the stars with available SDSS photometry located in our galaxy images. Both calibration types yielded the same colour index values.
In order to construct the dynamical model of Malin 2 (Section 4) we need to estimate the structural parameters of its bulge and disc. For that purpose we performed the 2D decomposition of the images into the following components: a disc with an exponential radial brightness distribution and a Sersic bulge . We used the BUDDA code333http://www.sc.eso.org/dgadotti/budda.html (de Souza et al. (2004), version 2.2).
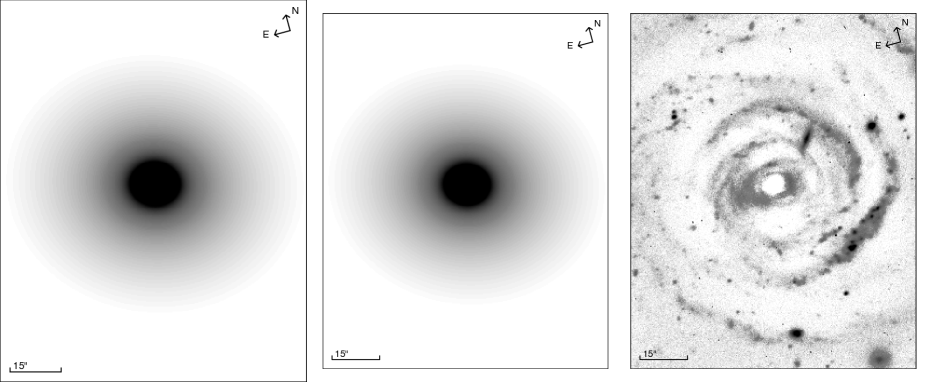
The 2D decomposition results are presented in Fig. 3, where the best-fitting model and the observed Gemini -band images are shown next to the residuals. The images have the same scale and contrast. The panel on the left also shows the slit positions for our spectroscopic observations (see below). The structural parameters of disc and bulge of Malin 2 are provided in Table 3.
| Band | |||||
|---|---|---|---|---|---|
| arcsec | mag arcsec-2 | arcsec | mag arcsec-2 | ||
| (1) | (2) | (3) | (4) | (5) | (6) |
2.2 Gemini-North spectroscopy
The spectroscopic data for Malin 2 were collected using GMOS-N spectrograph on the 8-m Gemini-North telescope under science program GN-2006B-Q-41 (P.I.: C. Onken) in January 2007. The data were obtained using the long-slit setup (0.5 arcsec wide slit) with the B1200+G5301 grating providing a wavelength coverage between 4800 and 6200Å with the spectral resolving power of . The six 1800 sec long exposures (a total of 3 hours) were obtained for the slit position deg which corresponds to the minor axis of the Malin 2 disc (see the horizontal dashed lines in Fig. 1). We retrieved this publicly available dataset from the GEMINI science archive444http://www.cadc-ccda.hia-iha.nrc-cnrc.gc.ca/gsa/ in order to study of the central region of Malin 2.
2.2.1 Data reduction
We reduced the data using our own GMOS data reduction pipeline constructed on top of the universal long-slit and IFU data reduction toolbox implemented in idl. The data reduction was done independently for every science exposure (including spectrophotometric standard stars). The data reduction was identical to that of long-slit GMOS spectra presented in Francis et al. (2012) except the object extraction step which was skipped here because we were dealing with the extended galaxy. The GMOS-N detector is a 3-chip mosaic and we performed primary data reduction steps on per-chip basis which included: bias subtraction, bad/hot pixel masking, cosmic ray rejection, modelling the diffuse light in the spectrograph by using the flux in two slit bridges and outside the slit. Then the individual chips were mosaiced together, and processed through the rest of the data reduction steps: flat fielding, wavelength calibration, sky substraction with the Kelson (2003) technique, flux calibration using a spectrophotometric standard star.
The uncertainty frames were computed from the photon statistics and the read-out noise values, and processed through exactly the same data reduction steps in order to estimate the flux uncertainties.
2.2.2 Data analysis
We used the nbursts full spectral fitting technique by Chilingarian et al. (2007a, b) with the stellar population models based on ELODIE.3.1 (Prugniel et al., 2007) empirical stellar library in order to determine internal kinematics, ages, metallicities and mass-to-light ratios of stars.
The nbursts full spectral fitting package implements a pixel-to-pixel fitting algorithm. Generally, an observed spectrum is approximated by a linear combination of stellar population models broadened with the galaxy’s parametric line-of-sight velocity distribution, whose parameters (e.g. SFH, metallicity, initial mass function) are determined inside the same minimization loop as the internal kinematics. The fitting procedure includes a multiplicative polynomial continuum aimed at absorbing possible flux calibration issues both, in observations and in the models.
For the spectral fitting we use two sets of stellar population models with different star formation histories — exponentially declining model (exp-SFH) and a single instantaneous burst (Simple Stellar Population — SSP), both are computed with the pegase.hr code (Le Borgne et al., 2004) based on the ELODIE.3.1 empirical stellar library. The SSP stellar population models are characterized by metallicity and age, the exp-SFH models — by metallicity and the exponential decay time scale . The starting epoch of the star formation in the exp-SFH model is set at the Big Bang (13.7 Gyr minus the light travel time). The model grids were computed with the pegase.hr evolutionary synthesis code at the intermediate spectral resolution () in a wavelength range 3900–6800Å for the Salpeter (1955) and Kroupa (2001) stellar initial mass functions for the SSP and exp-SFH models respectively. We used the 25-th order multiplicative polynomial continuum. The model grids were pre-convolved with the spectral line spread function of GMOS-N spectrograph, which was determined from strong airglow lines in the spectra. The mean instrumental dispersion is km s-1. In order to achieve the required signal-to-noise ratio (S/N=10) per spatial bin, we performed adaptive binning of the spectra in the spatial direction.
An emission-line spectrum of every spatial bin was obtained by subtracting the stellar contribution (i.e., the best-fitting stellar population model) from the observed spectrum. This step provided a pure emission spectrum uncontaminated by absorption lines of the stellar component that is especially important for the Balmer lines. Then we fitted emission lines with Gaussians pre-convolved with the instrumental resolution in order to determine the line-of-sight velocities of the ionized gas and emission-line fluxes.
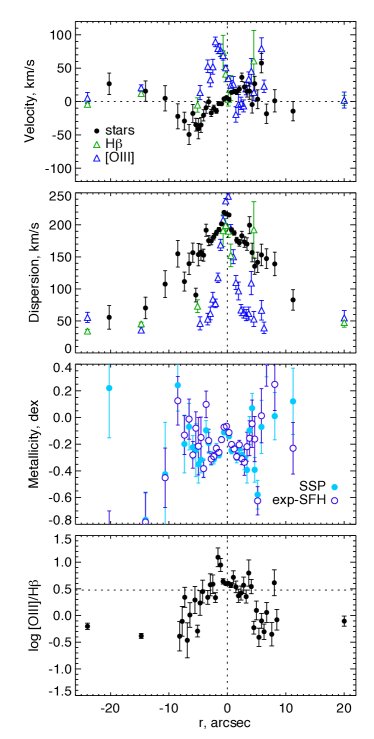
The best-fitting values of radial velocity, velocity dispersion, metallicity of the stellar component as well as kinematics of ionized gas and emission line ratios are shown in Fig. 4. Despite the orientation of the long slit along the minor axis of the galaxy, the stellar radial velocity profile reveals a solid-body rotation with amplitude up to 40 km s-1 in the central 5–7 arcsecs. This kinematic feature in the central part of the galaxy can be related to the bulge triaxiality confirmed indirectly by variation of position angles of isophotes with radius, see Fig. 1. Alternatively, the noticeable rotation along the minor axis could be supported by either a bar or a nuclear polar ring, however none of these structures is detected in the residual image after the 2D photometric model subtraction. The strong asymmetrical non-circular motions in the central region are seen in both stellar and ionized gas components. The peculiar gas kinematics within kpc cannot be explained by the weak nuclear activity detected by Ramya et al. (2011). The weak AGN activity is also supported by our measurements of the line ratio (all Hii regions reside below the ) on the BPT diagram (Baldwin et al., 1981; Kewley et al., 2006). Beyond the central 7 arcsec, the gaseous and stellar kinematics indicates negligible rotation, which is expected along the minor axis.
Our estimates of gas and stellar metallicities reveal the gradient from almost solar value in the centre decreasing to [Z/H]= dex outside the bulge dominating region. Measurements of the stellar metallicity outside the bulge area are very uncertain due to the low signal-to-noise and are not suitable for satisfactorily chemical analysis of the galactic disc.
The SSP-equivalent measurements of metallicity in the bulge-dominated region indicate very old stellar population, Gyr, while the exponential decay timescale values are at the lower limit of our exp-SFH model grid ( Myr).
2.3 Spectroscopy at the Apache Point Observatory 3.5m ARC telescope
2.3.1 Observations and data reduction
We observed Malin 2 with the Dual Imaging Spectrograph (DIS) at the 3.5 m ARC telescope at the Apache Point Observatory in the low-resolution setup during the nights of 26 December 2011 and 21 January 2012. Table 4 presents the observing log. The standard night-time dome calibrations (bias, He-Ne-Ar arc lamp and quartz flat field lamp) were obtained. We observed the spectrophotometric white dwarf standards Feige 34 and GD 153 in order to perform the flux calibration.
| Date | Slit PA, deg (1) | Exp. time (2) | Blue sp. range (3) | Blue disp. (4) | Red sp. range (5) | Red disp. (6) |
|---|---|---|---|---|---|---|
| 26 Dec 2011 | ||||||
| Slit #1 | 90 | 80 min | 4600-5600Å | 0.6Å/pix | 6015-7190Å | 0.6Å/pix |
| Slit #2 | 0 | 60 min | 4600-5600Å | 0.6Å/pix | 6015-7190Å | 0.6Å/pix |
| Slit #3 | 40 | 80 min | 4600-5600Å | 0.6Å/pix | 6015-7190Å | 0.6Å/pix |
| 21 Jan 2012 | ||||||
| Slit #4 | 90 | 120 min | 3500-5600Å | 1.8Å/pix | 5250-9100Å | 2.3Å/pix |
| Slit #5 | 40 | 120 min | 3500-5600Å | 1.8Å/pix | 5250-9100Å | 2.3Å/pix |
We reduced the spectra in the standard way within iraf using the ccdred, crutil, onedspec, and twodspec packages. We used sky lines in order to correct the distortion in 2-D spectral frames. Our spectra from 2012, where the red and the blue spectral ranges overlap, suggest that the accuracy of relative flux calibration between the red and blue parts is better than 8 per cent.
The spectra at slit positions crossing bright parts of spiral arms in Malin 2 exhibit well visible emission lines. Unfortunately, our 2011 setup did not allow us to observe the [Oii]3727 Å line, although we were able to get it in 2012. As a result, we were able to apply the oxygen abundance estimator (Pagel et al., 1979; Pilyugin & Thuan, 2005) only to our 2012 data. Spectral range in all spectra from both 2011 and 2012 enables us to estimate the oxygen abundance from the N2 and O3N2 indicators (in calibration by Storchi-Bergmann et al., 1994; Marino et al., 2013; Alloin et al., 1979; Pettini & Pagel, 2004, respectively). Table 5 summarises our oxygen abundance estimates (in terms of 12+log(O/H)). The average value of 12+log(O/H) through the disc of Malin 2 is 8.54 0.10 dex (the internal uncertainty, whereas the calibration uncertainty is at least 0.2 dex), which corresponds to the metallicity dex. The latter value is in good agreement with the value 8.59 found by McGaugh (1994). Table 5 also suggests the abundance gradient consistent with that estimated from Gemini spectroscopy.
| Clump | r, kpc | 12+log(O/H) | ||
|---|---|---|---|---|
| N2 | O3N2 | |||
| 1 | 32.8 | – | 8.36 | 8.42 |
| 2 | 25.1 | – | 8.64 | 8.60 |
| 3 | 32.2 | – | 8.63 | 8.51 |
| 4 | 31.9 | 8.49 | 8.46 | 8.46 |
| 5 | 21.5 | 8.57 | 8.65 | 8.68 |
| 6 | 24.6 | 8.18 | 8.70 | 8.71 |
| 7 | 26.6 | 8.61 | 8.55 | 8.58 |
| 8 | 28.1 | 8.67 | 8.56 | 8.58 |
| Candidate satellite S1 | ||||
| S1 | 13.2 | – | 8.64 | – |
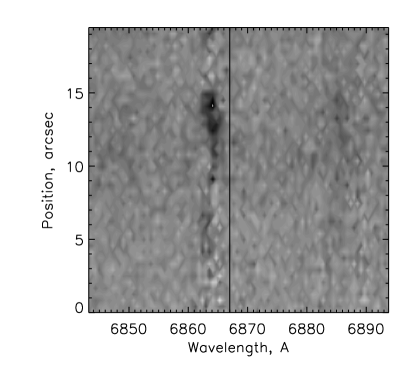
One of our slits in the 2011 observing run passed through a concentration at 14 arcsec (13.7 kpc) to the N-W of the nucleus of Malin 2, see S1 object in Fig. 3. Although we suspect this object can be a satellite galaxy, it also resembles a fore- or background edge-on galaxy, or a concentration in the spiral arm of the main galaxy. Thus, we analysed the spectra to identify the nature of this object. Figure 5 shows the spectra of the clumps in the candidate satellite galaxy near H. They suggest that the candidate has 110 km s-1 radial velocity difference with Malin 2, and hence probably resides at the same distance as the main galaxy. It is difficult to decide from the spectra if the satellite is above or below the galactic plane of Malin 2.
The images we presented above show that the satellite looks as a quite flattened galaxy. Our spectra indicate that the satellite has the amplitude of the rotation curve of about 65 km s-1, although the rotation curve inferred from Fig. 5 looks far from regular. We estimate the size of the satellite as 8.3 arcsec (8.1 kpc) from the photometry and spectroscopy. Its mass derived from the amplitude of the rotation curve and size given above is 4109 M⊙, or 1/500 from Malin 2 (see Tab. 7), i.e. this is a small galaxy or a remnant of a larger progenitor. It is worth mentioning that the stellar mass estimate of this satellite made from the band photometry, 1/600 of the Malin 2 mass, is fully consistent with the dynamical estimate within uncertainties. The oxygen abundance in this satellite is close to that in the spiral arms of the main galaxy.
2.3.2 Closed box model of chemical evolution
Our abundance estimations together with the results of the mass modelling (see Sect. 4) can be used to determine the effective oxygen yield . The effective yield is defined in a closed box model, where the system is supposed to be isolated and having zero metallicity at the beginning of evolution. The gas is assumed as chemically homogeneous at a given galactocentric distance, the IMF does not change with time. The instant recycling approximation is implied. In this model one can define the metallicity in the following way (see e.g. Edmunds, 1990)
where is the ratio of gas (taking into account the helium) to total (gas + stars) surface density at given radius. If accretion or outflow of gas occurs in the disc, the value of will be lower than the real yield (see Edmunds, 1990). Here we can use effective oxygen yield
where is oxygen to total mass fraction, to test the closed box model for Malin 2. We obtained the following effective oxygen yield and for the oxygen abundances reported above. At the same time, Pilyugin et al. (2007) obtained for inner parts of luminous spiral galaxies. The former value of the effective yield is higher than that from Pilyugin et al. (2007), which could indicate that the corresponding oxygen abundance is overestimated, the second value is more realistic and gives us an evidence that accretion of metal poor gas perhaps took place in Malin 2 during its evolutionary history.
3 SED modelling
In comparison with the central region of the galaxy, the outer regions have very low signal-to-noise and hence we cannot precisely model the disc stellar population there. Using the disc contribution revealed by the 2D decomposition derived from broad-band images and adding GALEX colours we consider spectral energy distribution (SED) of the disc component of Malin 2. We fitted it using stellar population synthesis models computed with pegase.2 (Fioc & Rocca-Volmerange, 1997) code with the low-resolution BaSeL synthetic stellar library (Lejeune et al., 1997).
In order to determine the best-fitting photometric model we performed the -minimization of residuals between the observed disc SED and that of the stellar population models using a special version of the NBursts+phot technique (Chilingarian & Katkov, 2012). The default mode in this technique is simultaneous fitting of the spectral and photometric distributions with computed as a sum of the spectral and photometric contributions. The latter term is added with certain weight . In order to fit the photometric SED we chose weight , which corresponds to the negligible spectral contribution. The dust attenuation is not included to the model parameters since only a small amount of dust is observed in giant LSB galaxies (Hinz et al., 2007).
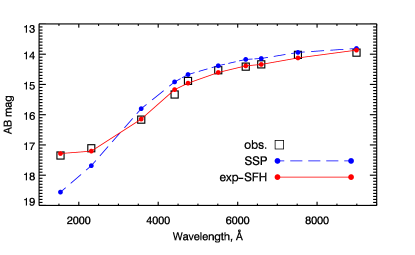
For the spectral fitting we apply two sets of stellar population models with different SFH and IMF – the exponentially declining SFH for the Kroupa IMF and SSP models with the Salpeter IMF. The best-fitting models both for exponentially declining SFH and SSP models are shown in Fig. 6. One can see that the exponentially declining model is preferred over SSP because it fits much better the UV photometric points.
4 The mass modelling
Pickering et al. (1997) obtained the 21-cm Hi rotation curve of Malin 2. Because of the beam smearing effect leading to low angular resolution ( arcsec) these data are not suitable for detailed modelling of the central part of the galaxy, however they still can be used to constrain the mass of its main components. Pickering et al. (1997) utilized identical mass-to-light ratios for the bulge and disc components and did not take into account any spectrophotmetric information in the rotation curve modelling presented in their paper. We construct a more elaborated model using our new photometric and spectral data. We decompose the rotation curve into four components: pseudo-isothermal halo, exponential stellar disc, Sersic bulge and gaseous disc. We use the gaseous disc surface density derived by Pickering et al. (1997). The M/L ratios for the bulge and disc were obtained from our spectra and SED modelling, respectively. We chose the pseudo-isothermal dark halo density profile instead of cosmologically predicted Navarro et al. (1996) (NFW) profile because the central parts of rotation curves of LSB galaxies are better described by the cored pseudo-isothermal halo than by the cuspy profile (see, e.g. Kuzio de Naray et al., 2008). Worth mentioning that the poor spatial resolution of the Hi rotation curve does not allow us to distinguish between these two profiles.
We assume that mass follows light in the stellar disc and bulge radial profiles. The M/L ratios of disc and bulge were calculated from SED and spectral fitting using exponential star formation history and Kroupa stellar IMF. We obtain , M⊙/L⊙ and , M⊙/L⊙ for the and bands, respectively. At the same time the observed colour profiles and stellar population models by Bell & de Jong (2001) give the mean mass-to-light ratios of the disc and bulge , M⊙/L⊙ which are higher than expected from spectral and SED fitting. We cannot fully explain this difference by the choice of different IMFs (Bell & de Jong (2001) used the scaled Salpeter IMF whereas we utilized the Kroupa IMF) because according to Portinari et al. (2004) the M/L — colour relationship obtained for scaled Salpeter IMF is practically identical to that based on the Kroupa IMF. The Bell & de Jong (2001) models do not account for variations in the star formation history in the galaxies which are known to have very strong effect on stellar M/L ratios. As demonstrated in Chilingarian & Zolotukhin (2012), stellar populations with exponentially declining and instantaneous burst (SSP) SFHs might have their -band M/L ratios different by a factor of 3 while the observed colours will be identical.
The comparison between the observed rotation curve and its model is shown in Fig. 7. The discrepancy visible in the central part of the rotation curve could be due to the unaccounted beam-smearing effect that makes the rotation curve shallower in the centre (see Lelli et al., 2010).
| M⊙ | |||||
|---|---|---|---|---|---|
| 0.25 | 0.43 | 0.30 | 0.02 | 3.13 | |
| 0.12 | 0.81 | 0.04 | 0.02 | 22.4 |
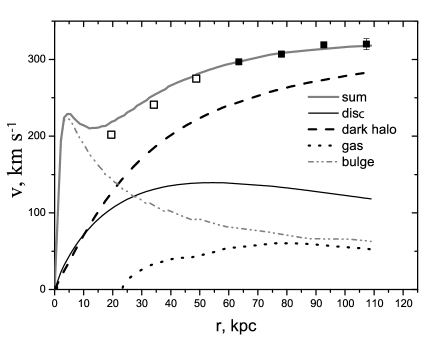
Our results of the mass modelling are provided in Table 6. Our model shows that the dark halo is not dominating in the inner region, but its mass fraction is approximately 80 per cent within four disc scalelengths. The obtained photometrical model is close to the “maximum disc” model. This conclusion is in a good agreement with that made by Lelli et al. (2010) who considered two giant LSB galaxies (Malin 1 and NGC 7589) and concluded that “maximum disc” assumption produces the stellar mass-to-light ratios in the range typical the for high surface brightness (HSB) galaxies.
We obtain the following parameters for the dark halo in Malin 2: asymptotic velocity km s-1, and the core radius kpc which correspond to the central density of the dark halo Mpc-3 (for comparison, the Milky Way’s dark halo has Mpc-3 and 5.0 kpc by Mera et al., 1998). These parameters indicate that Malin 2 possesses a low density dark halo with large core radius, in a contrary to the galaxies from THINGS survey (de Blok et al., 2008) having smaller core radii and higher densities. The peculiar parameters of the dark halo of Malin 2 might give us a clue to understand its formation history (see Sect. 6).
Another important conclusion is that masses of the stellar bulge and disc obtained by applying the mass-to-light ratio from SED and spectral modelling to the surface photometry data are close to the maximum values that could be compatible with the rotation curve. Increasing the masses significantly would lead to the discrepancy between the model and observed rotation curves. Therefore, the disc can not contain a large fraction of unseen dark matter because in this case its stellar mass should be much less than maximum allowed for given rotation curve.
5 Turbulent gas pressure and molecular gas fraction
Malin 2 belongs to the class of LSB galaxies which is expected to have unique properties of the interstellar medium. For a long time their low brightness has been thought to go hand in hand with the lack of conditions to form molecular clouds. The observed atomic surface density of LSB discs is below the threshold of gravitational instability (see e.g. Pickering et al., 1997; Bothun et al., 1997). Therefore, significant amount of molecular gas recently detected in the discs of giant LSB galaxies is striking (Das et al., 2006). Das et al. (2010) obtained maps of Malin 2 in the line and estimated the total molecular mass (within arcsec) in the range of M⊙ adopting the standard conversion factor (K km/s) cm-2.
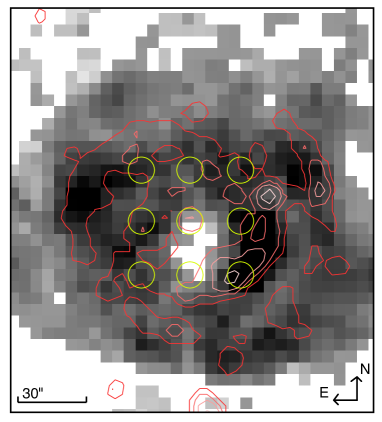
In our work we use the local values of the H2 surface density in nine areas presented by Das et al. (2010) (these areas cover, in addition to the centre, the ring from 24 to 40 kpc by radius). We took the information about the atomic hydrogen from Pickering et al. (1997). According to their results, there is a hole in the Hi distribution in the central region of the disc that is probably associated with the AGN feedback (see Fig. 8). Outside 60 kpc the atomic gas is distributed slightly asymmetric with respect to the galactic centre (the Northern Hi semi-major axis is longer than the Southern one). Pickering et al. (1997) also found high velocity gas to the South-West of the centre, which corresponds to the star forming spiral arm (the mass of this gas is about M⊙). The total Hi mass estimated by Pickering et al. (1997) is M⊙, what implies that the contribution of the molecular gas is per cent if H2 does not extend beyond arcsec. Moreover, its local555Here the averaging is done in the areas with a diameter of about arcsec shown in Fig. 8. density contribution in the disc can reach per cent, typical for normal spiral galaxies. The local observed total gas surface density is less than 5 M⊙/pc2. The one-dimensional velocity dispersion of the atomic and molecular gas is found to be km s-1 and km s-1, respectively (Pickering et al., 1997; Das et al., 2010). Worth mentioning that the velocity dispersion of molecular gas which is higher than that of atomic gas looks unrealistic, and is most likely a result of beam smearing due to the low spatial resolution of observations. However, if we decrease this value by a factor of (to make it closer to normal galaxies) it will not affect our further conclusions significantly.
The balance of the gas components HiH2 in galactic discs is closely related to the total gas surface density and metallicity (Krumholz et al., 2009) and the equilibrium turbulent gas pressure (Blitz & Rosolowsky, 2006). For normal spiral galaxies the dependences and (where is the ratio of the surface densities of H2 and Hi) behave similarly. However, these key correlations are broken when considering unusual objects, for example low-metallicity dwarf galaxies (Fumagalli et al., 2010) or members of galactic clusters exposed to environmental effects (Kasparova, 2012) which significantly complicate their interpretation.
In this work we investigate the reason for the high fraction of the molecular gas in the disc of Malin 2 in terms of pressure (although these arguments can be extended to the relation). We calculated the gas pressure from the gas volume density in the disc midplane under the assumption of a constant turbulent velocity dispersions and but taking into account the gas self-gravity, the radial profile of stellar disc thickness and the dark matter halo contribution to the galactic gravitational potential. The volume density is found through a self-consistent solution of the equations describing the vertical structure of the stellar, atomic, and molecular disc components. This approach was proposed by Narayan & Jog (2002) for our Galaxy and was developed and applied by Kasparova & Zasov (2008), Abramova & Zasov (2011) and Kasparova (2012) for other galaxies.
The key equation is obtained from the condition of the vertical hydrostatic equilibrium and the Poisson equation:
| (1) |
where index denotes each of the disc components (stars, Hi, H2), is the volume density and is the turbulent velocity (effective speed of sound) along -axis. The term in brackets corresponds to the total potential of the disc and is the pseudo-isothermal spherical dark matter halo. The system of equations for the stellar disc and the gas subsystems was solved numerically by the fourth-order Runge-Kutta method with boundary conditions in the disc midplane : and (for more details, see Kasparova & Zasov, 2008).
To solve eq. 1 in the nine areas with the measurements of H2 and Hi surface densities we specify the surface density of stellar disc and the dark matter halo parameters obtained from our mass model (see Section 4). The stellar velocity dispersion is determined from the rotation curve modelling and the surface density of the disc under the assumption of its marginal stability. As it was shown by Kennicutt (1989), Zasov et al. (2004) and Zasov et al. (2011), discs of most spiral galaxies are close to the marginal gravitational stability. Besides, there are no reasons to believe that the LSB discs are overheated.
Solutions of eq. 1 are the volume densities in the disc midplane and the scalelheights of stellar, atomic and molecular components for the considered nine areas. These values are in good agreement with those obtained for Malin 2 by Abramova & Zasov (2011) in a similar manner but using slightly different stellar profile and halo parameters and without taking into account the H2 components.
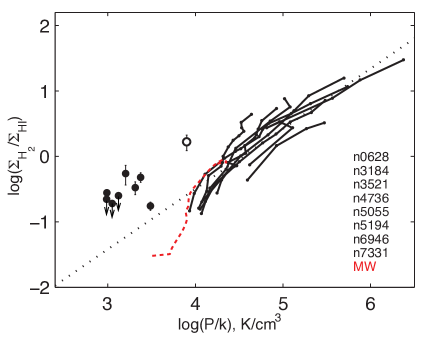
In Fig. 9 we compare the position of Malin 2 (circles) on the molecular gas fraction versus turbulent gas pressure diagram with those of normal spiral galaxies (solid lines). It is worth mentioning that the Malin 2’s centre (the open circle) has an unreliable position due to the nuclear activity effects and because we neglect the bulge’s gravitational potential. The dashed line corresponding to the Milky Way galaxy shows a sharp decrease of at low pressure values associated with the gas self-gravity and the the dark halo influence666In the models by Krumholz et al. (2009) there is a similar downturn of the molecular fraction for the total gas density less than 10 Mpc2.. The calculations of pressure for normal spiral galaxies in (THINGS sample by Leroy et al., 2008) and for the Milky Way were presented in Kasparova (2012) and Kasparova & Zasov (2008), correspondingly. The molecular gas fraction in Malin 2 is higher by a factor of ten than that from the fitting of the simplified pressure estimates from Blitz & Rosolowsky (2006) for normal galaxies marked by the dotted line. The contrast is even more prominent in comparison to the MW periphery. If the values of correspond to the real properties of the interstellar medium of Malin 2, what is the scenario to get such a high fraction of molecules? Fig. 9 indicates that the observed H2 density is too high or/and the Hi density is too low in Malin 2.
This might happen if the atomic hydrogen was removed from the disc via ram pressure stripping and/or gravitational harassment, for example, that takes place in galaxy clusters and groups. In this case, the H2 gas does not dissociate over the times comparable with the Hi depletion time. However, it seems questionable that a significant portion of Hi left the disc of such a massive galaxy as Malin 2 (see below).
Otherwise we can assume that the molecular gas was formed at the earlier stages of the evolution of Malin 2 and for some reason H2 neither turned into Hi nor was transformed into stars. With regard to the transition of molecular gas into stars, the depletion time for Malin 2 is nearly the same as for normal galaxies (see Sect. 6.2).
It is important to emphasize that in both cases the lifetime of molecular clouds is high and it is longer than the time of the Hi stripping or depletion that was argued earlier by Kasparova & Zasov (2012). This is true despite the fact that, presumably, H2 must be efficiently destroyed at the low gas densities Mpc2 and solar metallicity (Krumholz et al., 2009). Thus, we need to find an additional factor of stabilization of molecular clouds or/and the reasons which could lead to errors in the estimates of values of and (see Sect. 6.1).
6 Discussion
6.1 Why can the apparent gas imbalance occur?
In this section we consider what particular properties of Malin 2 can lead to apparent disruption of gas balance manifested in the high values for given turbulent ISM pressure (see Sect. 5). Notably this may be because of an underestimation of or incorrect estimate of the conversion factor transforming the intensity of the CO line to the molecular density along the line of sight. The reason for the high can be either one or the combination of the factors described below. In addition, we discuss a possibility of the dark gas in the galaxy disc.
6.1.1 Underestimation of the pressure?
To estimate the gas turbulent pressure we use the model of a marginally gravitationally stable disc giving the upper limit for stellar volume densities (and hence maximum gas volume densities) in the galaxy midplane. The galactic disc will be stable only if the stellar velocity dispersion exceeds the adopted value of . It means the pressure can only be overestimated in our model (if for some reason the disc is overheated). Therefore the position of Malin 2 on the diagram (Fig. 9) cannot be explained in terms of the violation of the marginal gravitational stability.
Suppose that our estimates of the stellar surface density based on the photometry are wrong due to a non-standard stellar IMF (see also Section 6.2). However, increasing does not change significantly because in our approach the resulting stellar volume density, to the first approximation, depends only on the local epicyclic frequency but not on the stellar surface density (see the Appendix in Abramova & Zasov, 2011).
The effect of additional pressure is known due to the environmental impact such as from the intergalactic medium or tidal interaction with companions. For example, Virgo cluster galaxies have high H2 fraction at disc peripheries being similar to what we observe in Malin 2, because they are influenced by ram and static pressure from the intergalactic medium (Kasparova, 2012). Although our spectroscopy revealed one companion projected on the main disc, and possibly interacting with the massive main galaxy, its mass is a fraction of a per cent of that of Malin 2, so we do not expect intense interaction with it.
6.1.2 Errors in the molecular gas density estimate?
Analyzing the molecular hydrogen content we should keep in mind that H2 was not observed directly in Malin 2, instead, we rely on line observations. The molecular gas has complex structure. First, it can form giant molecular clouds (GMC) as well as diffuse medium. GMCs are chemically inhomogeneous and tracers are shielded and destroyed by the UV radiation generally in a different way than H2 molecules. There are two obvious reasons for the possible deviation from the standard conversion factor.
One reason could be a non-solar metallicity. In most galaxies the relationship between the metallicity and the conversion factor proposed by Boselli et al. (2002) is most likely valid. Hence, extremely high metallicity is needed in order to explain the values of by a factor of ten higher than expected for normal galaxies. However, our measurements of metallicity in the Hii regions of Malin 2 disc show ordinary values, half-solar to solar (Tab. 1 and Sect. 2.3).
The disc in Malin 2 has low density M⊙pc-2 and molecular scaleheight pc whereas for the solar neighbourhood these values are 2.3 M⊙pc-2 and 100 pc, respectively (e.g. Kasparova & Zasov, 2008). For the Galaxy even at its disc periphery ( kpc and M⊙pc-2) the scaleheight of H2 does not exceed 250 pc. In that case, we can hardly expect that conditions in the molecular gas are identical to those in the Milky Way, including solar neighbourhood. It is not unusual to assume on average thinner H2 disc for Malin 2 or, for example, that the predominant form is not GMC, but a combination of smaller clouds and diffuse H2. The CO-to-H2 conversion factor should be different in this case. In this context, we have to keep in mind that the stellar initial mass function may depend on the mass spectrum and the density profile in the molecular clouds or, more exactly, in the dense cores of the clouds (Williams & McKee, 1997; Girichidis et al., 2011, and see Section 6.2).
6.1.3 The dark gas?
Another opportunity to explain high values is the additional fraction of gas invisible in the CO (2.6 mm and others) and neutral hydrogen (21 cm) lines. The idea of the presence of some dark gas fraction in galaxy discs emerged long ago (see e. g. Pfenniger et al., 1994; Revaz et al., 2009) and now it is confirmed for our Galaxy by the observed excess in -rays from cosmic-ray interactions with the gas (Grenier et al., 2005) and also far-infrared excess from the dust (Planck Collaboration et al., 2011). The dark gas is detected at intermediate hydrogen column densities and it is likely a key link in the evolution between the diffuse atomic media and molecular clouds. There is no consensus about what the dark gas is. H2 or Hi. On one hand, in the outer layer of a molecular cloud, the CO molecules are destroyed by UV photodissociation more efficiently than H2, which is self-shielded and also protected by dust (Wolfire et al., 2010). On the other hand, we can expect that up to a half of the dark gas is atomic because of variations in the Hi optical thickness (Planck Collaboration et al., 2011; Fukui et al., 2012). The atomic clouds become opaque at K (Peters et al., 2013), but the estimate of the Hi mass from the 21 cm line is based on the assumption of small optical depth . In the solar neighbourhood after accounting for the dark gas, the estimate of Hi increases by one-third and the molecular gas content becomes at least twice as high (Grenier et al., 2005; Paradis et al., 2012; Planck Collaboration et al., 2011). Besides, the relative contribution of the dark gas drops from small to massive clouds and gets lower with the opacity increase. There is a reason to suspect that the dark gas fraction is higher at low density disc periphery in normal galaxies than in the solar neighbourghood.
As we have already mentioned above, the structure of the gas medium in Malin 2 must be more rarefied than that in normal galaxies. It would be more appropriate to compare this galaxy with the Large Magellanic Cloud, where the excess of dust radiation is detected too (Galliano et al., 2011; Bernard et al., 2008). Moreover, in the LMC the dark gas could be twice of that observed at 21 cm.
Because of the uncertainty in the relative contribution of Hi and H2, we can not say by how much the presence of additional dark gas will change the . Nevertheless, we may consider some possibilities. If dark gas of Malin 2 consists mainly of molecular hydrogen, it would lead to the offset of points along the dotted line in Fig. 9. In this case, the reason of apparent gas imbalance is not in its dark component. However, the pressure reaches the expected value (towards the dotted line) if we only double the total amount of gas adding the dark gas more than a half of which is in the atomic form (i. e. decreases). In any case, the spatial distribution of the dark gas (regardless of its chemical composition) has to follow that of molecular clouds, but is not expected to correlate with the atomic gas. We note that the additional gas will not affect our dynamical modelling due to the small relative contribution compared to the stellar disc component. Moreover, the presence of the dark gas provides additional support for the observable H2 shielding it from UV radiation which helps to explain why H2 molecules do not dissociate.
Although the observed total gas surface density is below the gravitational stability threshold (e. g. Martin & Kennicutt, 2001; Kennicutt, 1989) in Malin 2 (see Fig. 10 in Pickering et al., 1997), the total gas density would reach the threshold value taking into account the dark gas and therefore can explain the ongoing star formation in the present-day disc of Malin 2 (see Sec. 6.2).
Resuming, the most likely reason for the apparent disruption of the gas balance is a particular structure of the interstellar medium of Malin 2. It can be manifested in a greater proportion of the unobserved dark gas than in normal galaxy discs (e.g. because of the lower temperatures of the interstellar medium of Malin 2). Far-infrared observations of the dust and some other tracers of molecular hydrogen beyond CO are needed for investigating this possibility.
6.2 Star formation and IMF
Malin 2 possesses an extended UV disc with well-seen spiral structure (Boissier et al., 2008). Wyder et al. (2009) estimated the total star formation rates (SFR) by FUV777Wyder et al. (2009) assumed a zero contribution of H2 to the total mass of gas for LSB galaxies and neglected the UV absorption by dust which presents in a small amount even in giant LSB galaxies (such as Malin 1 and UGC 6614) according to the Spitzer Space Telescope IR data (Hinz et al., 2007). Thus, it is likely that they do not significantly underestimate the SFR. (average over time yr) as
where is the SFR surface density in M⊙yr-1kpc-2 and is the UV surface brightness in mag arcsec-2. The authors obtained SFR values several times as low as those predicted by the Kennicutt-Schmidt law for Malin 2 and other LSB galaxies. In the galaxy centre the local SFR values are slightly higher due to the additional UV flux probably coming from the AGN.
There are two ways to assess the star formation efficiency (SFE). In the first case, is low for Malin 2, and is consistent with values for other LSB discs and outer regions of normal galaxies (Abramova & Zasov, 2012). The low values of for LSB galaxies are often associated with the impossibility of forming molecules at low total gas surface density M⊙/pc2 (Krumholz et al., 2009). Evidently, for Malin 2 this explanation is not true because the H2 fraction in the disc is high (see Sect. 5).
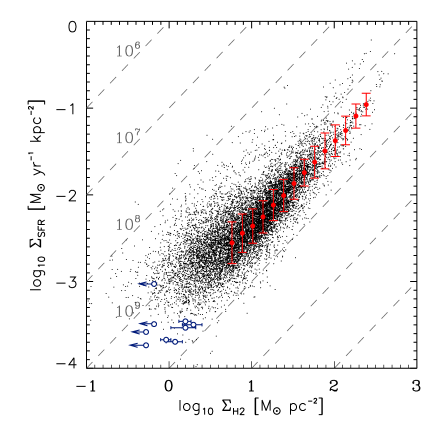
We can consider also SFE estimated as . The average values of for the nine areas with known H2 densities in Malin 2 (see Fig. 8) is yr-1 that agrees well with the value for normal galaxies, yr-1. For the sake of clarity, we present a plot from Bigiel et al. (2011) on which open circles mark Malin 2 (Fig. 10). The latter means that the molecular gas depletion time is nearly the same everywhere even at the extremely low observed gas density. In other words, the CO intensity closely correlates with the number of clumps which give birth to massive stars. But the amount of the gas that is not observed by tracers can probably be different from that in normal galaxies.
Now we will discuss the IMF and the possible star formation history (SFH) which may be the key to the understanding of the evolution of such an unusual object as Malin 2. Although perhaps there is no close connection of the ongoing SFR with the general star formation history888For instance, colour gradients do not correlate with the distribution of Hα (O’Neil et al. 2007, Burkholder et al. 2001), we will try to choose the most probable scenario.
There are several reasons to believe that IMF is unusual for LSB galaxies. First, high disc mass-to-light ratio M/L found from the dynamical disc mass estimates (see e.g. Fuchs, 2003; Saburova, 2011) can be partly explained by the large contribution of low-mass stars. Another reason is that LSB galaxies have smaller numbers of supernovae (Weidner & Kroupa, 2005) and a high proportion of diffuse Hii radiation estimated from Hα imaging (O’Neil et al., 2007). But one should keep in mind that the class of LSB galaxies is not very uniform and consider whether there is a reason to believe that the star formation history and the IMF of Malin 2 are so unusual too.
Indeed, the role of older stars in Malin 2 is more significant than in other LSB galaxies because their colour indices 999The colour gives information about the ratio of SFR and total stellar mass and therefore the weighted average age of stars in a galaxy. are about and correspondingly by Wyder et al. (2009). Lee et al. (2004) have tried to explain the presumably high M/L ratio in the discs of several LSB galaxies by the single burst model of the stellar population taking into account their colour indices. The single burst models with high fraction of low-mass stars reproduces the observed colours in the metal-poor LSB galaxies. However, this model is not suitable for Malin 2 (which has nearly solar metallicity) with the disc mass-to-light ratio estimates either 10.3 M⊙/L⊙ by Fuchs (2002) compared to 1.7 M⊙/L⊙ by us.
Another reason to question the presence of a non standard bottom-heavy IMF in Malin 2 is that the photometric model of the rotation curve that we obtain is close to the maximum disc model with the highest possible contribution of the disc to the rotation curve. Thus we cannot increase the density of the disc for it to have the mass-to-light ratio which is significantly higher than that expected from the photometry and models with the standard IMF.
The colour is sensitive to the stars with a wider range of ages than the , so the colour index shows very recent star formation history. Boissier et al. (2008) modeled the colour indices for a sample of LSB galaxies. For Malin 2 as well as for the most LSB galaxies, the model of constant SFR with the normal IMF is not suitable101010A similar conclusion was made for some other giant LSB galaxies by O’Neil et al. (2007).. However, the observed red colour (total as well as for only disc area mag) can be explained by the model of the constant SFR with the lack of massive stars (IMF truncated at 5 M⊙) or the post-starburst scenario (i.e. fading of star formation after the burst years ago) at any IMF (Figure 6 in Boissier et al. 2008). To be mentioned, that the model with the truncated IMF contradicts to the observed value of for Malin 2.
Our broad-band SED modelling indicates that an exponentially declining SFH (with the Kroupa IMF) is applicable in the case of Malin 2, while instantaneous burst cannot explain the photometric SED, especially its excess. This result supports the previous study of observational spectro-photometric and chemical properties of a sample of LSB disc galaxies by van den Hoek et al. (2000), who concluded that observed properties of LSB galaxies are best explained by models with exponentially declining SFH.
According to the data we analysed, the values of SFR and SFEgas are lower than those for the normal galaxies. The stellar IMF is likely to be a standard Kroupa because the dynamic constraints do not allow us to add a substantial amount of low-massive stars and the efficiency of the massive star formation for a given value of (the dense regions observed by CO) is normal. The single burst scenario (SSP models) can not explain observed colour indices in Malin 2. In our view, most likely, this galaxy has an exponentially declining SFH.
6.3 Evolutionary models
Malin 2 challenges standard evolutionary models of disc galaxies in which one can hardly form such a huge mass M⊙ without recent major merger events. The dynamic and structural properties of galaxies are believed to be related closely to their host dark halos whose properties cannot change significantly by minor mergers. Malin 2 must have had acquired some of its specific properties at the early epoch yet before the disc subsystem was formed. Therefore we have to understand whether there is a need for an exotic evolutionary scenario (as fine-tuned interaction with companions at later evolutionary stages) to explain the low brightness and the large scalelength of the Malin 2 disc or their cause is in the initial cosmological conditions too.
Unlike most LSB galaxies, giant LSBs seem to require interaction event[s] with massive companions. Two formation scenarios for giant LSB galaxies were proposed in the recent years. Mapelli et al. (2008) suggested that the unusual structure of giant LSBs was formed by a bygone head-on collision with a massive intruder (the masses ratio should be ). They considered ring galaxies as the progenitors of the giant galaxies having the low-density disc with the large scalelength. Reshetnikov et al. (2010) discussed a possible formation scenario of another LSB giant Malin 1 (many of its properties are similar to those of Malin 2) and concluded that the available observational data did not contradict to the scenario proposed by Mapelli et al. (2008). We should mention that although there is a rise of the disc scalelength with time in this scenario, the central surface density does not change (Fig. 2 in Mapelli et al., 2008). The latter means that the progenitor of Malin 2 must have been not only the galaxy with initially peculiar giant dark halo but also had low density of stars (i.e. was a large LSB galaxy, too).
We do not observe a candidate intruder around Malin 2 that is sufficiently massive to satisfy the conditions introduced by Mapelli et al. (2008). Malin 2 possesses four well-seen companions (SDSS J103947.19+204506.2, SDSS J104011.80+205451.6, SDSS J103951.56+205100.1, and S1). The most massive of them has times lower luminosity than Malin 2. For that companion the velocity difference with respect to Malin 2 is about 30 km s-1 and the projected distance between the galaxies is 342 kpc.
We stress that the major merger scenario should be extremely rare for a disc galaxy since similar interactions in most cases overheat or destroy the disc subsystem. The unequal mass merger simulations (mass ratios 1:2 and 1:10) included in the GALMER database (Chilingarian et al., 2010) suggest that even at the mass ratio 1:10 in the case of prograde encounters, that is when the co-aligned angular momentum of the gas-rich statellite galaxy with that of the host galaxy (only in this case the formation of a co-planar co-rotating star-forming ring occurrs), the stellar disc becomes significantly overheated and the merger remnant at the end resembles a lenticular galaxy with an outer large star forming ring (see discussion in Sil’chenko et al., 2011). However, the low velocity dispersion in Malin 2 suggests the stellar disc is relatively thin. On the other hand, minor mergers on retrograde non-coplanar orbits although do not heat significantly the host galaxy disc but result in the accretion of the most part of the infalling satellite’s ISM onto polar orbits (see e.g. Chilingarian et al., 2009) in the very central region of the host galaxy and therefore cannot explain the formation of an extended gaseous disc. So taking into account the aforesaid, the lack of a good candidate for a collision and, in addition, the inability to form clear spirals we conclude that the model by Mapelli et al. (2008) is not suitable for Malin 2.
The second scenario is that the extended low-density disc of Malin 2 could have been partially formed by tidally disrupted dwarf galaxies (Peñarrubia et al., 2006). In those simulations, if the low-mass satellite falls at a quasi-circular orbit, one should expect the decrease of the rotation amplitude in the periphery of the galaxy by km s-1. In this case, the relaxation time of the external disc will be more than 14 Gyr. This is in contrast to the case of a massive companion on a highly eccentric orbit when the stellar debris disrupts within 2 Gyr but the resulting rotational velocity must decrease by 100 km s-1. In Malin 2, the uncertainties of the rotation curve do not contradict to the velocity decreasing by less than 30 km s-1 (Pickering et al., 1997) but we do not observe significant distortions in the disc that could reveal a destroyed companion. The colour map of Malin 2 shows only blue spiral arms and red bulge with no traces of recently accreted satellites. Another reason not to give large credibility to this scenario is that the satellites should have almost the same angular momentum to form the disc instead of a spherical system. Moreover, it is believed that the inner disc is not strongly affected by such accretion events (O’Neil et al., 1998; Peñarrubia et al., 2006) thus the progenitor of Malin 2 should be already LSB in this scenario too.
Our measurements of the mass and metallicity in small satellite of Malin 2 projected onto the main galaxy show that small accretion events still going on, and that the events may have been more frequent on the past. Small mass, a few percent of that of Malin 2 at most, and similar metallicity of the satellite supports the second mild merging scenario of the galaxy formation. Therefore, now we have the grounds to assume a less “catastrophic” evolutionary scenario for Malin 2.
Like the other LSB galaxies, Malin 2 is in a good agreement with the assumption of the constant surface density of the dark matter (Kormendy & Freeman, 2004). Thus the dark halo of Malin 2 is rarefied and the potential well is shallower than that in normal galaxies. There are numerous cosmological simulations devoted to the LSB galaxies because their dark haloes are believed to dominate the total mass providing the possibilities to almost directly detect the dark mass. In the modern scenarios it turns out that LSB galaxies reside in the host haloes with relatively low concentrations and possessing fast rotation111111It should be understood that the cosmological models normally use the NFW profile but in the observation analysis the pseudo-isothermal sphere is used. in which the low density discs are formed due to the centrifugal equilibrium (Mo et al., 1998; Bullock et al., 2001; Kim & Lee, 2013). Moreover, there are reasons to expect the correlation between the halo concentration, spin parameter and the environment (Macciò et al., 2007). And in fact, LSB galaxies tend to be located at the edges of the Large Scale Structure filaments and some LSB galaxies are even found in void regions (Rosenbaum & Bomans, 2004). It is likely that such galaxies were formed in the regions lacking the intergalactic medium. The matter distribution and concentration in a galaxy depend on the rate of accretion of the intergalactic gas. In addition, the later formed a halo, the lower its central density due to the individual halo assembly history (Wechsler et al., 2002). Although, we notice that all these relationships are tighter for dwarf LSBs galaxies rather than for the giants because of the much worse number statistics. In general, we think that comparing our results with the cosmological models is premature because the halo properties in simulations are quite sensitive to relatively small changes in the cosmological parameters (Macciò et al., 2007; van den Bosch et al., 2003). However, the lack of obvious contradictions with present models allows us to consider that the main cause of the Malin 2 features are the cosmological initial conditions. Namely, together the peculiarities of the dark halo and probably the poor gas environment (at the time when the disc subsystem was formed) imply difficulties with the formation of high surface density disc and with the accretion of gas to Malin 2. Perhaps, this may affect the temperature of the gas disc and elevate the dark gas fraction.
Finally, we conclude that there is no need to propose any exotic catastrophic scenario because the halo parameters of Malin 2 were initially unusual and they could not be changed significantly by minor merger events.
7 Summary
In this work we attempt to construct a consistent evolutionary picture of the giant LSB galaxy Malin 2 based on new observations and on available literature data.
-
1.
We performed the surface photometry of Malin 2 in the BVR and griz bands using imaging from the 0.5-m Apache Point Observatory telescope, archival data from SDSS, and from GMOS-N (Gemini). The photometric data were used to constrain our mass distribution model. The dynamical model of Malin 2 implies a massive and rarefied dark halo (the central density M⊙/pc3 and the core radius kpc of isothermal sphere), which dominates by mass within four disc radial scalelengths, but whose dynamical signature is small in the inner regions (Tab. 6).
-
2.
The line-of-sight velocity profile inferred from the Gemini GMOS-N long slit spectra along the minor axis shows the decoupled kinematics of stars and gas in the very inner region ( kpc). Such a feature in the stellar kinematics in the central bulge dominated part of the galaxy can be related to the bulge triaxiality. The latter assumption is confirmed by moderate variation of the position angle of internal isophotes with radius.
-
3.
From our long-slit spectroscopic observations performed at the 3.5m ARC telescope we confirm a small satellite that is projected onto the main disk of Malin 2. The mass of the satellite is small, 1/500 of that of the main galaxy, and its radial velocity is very close to that of Malin 2. The oxygen abundances estimated in several Hii regions at intermediate distances to the galactic centre (20-30 kpc) suggest the metallicity of dex, which is in a good agreement with spectroscopic estimations from GMOS-N for the central region of the galaxy, slightly subsolar values for both gas and stars.
-
4.
The observed ratio of molecular to atomic hydrogen surface density, , is significantly higher than that expected in normal galaxies given a low value of the turbulent gas pressure, K cm-3, and the total gas density in the galaxy.
Most likely the reason for the apparent gas balance violation is a specific structure of the interstellar medium in the Malin 2 disc. It can be an excess of low-mass molecular clouds and a higher fraction of unobserved dark gas with respective to normal galaxies. Once we assume the excess of the dark gas, the total gas surface density increases and reaches its critical value for the gravitation instability. This allows us to explain the observed ongoing star formation in the disc of Malin 2.
-
5.
The SFE per total gas mass is really low but not due to the lack of conditions for the formation of molecules. The stellar IMF is unlikely to be bottom heavy because our dynamic modelling does not allow to add substantial amount of low-mass stars, and the rates of the massive star formation for values of observed by CO are normal.
-
6.
We conclude that a single star formation burst scenario cannot explain the observed disc colour indices in Malin 2. In our opinion, the simplest model well describing Malin 2 is an exponentially declining star formation history.
-
7.
There is no need to assume a catastrophic scenario of the Malin 2 formation. We conclude that Malin 2’s features are different from those of non-giant LSB galaxies primarily due to the dark halo scale. Peculiar properties of this galaxy can be explained by the shallow potential well of the host dark halo and by poor gas environment when the disc was formed. These factors should impose restrictions on the rate and efficiency of the accretion of intergalactic gas and they should affect the luminous matter distribution which can lead to the formation of the low surface density disc with the high scalelength.
Acknowledgments
We are grateful to Anatoly Zasov, Olga Sil’chenko and Oxana Abramova for fruitful discussion. We wish to thank Timothy Pickering who kindly provided the processed Hi data cube of Malin2. We thank Stacy McGaugh for providing us the Malin 2 image with overplotted positions of the metallicity measurements. This work was supported by the Ministry of Education and Science of the Russian Federation and Russian Foundation for Basic Research (projects 12-02-00685 and 12-02-31452) and the Russian President’s grant No. MD-3288.2012.2. IK and AS acknowledge support by the Dmitry Zimin’s non-profit Dynasty Foundation. We also thank our anonymous referee for the comments on this paper.
Based on observations obtained with the Apache Point Observatory 0.5 and 3.5-meter telescopes, which are owned and operated by the Astrophysical Research Consortium. We made use of the NASA/IPAC Extragalactic Database (NED) which is operated by the Jet Propulsion Laboratory, California Institute of Technology, under contract with the National Aeronautics and Space Administration. We acknowledge the use of the HyperLeda database.
SDSS-III is managed by the Astrophysical Research Consortium for the Participating Institutions of the SDSS-III Collaboration including the University of Arizona, the Brazilian Participation Group, Brookhaven National Laboratory, University of Cambridge, Carnegie Mellon University, University of Florida, the French Participation Group, the German Participation Group, Harvard University, the Instituto de Astrofisica de Canarias, the Michigan State/Notre Dame/JINA Participation Group, Johns Hopkins University, Lawrence Berkeley National Laboratory, Max Planck Institute for Astrophysics, Max Planck Institute for Extraterrestrial Physics, New Mexico State University, New York University, Ohio State University, Pennsylvania State University, University of Portsmouth, Princeton University, the Spanish Participation Group, University of Tokyo, University of Utah, Vanderbilt University, University of Virginia, University of Washington, and Yale University.
Based on observations obtained at the Gemini Observatory (acquired through the Gemini Science Archive), which is operated by the Association of Universities for Research in Astronomy, Inc., under a cooperative agreement with the NSF on behalf of the Gemini partnership: the National Science Foundation (United States), the National Research Council (Canada), CONICYT (Chile), the Australian Research Council (Australia), Ministerio da Ciencia, Tecnologia e Inovacao (Brazil) and Ministerio de Ciencia, Tecnologia e Innovacion Productiva (Argentina).
References
- Abazajian et al. (2009) Abazajian, K. N., et al. 2009, ApJS, 182, 543
- Abramova & Zasov (2011) Abramova, O. V. & Zasov, A. V. 2011, Astronomy Reports, 55, 202
- Abramova & Zasov (2012) Abramova, O. V. & Zasov, A. V. 2012, Astronomy Letters, 38, 755
- Alloin et al. (1979) Alloin, D., Collin-Souffrin, S., Joly, M., & Vigroux, L. 1979, A&A, 78, 200
- Baldwin et al. (1981) Baldwin, J. A., Phillips, M. M., & Terlevich, R. 1981, PASP, 93, 5
- Bell & de Jong (2001) Bell, E. F. & de Jong, R. S. 2001, ApJ, 550, 212
- Bergvall et al. (1999) Bergvall, N., Rönnback, J., Masegosa, J., & Östlin, G. 1999, A&A, 341, 697
- Bernard et al. (2008) Bernard, J.-P., et al. 2008, AJ, 136, 919
- Bigiel et al. (2011) Bigiel, F., et al. 2011, ApJ, 730, L13
- Bizyaev & Mitronova (2002) Bizyaev, D. & Mitronova, S. 2002, A&A, 389, 795
- Bizyaev & Mitronova (2009) Bizyaev, D. & Mitronova, S. 2009, ApJ, 702, 1567
- Blitz & Rosolowsky (2006) Blitz, L. & Rosolowsky, E. 2006, ApJ, 650, 933
- Boissier et al. (2008) Boissier, S., et al. 2008, ApJ, 681, 244
- Boselli et al. (2002) Boselli, A., Lequeux, J., & Gavazzi, G. 2002, A&A, 384, 33
- Bothun et al. (1997) Bothun, G., Impey, C., & McGaugh, S. 1997, PASP, 109, 745
- Bothun et al. (1990) Bothun, G. D., Schombert, J. M., Impey, C. D., & Schneider, S. E. 1990, ApJ, 360, 427
- Bullock et al. (2001) Bullock, J. S., Kolatt, T. S., Sigad, Y., Somerville, R. S., Kravtsov, A. V., Klypin, A. A., Primack, J. R., & Dekel, A. 2001, MNRAS, 321, 559
- Burkholder et al. (2001) Burkholder, V., Impey, C., & Sprayberry, D. 2001, AJ, 122, 2318
- Chilingarian et al. (2007a) Chilingarian, I., Prugniel, P., Sil’Chenko, O., & Koleva, M. 2007a, in IAU Symposium, Vol. 241, IAU Symposium, ed. A. Vazdekis & R. Peletier, 175–176
- Chilingarian et al. (2010) Chilingarian, I. V., Di Matteo, P., Combes, F., Melchior, A.-L., & Semelin, B. 2010, A&A, 518, A61
- Chilingarian & Katkov (2012) Chilingarian, I. V. & Katkov, I. Y. 2012, in IAU Symposium, Vol. 284, IAU Symposium, ed. R. J. Tuffs & C. C. Popescu, 26–28
- Chilingarian et al. (2009) Chilingarian, I. V., Novikova, A. P., Cayatte, V., Combes, F., Di Matteo, P., & Zasov, A. V. 2009, A&A, 504, 389
- Chilingarian et al. (2007b) Chilingarian, I. V., Prugniel, P., Sil’Chenko, O. K., & Afanasiev, V. L. 2007b, MNRAS, 376, 1033
- Chilingarian & Zolotukhin (2012) Chilingarian, I. V. & Zolotukhin, I. Y. 2012, MNRAS, 419, 1727
- Das et al. (2010) Das, M., Boone, F., & Viallefond, F. 2010, A&A, 523, A63
- Das et al. (2006) Das, M., O’Neil, K., Vogel, S. N., & McGaugh, S. 2006, ApJ, 651, 853
- de Blok et al. (2008) de Blok, W. J. G., Walter, F., Brinks, E., Trachternach, C., Oh, S.-H., & Kennicutt, Jr., R. C. 2008, AJ, 136, 2648
- de Souza et al. (2004) de Souza, R. E., Gadotti, D. A., & dos Anjos, S. 2004, ApJS, 153, 411
- Edmunds (1990) Edmunds, M. G. 1990, MNRAS, 246, 678
- Fioc & Rocca-Volmerange (1997) Fioc, M. & Rocca-Volmerange, B. 1997, A&A, 326, 950
- Francis et al. (2012) Francis, K. J., Drinkwater, M. J., Chilingarian, I. V., Bolt, A. M., & Firth, P. 2012, MNRAS, 425, 325
- Fuchs (2002) Fuchs, B. 2002, in Dark Matter in Astro- and Particle Physics, DARK 2002, ed. H. V. Klapdor-Kleingrothaus & R. D. Viollier, 28–35
- Fuchs (2003) Fuchs, B. 2003, Ap&SS, 284, 719
- Fukui et al. (2012) Fukui, Y., et al. 2012, ApJ, 746, 82
- Fumagalli et al. (2010) Fumagalli, M., Krumholz, M. R., & Hunt, L. K. 2010, ApJ, 722, 919
- Galaz et al. (2006) Galaz, G., Villalobos, A., Infante, L., & Donzelli, C. 2006, AJ, 131, 2035
- Galliano et al. (2011) Galliano, F., et al. 2011, A&A, 536, A88
- Girichidis et al. (2011) Girichidis, P., Federrath, C., Banerjee, R., & Klessen, R. S. 2011, MNRAS, 413, 2741
- Grenier et al. (2005) Grenier, I. A., Casandjian, J.-M., & Terrier, R. 2005, Science, 307, 1292
- Hinz et al. (2007) Hinz, J. L., Rieke, M. J., Rieke, G. H., Willmer, C. N. A., Misselt, K., Engelbracht, C. W., Blaylock, M., & Pickering, T. E. 2007, ApJ, 663, 895
- Kasparova & Zasov (2012) Kasparova, A. & Zasov, A. 2012, ArXiv e-prints
- Kasparova (2012) Kasparova, A. V. 2012, Astronomy Letters, 38, 63
- Kasparova & Zasov (2008) Kasparova, A. V. & Zasov, A. V. 2008, Astronomy Letters, 34, 152
- Kelson (2003) Kelson, D. D. 2003, PASP, 115, 688
- Kennicutt (1989) Kennicutt, Jr., R. C. 1989, ApJ, 344, 685
- Kewley et al. (2006) Kewley, L. J., Groves, B., Kauffmann, G., & Heckman, T. 2006, MNRAS, 372, 961
- Khoperskov et al. (2010) Khoperskov, A., Bizyaev, D., Tiurina, N., & Butenko, M. 2010, Astronomische Nachrichten, 331, 731
- Kim & Lee (2013) Kim, J.-h. & Lee, J. 2013, MNRAS, 432, 1701
- Kormendy & Freeman (2004) Kormendy, J. & Freeman, K. C. 2004, in IAU Symposium, Vol. 220, Dark Matter in Galaxies, ed. S. Ryder, D. Pisano, M. Walker, & K. Freeman, 377
- Kroupa (2001) Kroupa, P. 2001, MNRAS, 322, 231
- Krumholz et al. (2009) Krumholz, M. R., McKee, C. F., & Tumlinson, J. 2009, ApJ, 693, 216
- Kuzio de Naray et al. (2004) Kuzio de Naray, R., McGaugh, S. S., & de Blok, W. J. G. 2004, MNRAS, 355, 887
- Kuzio de Naray et al. (2008) Kuzio de Naray, R., McGaugh, S. S., & de Blok, W. J. G. 2008, ApJ, 676, 920
- Kuzio de Naray et al. (2006) Kuzio de Naray, R., McGaugh, S. S., de Blok, W. J. G., & Bosma, A. 2006, ApJS, 165, 461
- Landolt (1992) Landolt, A. U. 1992, AJ, 104, 340
- Landolt (2009) Landolt, A. U. 2009, AJ, 137, 4186
- Le Borgne et al. (2004) Le Borgne, D., Rocca-Volmerange, B., Prugniel, P., Lançon, A., Fioc, M., & Soubiran, C. 2004, A&A, 425, 881
- Lee et al. (2004) Lee, H.-c., Gibson, B. K., Flynn, C., Kawata, D., & Beasley, M. A. 2004, MNRAS, 353, 113
- Lejeune et al. (1997) Lejeune, T., Cuisinier, F., & Buser, R. 1997, A&AS, 125, 229
- Lelli et al. (2010) Lelli, F., Fraternali, F., & Sancisi, R. 2010, A&A, 516, A11
- Leroy et al. (2008) Leroy, A. K., Walter, F., Brinks, E., Bigiel, F., de Blok, W. J. G., Madore, B., & Thornley, M. D. 2008, AJ, 136, 2782
- Macciò et al. (2007) Macciò, A. V., Dutton, A. A., van den Bosch, F. C., Moore, B., Potter, D., & Stadel, J. 2007, MNRAS, 378, 55
- Mapelli et al. (2008) Mapelli, M., Moore, B., Ripamonti, E., Mayer, L., Colpi, M., & Giordano, L. 2008, MNRAS, 383, 1223
- Marino et al. (2013) Marino, R. A., et al. 2013, ArXiv e-prints
- Martin & Kennicutt (2001) Martin, C. L. & Kennicutt, Jr., R. C. 2001, ApJ, 555, 301
- Matthews (2000) Matthews, L. D. 2000, AJ, 120, 1764
- McGaugh (1994) McGaugh, S. S. 1994, ApJ, 426, 135
- McGaugh (2005) McGaugh, S. S. 2005, ApJ, 632, 859
- Mera et al. (1998) Mera, D., Chabrier, G., & Schaeffer, R. 1998, A&A, 330, 953
- Mo et al. (1998) Mo, H. J., Mao, S., & White, S. D. M. 1998, MNRAS, 295, 319
- Narayan & Jog (2002) Narayan, C. A. & Jog, C. J. 2002, A&A, 394, 89
- Navarro et al. (1996) Navarro, J. F., Frenk, C. S., & White, S. D. M. 1996, ApJ, 462, 563
- O’Neil (2000) O’Neil, K. 2000, in Astronomical Society of the Pacific Conference Series, Vol. 215, Cosmic Evolution and Galaxy Formation: Structure, Interactions, and Feedback, ed. J. Franco, L. Terlevich, O. López-Cruz, & I. Aretxaga, 178
- O’Neil & Bothun (2000) O’Neil, K. & Bothun, G. 2000, ApJ, 529, 811
- O’Neil et al. (1998) O’Neil, K., Bothun, G. D., & Schombert, J. 1998, AJ, 116, 2776
- O’Neil et al. (2007) O’Neil, K., Oey, M. S., & Bothun, G. 2007, AJ, 134, 547
- O’Neil et al. (2003) O’Neil, K., Schinnerer, E., & Hofner, P. 2003, ApJ, 588, 230
- Pagel et al. (1979) Pagel, B. E. J., Edmunds, M. G., Blackwell, D. E., Chun, M. S., & Smith, G. 1979, MNRAS, 189, 95
- Paradis et al. (2012) Paradis, D., Dobashi, K., Shimoikura, T., Kawamura, A., Onishi, T., Fukui, Y., & Bernard, J.-P. 2012, A&A, 543, A103
- Peñarrubia et al. (2006) Peñarrubia, J., McConnachie, A., & Babul, A. 2006, ApJ, 650, L33
- Peters et al. (2013) Peters, S. P. C., van der Kruit, P. C., Allen, R. J., & Freeman, K. C. 2013, ArXiv e-prints
- Pettini & Pagel (2004) Pettini, M. & Pagel, B. E. J. 2004, MNRAS, 348, L59
- Pfenniger et al. (1994) Pfenniger, D., Combes, F., & Martinet, L. 1994, A&A, 285, 79
- Pickering et al. (1997) Pickering, T. E., Impey, C. D., van Gorkom, J. H., & Bothun, G. D. 1997, AJ, 114, 1858
- Pilyugin & Thuan (2005) Pilyugin, L. S. & Thuan, T. X. 2005, ApJ, 631, 231
- Pilyugin et al. (2007) Pilyugin, L. S., Thuan, T. X., & Vílchez, J. M. 2007, MNRAS, 376, 353
- Planck Collaboration et al. (2011) Planck Collaboration, et al. 2011, A&A, 536, A19
- Portinari et al. (2004) Portinari, L., Sommer-Larsen, J., & Tantalo, R. 2004, MNRAS, 347, 691
- Prugniel et al. (2007) Prugniel, P., Soubiran, C., Koleva, M., & Le Borgne, D. 2007, VizieR Online Data Catalog, 3251, 0
- Ramya et al. (2011) Ramya, S., Prabhu, T. P., & Das, M. 2011, MNRAS, 418, 789
- Reshetnikov et al. (2010) Reshetnikov, V. P., Moiseev, A. V., & Sotnikova, N. Y. 2010, MNRAS, 406, L90
- Revaz et al. (2009) Revaz, Y., Pfenniger, D., Combes, F., & Bournaud, F. 2009, A&A, 501, 171
- Rosenbaum & Bomans (2004) Rosenbaum, S. D. & Bomans, D. J. 2004, A&A, 422, L5
- Saburova (2011) Saburova, A. S. 2011, Astronomy Reports, 55, 409
- Salpeter (1955) Salpeter, E. E. 1955, ApJ, 121, 161
- Schlafly & Finkbeiner (2011) Schlafly, E. F. & Finkbeiner, D. P. 2011, ApJ, 737, 103
- Sil’chenko et al. (2011) Sil’chenko, O. K., Chilingarian, I. V., Sotnikova, N. Y., & Afanasiev, V. L. 2011, MNRAS, 414, 3645
- Storchi-Bergmann et al. (1994) Storchi-Bergmann, T., Calzetti, D., & Kinney, A. L. 1994, ApJ, 429, 572
- Swaters et al. (2003) Swaters, R. A., Madore, B. F., van den Bosch, F. C., & Balcells, M. 2003, ApJ, 583, 732
- Tully & Fisher (1977) Tully, R. B. & Fisher, J. R. 1977, A&A, 54, 661
- van den Bosch et al. (2003) van den Bosch, F. C., Mo, H. J., & Yang, X. 2003, MNRAS, 345, 923
- van den Hoek et al. (2000) van den Hoek, L. B., de Blok, W. J. G., van der Hulst, J. M., & de Jong, T. 2000, A&A, 357, 397
- Wechsler et al. (2002) Wechsler, R. H., Bullock, J. S., Primack, J. R., Kravtsov, A. V., & Dekel, A. 2002, ApJ, 568, 52
- Weidner & Kroupa (2005) Weidner, C. & Kroupa, P. 2005, ApJ, 625, 754
- Williams & McKee (1997) Williams, J. P. & McKee, C. F. 1997, ApJ, 476, 166
- Wilman et al. (2013) Wilman, D. J., Fontanot, F., De Lucia, G., Erwin, P., & Monaco, P. 2013, MNRAS, 433, 2986
- Wolfire et al. (2010) Wolfire, M. G., Hollenbach, D., & McKee, C. F. 2010, ApJ, 716, 1191
- Wyder et al. (2009) Wyder, T. K., et al. 2009, ApJ, 696, 1834
- Zasov et al. (2011) Zasov, A. V., Khoperskov, A. V., & Saburova, A. S. 2011, Astronomy Letters, 37, 374
- Zasov et al. (2004) Zasov, A. V., Khoperskov, A. V., & Tyurina, N. V. 2004, Astronomy Letters, 30, 593
- Zhong et al. (2008) Zhong, G. H., Liang, Y. C., Liu, F. S., Hammer, F., Hu, J. Y., Chen, X. Y., Deng, L. C., & Zhang, B. 2008, MNRAS, 391, 986