11email: [manjavacas;goldman;henning]@mpia.de 22institutetext: Landessternwarte Königstuhl 12, D-69117 Heidelberg, Germany
22email: sreffert@lsw.uni-heidelberg.de
Parallax measurements of cool brown dwarfs††thanks: Based on observations taken with Omega-2000 at the 3.5 m telescope at the Centro Astronómico Hispano Alemán (CAHA) at Calar Alto, operated by the Max Planck Institut für Astronomie and the Instituto de Astrofísica de Andalucía (CSIC).
Abstract
Context. Accurate parallax measurements allow us to determine physical properties of brown dwarfs and help us constrain evolutionary and atmospheric models, break age-mass degeneracy, and reveal unresolved binaries.
Aims. We measured absolute trigonometric parallaxes and proper motions of six cool brown dwarfs using background galaxies to establish an absolute reference frame. We derive the absolute -band magnitude. The six T brown dwarfs in our sample have spectral types between T2.5 and T8 and magnitudes between 13.9 and 18.0 in 2MASS (Two Micron All Sky Survey) with photometric distances below 25 pc.
Methods. The observations were taken in the -band with the Omega-2000 camera on the 3.5 m telescope at Calar Alto during a time period of 27 months between March 2011 and June 2013. The number of epochs varied between 11 and 12 depending on the object. The reduction of the astrometric measurements was carried out with respect to the field stars. The relative parallax and proper motions were transformed into absolute measurements using the background galaxies in our fields.
Results. We obtained absolute parallaxes for our six brown dwarfs with a precision between 3 and 6 mas. We compared our results in a color-magnitude diagram with other brown dwarfs with determined parallax and with the BT-Settl 2012 atmospheric models. For four of the six targets, we found a good agreement in luminosity with objects of similar spectral types. We obtained an improved accuracy in the parallaxes and proper motions in comparison to previous works. The object 2MASS J11061197+2754225 is more than 1 mag overluminous in all bands, which point to binarity or high order multiplicity.
Key Words.:
stars: brown dwarfs – late type – infrared: astrometry – parallaxes – proper motions – stars: distances1 Introduction
Since the discovery of the first brown dwarfs (BDs) (GD165 by Becklin & Zuckerman 1988, PPl 15 by Basri et al. 1995, Teide1 by Rebolo et al. 1995 and Gliese229B by Nakajima et al. 1995), more than 1000 L and T type brown dwarfs have been discovered111www.dwarfarchives.org.
During their evolution BDs cool and dim. During their life, they change their spectral type because the effective temperature () decreases with the exception of BDs in the L/T transition in which the is roughly constant. For a given BD with a given temperature, the interval of masses and ages that the BD could have is very wide, so that the age and the mass are degenerate. The is the physical parameter that drives the major changes in the observable photometric and spectroscopic features of brown dwarfs. However, among the known brown dwarfs emerge outliers, which show that secondary parameters are also responsible for brown dwarf properties, such as gravity, metallicity, and cloud variability (Burrows et al. 2006; Burgasser et al. 2006a; Liu et al. 2007).
Accurate measurements of distances allow us to determine physical properties of these objects, including luminosities or absolute fluxes to check atmospheric models, temperatures, space motions, and space densities.
Since our goal is to derive parallaxes with a high accuracy (5-10%), we constrained our sample to objects with photometric distances up to 25 pc. Our sample of objects is located at spectrophotometric distances of 1025 pc with magnitudes in between 13.9 and 18.0, which are suitable for astrometry.
Since the first parallax programs for brown dwarfs began with Dahn et al. (2002), Vrba et al. (2004), and Tinney et al. (2003), the relationship between the color and magnitude of BDs has been studied (Burgasser et al. 2008; Schilbach et al. 2009; Marocco et al. 2010; Faherty et al. 2012; Dupuy & Liu 2012) among others. One of the most significant results of these studies is the large dispersion in luminosity for objects with similar spectral types (Faherty et al. 2012), which shows the importance of other factors, such as gravity, metallicity, sedimentation, and binarity (Tsuji et al. 1996; Burrows et al. 2006; Saumon & Marley 2008). Increasing the number of cool brown dwarfs with accurate distance measurements allows us to understand the variation in the color magnitude and H-R diagrams, as we can determine the luminosity more accurately. Also, the -band bump in the color-magnitude diagram, a brightening observed in the J band for brown dwarfs with spectral types between T1 and T5, is not well understood (Burgasser et al. 2002b, Tinney et al. 2003 and Vrba et al. 2004). There are still few objects with parallaxes in the L/T transition, which prevent the progress of understanding brown dwarf evolution.
In this paper, we report the absolute parallaxes and the absolute proper motions of six T ultra cool dwarfs with spectral types between T2.5 and T8 and spectrophotometric distances between 1025 pc.
In Section 2, we explain how our selection criteria are used to select our targets and how the observations were carried out. In Section 3, we describe the data reduction: how the astrometry was performed, the estimation of the differential chromatic refraction (DCR), and the calculation of the relative and absolute parallax and proper motions. In Section 4, we compare our results to those of other previous studies, which included our object. Finally, we present our conclusions in Section 6.
2 Observations
Initially, we selected eigth T dwarfs with expected spectrophotometric distances smaller than 25 pc. Spectrophotometric distances of our targets were estimated using the relation given by Goldman et al. (2010). Only objects brighter than 18 mag in the band were selected, so that good signal-to-noise (S/N) observations could be obtained in a reasonable amount of time. Two targets were discarded later from the list, since they were located in fields with bright stars nearby, which compromised the accuracy of the astrometry. Finally, all the targets had to be observable most part of the year to have a better coverage of the parallax ellipse. In Table 1, we present an overview of our targets, which provide spectral types and derived JHK photometry in the MKO (Mauna Kea Observatories) system (Stephens & Leggett 2004) for targets with 2MASS photometry. For the rest, we provide UKIDSS (UKIRT Infrared Deep Sky Survey) photometry, which is similar to MKO (Hewett et al. 2006). For the target ULAS J232035.28+144829.8, we provide the photometry from Murray et al. (2011), which is also similar to MKO. In the last column, we add references to the discovery papers.
| Name | SpT | [mag] | [mag] | [mag] | ref. objects | exS | epochs | Reference |
|---|---|---|---|---|---|---|---|---|
| 2MASS J11061197+2754225 | T (1) | 14.960.04 | 14.200.05 | 13.840.05 | 96 | 49 | 10 | (1) |
| ULAS J130217.21+130851.2 | T (5) | 18.110.04 | 18.600.06 | 18.280.03 | 247 | 68 | 12 | (2) |
| ULAS J141756.22+133045.8 | T (3) | 16.770.01 | 17.000.03 | 17.000.04 | 77 | 99 | 10 | (3) |
| 2MASS J22541892+3123498 | T (4) | 15.320.05 | 15.060.08 | 14.990.15 | 644 | 125 | 10 | (4) |
| ULAS J232035.28+144829.8 | T (6) | 16.790.02 | 17.140.04 | 17.400.03 | 298 | 46 | 12 | (3) |
| ULAS J232123.79+135454.9 | T (2) | 16.690.03 | 17.090.06 | 17.360.10 | 278 | 73 | 11 | (3) |
Images were taken with the near-IR camera Omega-2000 on the 3.5 m telescope at Calar Alto in band. Omega-2000 is a prime-focus, near-IR camera with a wide field that uses a 2k x 2k focal plane array with sensitivity from the z band to the K band. The camera provides a 15.4’ x 15.4’ field of view with a resolution of 0.45”/pixel. The wide field of Omega-2000 allows us to convert from relative parallaxes and proper motions to absolute values using galaxies (between 50 and 130 galaxies in each field). The astrometric observations were taken in service mode in the band. In all the cases, 15 single frames with exposure times of 60s were taken with dithering.
Our observations have been taken between March 2011 and June 2013 in 24 epochs. The baseline varies from 23 to 27 months. In the case of the object ULAS J232035.28+144829.8, we also used one observation, which was taken in July 2009 with Omega-2000 in the methane filter; therefore, the baseline for this object is almost four years. The average seeing on Calar Alto during our observations was around 1.0”. We typically observed at 1-2 hr from the meridian, so that DCR might be significant (Stone 1996, Pravdo & Shaklan 1996). Further details about the estimation of the DCR corrections are given in Section 3.2.
Dark frames and sky flats were taken every evening, and the bad pixel mask was derived from the dark current analysis by an appropriate cut in the goodness-of-fit of the linear relation between dark current and exposure time. The fifteen individual raw images were corrected using flats, darks and bad pixels mask frames. To perform the reduction of the raw images, we used the MPIA Omega-2000 pipeline, which runs under MIDAS. The outputs are single, calibrated images for each epoch. Before performing the analysis of our images, we stacked the fifteen single exposures to get a better S/N. The stacking process was carried out using the algorithm explained in Mutchler & Fruchter (1997) and Fruchter & Hook (2002). The single images are slightly shifted, so they must be previously aligned. These images are aligned in a world coordinate system, so that corresponding astronomical objects are stacked on top of each other. A median image of the shifted frames is extracted. Since the images were shifted with different offsets, only the central area overlaps for all frames. The outer regions, where individual images do not contribute are marked and left blank. To check if the stacking actually improved the final value for the parallax and proper motions, we repeated the analysis using the fifteen single frames and the result obtained was less accurate than using stacked images. Therefore, we used the stacked frames for the final analysis.
3 Analysis
3.1 Astrometry
We obtained positional measurements for all of the sources in each field from SExtractor (Bertin & Arnouts 1996) using the parameter XWIN_IMAGE. SExtractor determines the background and identifies whether pixels belong to background or to objects. The program splits up the area that is not background into separate objects and determines the properties of each object. The output from SExtractor is a catalog for each epoch and field that contains all the objects in each field, the positions with error, instrumental magnitudes and errors, instrumental fluxes and errors, and star/galaxy classification among other parameters. The errors in position provided by SExtractor are estimated using photon statistics. This estimate is considered to be a lower value of the real error.
The next step to create an astrometric catalog with the objects in our fields was to associate the detections in the multiple epochs that belonged to a common set of objects. For that, we cross-identified stars and we matched detections in a given frame to an astrometric reference catalog. As the telescope did not provide WCS information in the image headers, we used the software from www.astrometry.net (Lang et al. 2010) to perform a preliminary astrometry. The reference catalog used is the USNO-B1.0 catalog (Monet et al. 2003). This preliminary astrometry cannot be better than the accuracy of the catalog, which is around 200 mas. Then, we refined the initial guess using the software SCAMP (Bertin 2006) by choosing the first stacked image of the first epoch for each target as reference catalog. The reference objects used to perform the astrometry were distributed uniformly in the fields. These fields contained between 70 and 650 references. A different weight was given to the high S/N reference objects and the small S/N reference objects.
We constructed the catalog of associated detections by starting with the list of detections in the first stacked image on the first epoch, and then adding detections from the next epoch by finding matches between the objects in the catalogs. We performed the match of the catalogs using the IRAF routine tables.ttools.tmatch. This routine deletes the objects, which are not detected in all the epochs, but mainly faint targets and stars at the edges of the fields. We used a search radius of 1” around the object from the reference catalog.
3.2 DCR correction
The DCR effect results in astrometric shifts of the centroids (in any single-band imaging survey) because of the dependence of the refractive index of air on the wavelength. The reference objects and the targets have a different flux distribution in the band because they have different spectral types. Thus, their positions shift relative to one another due to different amounts of atmospheric refraction. Therefore, the DCR is a potential source of astrometric error, and it must be estimated.
In our case, the observations were typically performed between 1 and 2 hr from the meridian. To estimate the magnitude of the resulting DCR for the field stars and the targets, we used the formula according to Monet et al. (1992), Stone (1996), Pravdo & Shaklan (1996), and Kaczmarczik et al. (2009). We calculated the DCR effect for the targets relative to the typical field stars (M dwarfs). The correction due to DCR was typically 1 mas for the relative position between target and field stars. Since our typical parallax errors are of the order of 3-6 mas (see Section 3.3.2), it was not necessary to take the DCR into account. We also checked the influence of an epoch taken far from the meridian in the final result for the parallax. The conclusion was that the final parallax value did not change significantly. We discuss other astrometric error sources in detail in Section 3.4.
3.3 Parallaxes
3.3.1 Relative parallaxes
For the target and each object in the field, we use the positions in each epoch with their errors as an input to a fit. Errors used for the fitting are the residuals in right ascension and declination, respectively, and have been determined iteratively. These errors include all the error sources explained in Section 3.4. We fit the positions ( and ), proper motions ( and ), and the parallax (). Each fit to 2 x measurements had 2 x – 5 degrees of freedom. It is important to note that this parallax is a relative parallax, which uses field objects in the field of the target as references.
The apparent trajectory of each object in the field was then fitted to an astrometric model:
| (1) |
| (2) |
where and are the positional offsets with respect to the first epoch of observation at ; is the time; and are the proper motion in RA and DEC, is the parallax; and and are the parallax factors in RA and DEC, respectively.
3.3.2 Correction from relative to absolute parallax
As mentioned before, the parallaxes from the astrometric solution are relative to the position of the background objects chosen as references. In general, these objects were field objects that may have their own parallaxes and proper motions, so that a correction is based upon the true parallaxes of the reference objects to convert to an absolute measurement. The field objects used as references are weighted depending on their S/N, giving more weight to the objects with better S/N. Given the large field of view of Omega-2000 (15.4’ x 15.4’), we can find a sufficient number of extragalactic sources in all our fields. To derive the absolute parallax from the relative parallax, we used the extragalactic sources (exS) that we found in the fields of our targets. We searched for the extragalactic sources by setting the keyword CLASS_STAR in SExtractor. This software classifies extragalactic sources and stars in a field using neural networks, as explained in Bertin & Arnouts (1996) by applying a method called . Afterward, we determined the relative parallaxes of all the objects that were classified as extragalactic sources. We made a histogram of parallaxes and proper motions of these sources. As we could detect plenty of outliers in the histograms, we removed the objects with parallaxes or proper motions that were further than 3- away from the median in parallaxes or proper motions. We fitted a Gaussian function to the histogram of the parallaxes after deleting these outliers. Finally, the relative parallax for the extragalactic sources () is the mean of the fitted Gaussian, and the error of this parallax is the error in the mean for the Gaussian fitted to our data.
We correct the relative parallax to the absolute parallax as follows: , where is the absolute parallax for the object, is the relative parallax of the object, and is derived as described above.
We execute a similar procedure to calculate the absolute proper motions given in Table 2.
3.4 Absolute parallax accuracy
We have several error sources, which arise at different phases in our analysis:
-
•
Centroid errors. These errors are calculated by SExtractor using an iterative method. The positional uncertainties due to image centroiding in the relative position of the target is on average 1.5 mas.
-
•
Atmospheric image motions. Atmospheric effects also limit the precision of the astrometry in several different ways, such as intensity scintillation, image blurring, image motion and speckle structure. We estimated this effect using the expression given in Lindegren (1980): under the condition: . The parameter is the integration time in seconds (60 s x 15 single images), is the diameter of the field in radians ( rad) and is the diameter of the telescope in meters (3.5 m). The variance for the atmospheric image motion is estimated to be 5 mas per epoch.
-
•
DCR effect. This error was calculated as explained in Section 3.2, and it is typically 1 mas per epoch.
-
•
Plate solution. Distortions are introduced by the instrument because it is not sufficiently stable, as it is dismounted between two epochs. The program SCAMP calculates the best astrometric solution performing a minimization and calculates the distortions using the relative positions of the reference objects between the reference catalog and the catalogs of all epochs. The value of the residual distortion is between 5 and 10 mas for bright stars per epoch. The distortions due to the images stacking are negligible. We measure up to 0.04% distortions or 0.5 pixel distortions from center to corner (Bailer-Jones et al. 2000).
-
•
Error in the conversion from relative to absolute parallaxes. It is calculated Section 3.3.2. The typical value of these uncertainties is 1.5 mas.
4 Results
The astrometric and photometric results for the six objects are compiled in Table 2. Column 1 contains the object’s name. Columns 2 and 3 give the derived absolute proper motions in right ascension () and declination () for the targets; column 4 gives the relative parallax (). In column 5, we provide the absolute parallax (). Column 6 contains the derived distance (d) from the absolute parallax results. Column 7 provides the photometric distance () in pc, using the relation published in Goldman et al. (2010), and column 8 contains the values for and , which is the number of degrees of freedom.
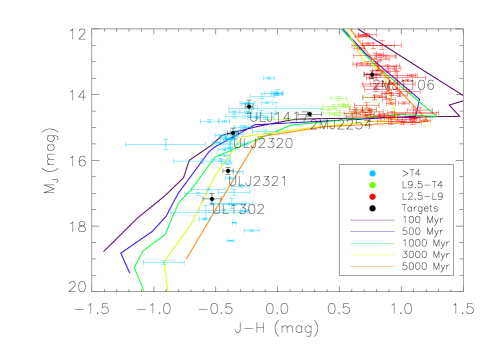
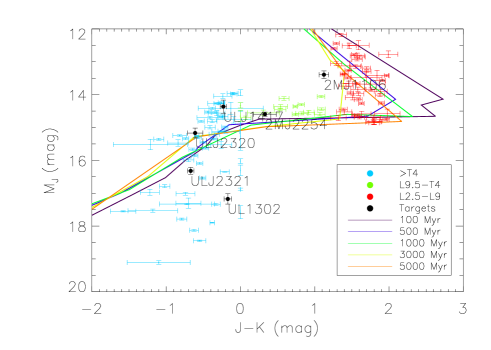
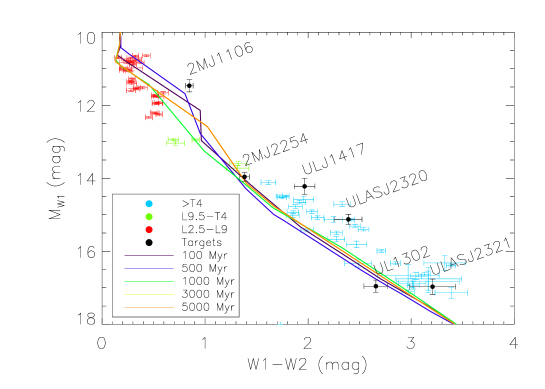
To characterize our targets, we plot them in a color-magnitude diagram (CMD) with the 177 L, L-T, and T brown dwarfs published by Dupuy & Liu (2012) with magnitudes in the MKO system. Our magnitudes were originally in the 2MASS photometric system, so that we use the relation published in Stephens & Leggett (2004) to transform between the 2MASS photometric system and the MKO system. The rest of the targets have UKIDSS photometry, which is similar to the MKO photometry (Hewett et al. 2006). For the target ULAS 2320+1448 we provide the photometry from Murray et al. (2011), also similar to MKO. We plot (, ) and (, ) and (, ) using WISE photometry.
5 Discussion
5.1 2MASS J11061197+2754225
This object was discovered by Looper et al. (2007). It was identified using a near infrared (NIR) proper-motion survey based on multi-epoch data from the Two Micron All Sky Survey (2MASS). It was classified as a T2.5 BD using the IRTF SpeX spectrograph in low-resolution mode with a resolution of R150. Looper et al. (2007) estimated the spectrophotometric distance as pc, which was calculated using the spectral types that were derived in the same article and by using the Liu et al. (2006) spectral type versus magnitude relation without known binaries. Burgasser et al. (2010) proposed this target to be a strong binary candidate in a and system, although Looper et al. (2008) performed high angular resolution imaging with NIRC2/Keck II, finding only one source.
The location of the object in Figures 1 and 2 seem to give a luminosity inconsistent with the classification provided before (Looper et al. 2007; Kirkpatrick et al. 2010) by using indices in the NIR. Looper et al. (2007) mentions that J1106+27 is distinctly (¿ 1-) bluer in the z-J band in SDSS than all the T2 brown dwarfs in their sample. In our CMD (see Fig. 1 and 2), the object is also overluminous by 1 mag. Due to its overluminosity, this object is a good candidate for a binary system or even high order multiplicity, although this issue should be studied in more detail using high resolution images or high resolution spectroscopy. The spectroscopic distance provided by Looper et al. (2007) is not compatible with the distance derived from the trigonometric absolute parallax within the error bars. The calculated distance is pc.
5.2 ULAS J130217.21+130851.2
This object was discovered by Burningham et al. (2010), and it was classified as a T8.5 BD by using NIRI on the Gemini North Telescope and IRCS on the Subaru telescope on Mauna Kea, Hawaii. The spectral classification was based on the spectral indices given by Burgasser et al. (2006b). The object ULAS J1302+13 was later re-typed as T8 by Cushing et al. (2011).
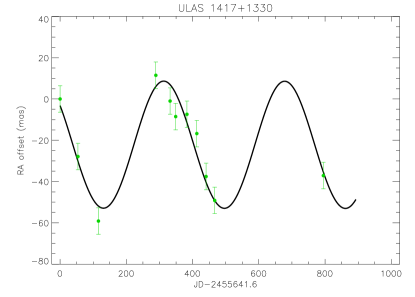
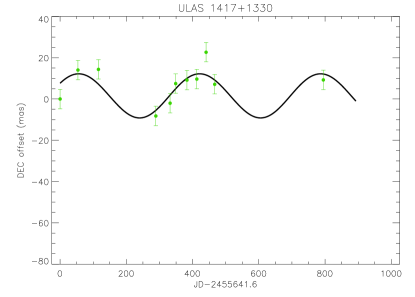
5.3 ULAS J141756.22+133045.8
The discovery of ULAS J141756.22+133045.8 was first published by Scholz (2010). It was classified as T5.51.0 BD and based on colors and absolute magnitudes from UKIDSS and SDSS. The absolute proper motions were also estimated, using UKIDSS and SDSS data with a baseline of five years, but only with three different epochs.
The result supplied in Scholz (2010) for the absolute proper motions were mas/yr and mas/yr. Scholz (2010) pointed out that the formal errors were very small and were due to the few number of epochs and so that the errors could be unrealistic. The estimated errors by Scholz (2010) were 24 mas/yr, which was the scatter of their data around the best fit to the model.
Burningham et al. (2013) presented YJHK spectroscopy for this object using the Gemini Near Infrared Spectrograph (GNIRS) and derived a type a spectral type of .
Comparing the results from Scholz (2010) for the proper motions with our results and taking the errors into account, the results are compatible. With regard to Fig. 2, we can conclude that this object is slightly overluminous in WISE by around 0.2 mag. In Fig. 1, this overluminosity is not that clear, although the object is at the edge of the bulk of objects. Our result for the distance is pc.
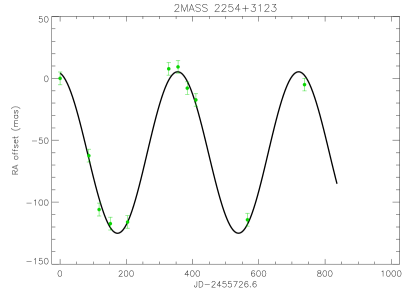
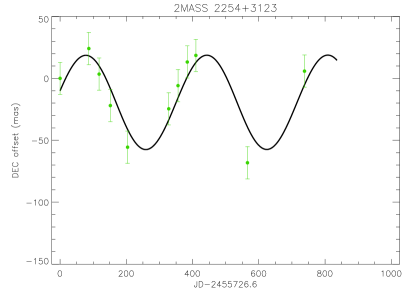
5.4 2MASS J22541892+3123498
The object 2MASS J22541892+3123498 was first published as a brown dwarf by Burgasser et al. (2002a). It was classified as a T5V BD by using spectral observations in NIR with R 1200 and by calculating the spectral indices, as explained in Burgasser et al. (2002a). Afterward, the spectral type was recalculated using the criteria given in Burgasser et al. (2003) as a standard T4 BD (Burgasser et al. 2004, 2006b). The proper motions were also estimated by Jameson et al. (2008) using WFCAM at UKIRT from February to August 2006. Their result for the proper motions was mas/yr and mas/yr.
Our results for the proper motions agree with the result given by Jameson et al. (2008) within the error bars. This object is not overluminous. The provided distance is pc, and it has been calculated for the first time.
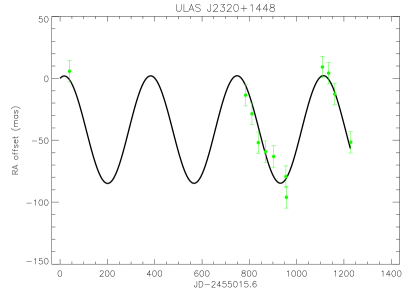
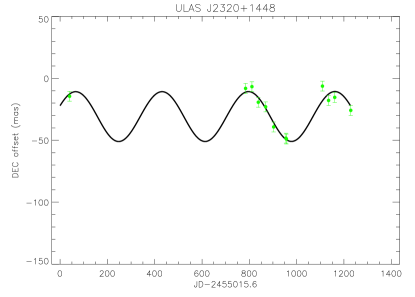
5.5 ULAS J232035.28+144829.8
The discovery of this object was first published by Burningham et al. (2010), and it was classified as a T5 spectral type using medium resolution spectroscopy. In Scholz (2010), the object is classified as T7.02.0 using colors from UKIDSS and SDSS. In Murray et al. (2011), the spectral indices were recalculated, using data from NIRI on the Gemini-North telescope with a spectral resolution of R460; the new classification is T61.
In Scholz (2010), the proper motions were given as mas/yr and mas/yr. These proper motions were calculated with a baseline of seven years; nevertheless, there were only three epochs in total, and two of them very close to each other. The estimated error in Scholz (2010) due to the scatter around the best fit to the model was 11 mas/yr.
In Murray et al. (2011), the proper motions and the distance were also estimated performing a photometric follow-up using UKIDSS, by obtaining proper motions of mas/yr, mas/yr, and distance of pc.
The proper motions, which we obtained, agree to the values provided by Scholz (2010) and Murray et al. (2011) within the error bars, but our values are more precise. We also agree with Murray et al. (2011) on the distance to within the error bars. This object is not overluminous (see Fig. 1 and 2). The calculated distance is pc.
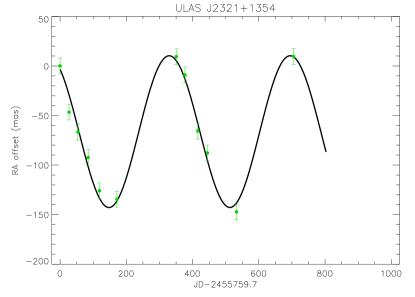
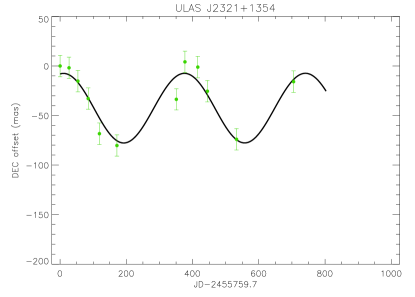
5.6 ULAS J232123.79+135454.9
The brown dwarf discovery of ULAS J232123.79+135454.9 was first published by Scholz (2010). It was classified with a spectral type of T using UKIDSS and SDSS colors. This object was also classified in Burningham et al. (2010) as a T7.5 using medium resolution spectroscopy.
Scholz (2010) also provided the proper motions using SDSS and UKIDSS with a baseline of seven years and four epochs taken along this baseline. The proper motions were given as mas/yr and mas/yr with an estimated error of 10 mas/yr due to the scatter of the data around the fit to the best model. Kirkpatrick et al. (2012) provided a distance limit of approximately 20 pc.
The object ULAS J232123.79+135454.9 is not overluminous (see Fig. 1 and 2). We agree with Scholz (2010) on the result for the proper motion within the error bars. Kirkpatrick et al. (2012) adopted a distance of 14.1 pc. Our result for the distance is pc.
| Object | (mas/yr) | (mas/yr) | (mas) | (mas) | d (pc) | (pc) | / |
|---|---|---|---|---|---|---|---|
| 2M J1106+2754 | |||||||
| ULAS J1302+1308 | |||||||
| ULAS J1417+1330 | |||||||
| 2M J2254+3123 | |||||||
| ULAS J2320+1448 | |||||||
| ULAS J2321+1354 |
6 Conclusions
We have measured the trigonometric parallaxes of six T brown dwarfs for the first time with spectral types between T2.5 and T7.5.
We compare our results to the spectrophotometric distance given by Goldman et al. (2010) and to the results of the spectrophotometric distance and proper motions provided in other studies such as Scholz (2010), Looper et al. (2007) and Kirkpatrick et al. (2012) among others. Our results generally agree well with other studies, but they are more precise.
We also compare the locations of our targets in (J-H, ) and (J-K, ) CMDs to those of the objects by Dupuy & Liu (2012) and to the evolutionary tracks by Allard et al. (2012).
Four of our six targets are not overluminous. Nevertheless, the object ULAS J141756.22+133045.8 is slightly overluminous in the WISE CMD. It has an absolute magnitude in W1, which is around 0.2 mag brighter than the objects with the same spectral types. Its overluminosity is not seen in the CMDs in MKO photometry. The object 2MASS J11061197+2754225 is more than 1 mag overluminous in all the bands, pointing to binarity or even higher multiplicity. To confirm these results, high resolution imaging and high resolution spectroscopy is needed.
Acknowledgements.
We acknowledge J. A. Caballero, M. R. Zapatero Osorio, V. J. S. Béjar, W. Brandner, A. Bayo, A. Burgasser and B. Burningham for their help, their corrections and contructive criticism. We thank in particular to our referee T. Dupuy for his useful advice, which substantially helped to improve our paper. This work was supported by Sonderforschungsbereich SFB 881 The Milky Way System (subproject B6) of the German Research Foundation (DFG).References
- Allard et al. (2012) Allard, F., Homeier, D., & Freytag, B. 2012, in IAU Symposium, Vol. 282, IAU Symposium, ed. M. T. Richards & I. Hubeny, 235–242
- Bailer-Jones et al. (2000) Bailer-Jones, C. A., Bizenberger, P., & Storz, C. 2000, in Society of Photo-Optical Instrumentation Engineers (SPIE) Conference Series, Vol. 4008, Society of Photo-Optical Instrumentation Engineers (SPIE) Conference Series, ed. M. Iye & A. F. Moorwood, 1305–1316
- Basri et al. (1995) Basri, G., Marcy, G. W., & Graham, J. R. 1995, in Bulletin of the American Astronomical Society, Vol. 27, American Astronomical Society Meeting Abstracts #186, 1214
- Becklin & Zuckerman (1988) Becklin, E. E. & Zuckerman, B. 1988, Nature, 336, 656
- Bertin (2006) Bertin, E. 2006, in Astronomical Society of the Pacific Conference Series, Vol. 351, Astronomical Data Analysis Software and Systems XV, ed. C. Gabriel, C. Arviset, D. Ponz, & S. Enrique, 112
- Bertin & Arnouts (1996) Bertin, E. & Arnouts, S. 1996, A&AS, 117, 393
- Burgasser et al. (2006a) Burgasser, A. J., Burrows, A., & Kirkpatrick, J. D. 2006a, ApJ, 639, 1095
- Burgasser et al. (2010) Burgasser, A. J., Cruz, K. L., Cushing, M., et al. 2010, ApJ, 710, 1142
- Burgasser et al. (2003) Burgasser, A. J., Geballe, T. R., Golimowski, D. A., et al. 2003, in IAU Symposium, Vol. 211, Brown Dwarfs, ed. E. Martín, 377
- Burgasser et al. (2006b) Burgasser, A. J., Geballe, T. R., Leggett, S. K., Kirkpatrick, J. D., & Golimowski, D. A. 2006b, ApJ, 637, 1067
- Burgasser et al. (2002a) Burgasser, A. J., Kirkpatrick, J. D., Brown, M. E., et al. 2002a, ApJ, 564, 421
- Burgasser et al. (2002b) Burgasser, A. J., Marley, M. S., Ackerman, A. S., et al. 2002b, ApJ, 571, L151
- Burgasser et al. (2004) Burgasser, A. J., McElwain, M. W., Kirkpatrick, J. D., et al. 2004, AJ, 127, 2856
- Burgasser et al. (2008) Burgasser, A. J., Vrba, F. J., Lépine, S., et al. 2008, ApJ, 672, 1159
- Burningham et al. (2013) Burningham, B., Cardoso, C. V., Smith, L., et al. 2013, MNRAS, 433, 457
- Burningham et al. (2010) Burningham, B., Pinfield, D. J., Lucas, P. W., et al. 2010, MNRAS, 406, 1885
- Burrows et al. (2006) Burrows, A., Sudarsky, D., & Hubeny, I. 2006, ApJ, 640, 1063
- Cushing et al. (2011) Cushing, M. C., Kirkpatrick, J. D., Gelino, C. R., et al. 2011, ApJ, 743, 50
- Dahn et al. (2002) Dahn, C. C., Harris, H. C., Vrba, F. J., et al. 2002, AJ, 124, 1170
- Dupuy & Liu (2012) Dupuy, T. J. & Liu, M. C. 2012, ApJS, 201, 19
- Faherty et al. (2012) Faherty, J. K., Burgasser, A. J., Walter, F. M., et al. 2012, ApJ, 752, 56
- Fruchter & Hook (2002) Fruchter, A. S. & Hook, R. N. 2002, PASP, 114, 144
- Goldman et al. (2010) Goldman, B., Marsat, S., Henning, T., Clemens, C., & Greiner, J. 2010, MNRAS, 405, 1140
- Hewett et al. (2006) Hewett, P. C., Warren, S. J., Leggett, S. K., & Hodgkin, S. T. 2006, MNRAS, 367, 454
- Hog et al. (2000) Hog, E., Fabricius, C., Makarov, V. V., et al. 2000, VizieR Online Data Catalog, 1259, 0
- Jameson et al. (2008) Jameson, R. F., Casewell, S. L., Bannister, N. P., et al. 2008, MNRAS, 384, 1399
- Kaczmarczik et al. (2009) Kaczmarczik, M. C., Richards, G. T., Mehta, S. S., & Schlegel, D. J. 2009, AJ, 138, 19
- Kirkpatrick et al. (2012) Kirkpatrick, J. D., Gelino, C. R., Cushing, M. C., et al. 2012, ApJ, 753, 156
- Kirkpatrick et al. (2010) Kirkpatrick, J. D., Looper, D. L., Burgasser, A. J., et al. 2010, ApJS, 190, 100
- Lang et al. (2010) Lang, D., Hogg, D. W., Mierle, K., Blanton, M., & Roweis, S. 2010, AJ, 139, 1782
- Lindegren (1980) Lindegren, L. 1980, A&A, 89, 41
- Liu et al. (2007) Liu, M. C., Leggett, S. K., & Chiu, K. 2007, ApJ, 660, 1507
- Liu et al. (2006) Liu, M. C., Leggett, S. K., Golimowski, D. A., et al. 2006, ApJ, 647, 1393
- Looper et al. (2008) Looper, D. L., Gelino, C. R., Burgasser, A. J., & Kirkpatrick, J. D. 2008, ApJ, 685, 1183
- Looper et al. (2007) Looper, D. L., Kirkpatrick, J. D., & Burgasser, A. J. 2007, AJ, 134, 1162
- Marocco et al. (2010) Marocco, F., Smart, R. L., Jones, H. R. A., et al. 2010, A&A, 524, A38
- Monet et al. (1992) Monet, D. G., Dahn, C. C., Vrba, F. J., et al. 1992, AJ, 103, 638
- Monet et al. (2003) Monet, D. G., Levine, S. E., Canzian, B., et al. 2003, AJ, 125, 984
- Murray et al. (2011) Murray, D. N., Burningham, B., Jones, H. R. A., et al. 2011, MNRAS, 414, 575
- Mutchler & Fruchter (1997) Mutchler, M. & Fruchter, A. 1997, in Bulletin of the American Astronomical Society, Vol. 29, American Astronomical Society Meeting Abstracts, 1271
- Nakajima et al. (1995) Nakajima, T., Oppenheimer, B. R., Kulkarni, S. R., et al. 1995, Nature, 378, 463
- Perryman (1997) Perryman, M. A. C. 1997, in Bulletin of the American Astronomical Society, Vol. 29, American Astronomical Society Meeting Abstracts, 1314
- Pravdo & Shaklan (1996) Pravdo, S. H. & Shaklan, S. B. 1996, ApJ, 465, 264
- Rebolo et al. (1995) Rebolo, R., Zapatero Osorio, M. R., & Martín, E. L. 1995, Nature, 377, 129
- Saumon & Marley (2008) Saumon, D. & Marley, M. S. 2008, ApJ, 689, 1327
- Schilbach et al. (2009) Schilbach, E., Röser, S., & Scholz, R.-D. 2009, A&A, 493, L27
- Scholz (2010) Scholz, R.-D. 2010, A&A, 515, A92
- Stephens & Leggett (2004) Stephens, D. C. & Leggett, S. K. 2004, PASP, 116, 9
- Stone (1996) Stone, R. C. 1996, PASP, 108, 1051
- Tinney et al. (2003) Tinney, C. G., Burgasser, A. J., & Kirkpatrick, J. D. 2003, AJ, 126, 975
- Tsuji et al. (1996) Tsuji, T., Ohnaka, K., Aoki, W., & Nakajima, T. 1996, A&A, 308, L29
- Vrba et al. (2004) Vrba, F. J., Henden, A. A., Luginbuhl, C. B., et al. 2004, AJ, 127, 2948
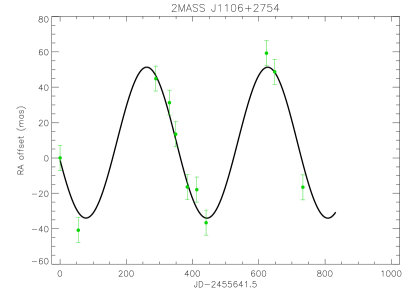
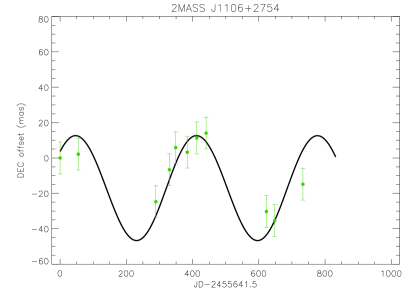
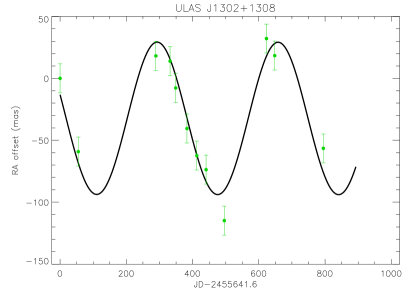
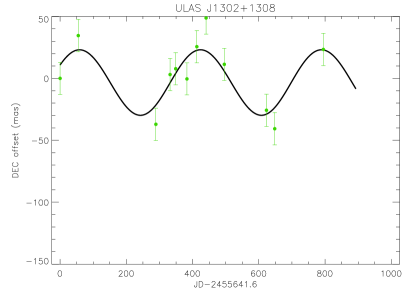
Appendix A Stellar paths of the targets
We include the stellar paths, which represent the change in right ascension (RA) and declination (DEC) in time for our targets in this Appendix.