SF2A 2013
Astrophysical false positives in exoplanet transit surveys:
why do we need bright stars ?
Abstract
Astrophysical false positives that mimic planetary transit are one of the main limitation to exoplanet transit surveys. In this proceeding, we review the issue of the false positive in transit survey and the possible complementary observations to constrain their presence. We also review the false-positive rate of both Kepler and CoRoT missions and present the basics of the planet-validation technique. Finally, we discuss the interest of observing bright stars, as PLATO 2.0 and TESS will do, in the context of the false positives. According to simulations with the Besançon galactic model, we find that PLATO 2.0 is expected to have less background false positives than Kepler, and thus an even lower false-positive rate.
keywords:
transit; exoplanet; false positive; galactic model; photometry; radial velocity1 Astrophysical false positives in transit surveys
Transiting exoplanets are the only planet for which it is possible to measure independently their mass and their radius. From these measurements, it is then possible to determine their bulk density and to model their internal structure. Since they pass in front or behind their host star, it is also possible to probe their atmosphere composition through transmission or emission spectroscopy. Therefore, transiting exoplanets strongly constrain theories of planet formation, migration and evolution (e.g. Mordasini et al. 2009, 2012).
Many photometric-transit surveys are searching for new transiting exoplanets, from the ground with e.g. SuperWASP, HATNet, etc…(Collier Cameron et al. 2007; Bakos et al. 2007) and from space with CoRoT (Baglin et al. 2006) and Kepler (Borucki et al. 2009). However, searching for new transiting exoplanets is not an easy task. Many configurations of diluted eclipsing binaries or diluted transiting planet might mimic the photometric transit of an exoplanet (Cameron 2012; Santerne et al. 2013, and Fig. 1). If they are not rigorously identified, those fake exoplanets (so-called “false positives”) might bias the distributions of planets used to constrain theories of planet formation, migration and evolution. More importantly, those false positives might lead planet theorists to wrong conclusions (C. Mordasini, Planet Validation Workshop).


To establish a new transiting exoplanet, one should first check that the observed photometric signal is due to a planet or to a false-positive scenario. For that, different kind of complementary observations can be used:
-
•
Ground-based high-resolution photometry (Deeg et al. 2009) or centroid measurement (Bryson et al. 2013) to reject background eclipsing binary contaminating the target’s PSF (Almenara et al. 2009). Adaptive optics images (Adams et al. 2012) or speckle observations (Howell et al. 2011) can also be used to constrain, closer to the star, the presence of a contaminant.
-
•
Infrared photometry to constrain the presence of a contaminating star with a different color than the target (Fressin et al. 2012).
-
•
High-resolution spectroscopy to identify multiple stellar systems (e.g. Santerne et al. 2012).
2 The false-positive probability
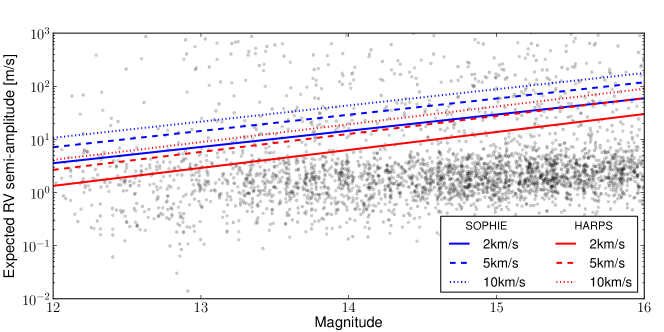
The CoRoT and Kepler space missions have discovered respectively 600 (Deleuil et al., in prep.) and 3000 exoplanet-candidates (Batalha et al. 2013) around host stars of magnitude ranging between 10 and 16. Radial velocity follow-up observations of such faint stars are limited by the photon noise (Santerne et al. 2011a). Figure 2 displays the expected radial velocity semi-amplitude of the Kepler candidates (assuming an Earth density for KOIs smaller than 2.5 R⊕, and the density of Neptune for those larger than 2.5 R⊕) as function of the magnitude of the host star. The majority of the Kepler candidates are expected to present a RV signal at the level of a few m.s-1 on stars fainter than the 14th magnitude. Such precision is below the photon noise of current spectrographs, like SOPHIE and HARPS, in one hour of exposure time (Santerne et al. 2011a, and Fig. 2). We therefore anticipated that only a small fraction (5% to 10%) of all the Kepler candidates can be established as bona-fide planet by measuring the Doppler reflex motion of the host star. For the CoRoT candidates, only 5% of the candidates have been established as planet and another 5% of the candidates are not resolved pending future observations with improved capabilities (e.g. with ESPRESSO on the ESO–VLT).
Identifying the false positive detections is a crucial task. Since only a small fraction of the Kepler and CoRoT candidates can be established as bona-wide planets, one alternative solution is to estimate the false positive probability (FPP) of the candidates. If the FPP is very low, planets statistics used to constrain theories might be done based on the candidates. Unfortunately, even if the FPP is low in average, there might exists some regions of the candidates parameters space which are more affected by the false positives (the FPP is not expected to be a constant value over all the candidates’ parameter space; Santerne et al. 2012; Fressin et al. 2013). If the theories try to reproduce high-FPP regions of the parameters space, it might incorrectly constrains the theories.
The FPP of the CoRoT mission has been estimated to be around 80% (Deleuil et al., in prep.). The FPP of the Kepler mission has been much more discussed. First, Morton & Johnson (2011) found a low-value of the FPP, in average lower than 5% and lower than 10% for 90% of the Kepler candidates. By observing with the SOPHIE spectrograph at Observatoire de Haute-Provence, Santerne et al. (2012) found a much higher FPP () for the giant close-in Kepler candidates. This observational value is not compatible with the Morton & Johnson (2011) estimation. Later, Fressin et al. (2013) re-estimate the overall Kepler FPP to be by modeling the efficiency of the Kepler pipeline to detect planets. This last value, is compatible with the measurement from Santerne et al. (2012), in the giant close-in regime. Finally, Santerne et al. (2013) studied the occurrence of eclipsing binaries for which only the secondary eclipse is seen from the Earth (because of some fine tuning of the orbital eccentricity, argument of periastron and orbital inclination) and re-evaluate the global Kepler FPP to .
The difference between Kepler and CoRoT FPP can be explained by the fact that Kepler is much more efficient to reject background eclipsing binary and background transiting planet than CoRoT, thanks to the measurement of the centroid during the transit. This can also be explained by the fact that the Kepler telescope observed at higher latitude in the galactic plane than CoRoT, where the stellar background is slightly less dense.
The Kepler FPP of is still too high to allow statistical analysis of the transiting planets based on the Kepler candidates neglecting the false positives. About 300 of these candidates are thus expected to be impostors (This number corresponds to 1/3 of all the planets discovered since 18 years). Moreover, these impostors can be more common in some regions of the parameter space, as for example, in the giant candidate regime (Santerne et al. 2012). According to the recent study of Fressin et al. (2013), most of the Kepler false positives are produced by background eclipsing binaries and planet transiting a star physically bound with the target.
3 The planet-validation technique
To establish the planetary nature of a candidate, another alternative solution is the so-called planet-validation technique (Torres et al. 2011). It consists in computing the probability of the planet scenario against an exhaustive set of false-positive scenarios. If the planet scenario is significantly the highest-probable scenario, thus the planet is considered as validated. Such model comparison can only be done in the Bayesian framework in which hypothesis have a probability (this is not the case in the frequentist approach). Basically, the odds ratio between each pair of scenarios is computed as following:
| (1) |
where is the hypothesis (e.g. transiting planet or background eclipsing binary, etc…), is the available data, the a priori information and is the parameter space of the model relative to the hypothesis . To compute this equation, it is needed to compute, first, the hypothesis prior factor (first part of the equation), and then, the Bayes’ factor (second part of the equation) which is the ratio between the two hypothesis posterior distributions marginalized over the whole parameter space. While the Bayes’ factor is estimated from the data using tools such as PASTIS (Díaz et al. 2013), the first term of this equation required to know the probability of the two considered hypothesis. When validating a planet, this hypothesis prior factor is the ratio between, e.g., the probability that a given star host a planet, over the probability that a given star is aligned by chance with an eclipsing binary.
To compute these a priori hypothesis probability, the occurrence of planets and binaries as well as the background stellar density are needed. The occurrence rate of planets and binaries have been estimated based on results from dedicated surveys (Howard et al. 2010; Mayor et al. 2011; Fressin et al. 2013; Halbwachs et al. 2003; Raghavan et al. 2010). The background density can be estimated using galactic star-count models like TRILEGAL (Girardi et al. 2005) or the Besançon Galactic Model (Robin et al. 2003). Roughly, a target of magnitude which present a transit of depth might be mimicked by a background eclipsing stellar contaminant of magnitude and depth following the equation:
| (2) |
Therefore, an equal mass eclipsing binary with depth % might mimic a 50ppm-depth transit on a star 10 magnitude***in the same bandpass brighter. Since CoRoT and Kepler targeted stars with magnitude up to 16, the population of potential false positives are stars up to magnitude 26.
4 Towards brighter stars with TESS and PLATO 2.0 space missions
Observing stars much brighter than CoRoT and Kepler targets, such as those in the scope of TESS and PLATO 2.0 have a main interest for transiting exoplanet characterization: radial velocity follow-up will be much more efficient, being limited only by the instrumental precision of spectrographs. With the next-generation spectrographs like ESPRESSO (ESO – VLT), it will be possible to characterize the mass of planets down to Earth-like planets in the habitable zone. Therefore, it will be possible to constrain the bulk density of TESS and PLATO 2.0 planets with an unprecedented accuracy. In the case of PLATO 2.0, stellar mass, radius and age of planet hosts will be determined precisely thanks to simultaneous asteroseismology, improving even more the accuracy of planet’s physical parameters. Many other scientific interests (in planetology as well as stellar physics) will be conducted by targeting bright stars and are discussed in Rauer et al. (2013) in the context of the PLATO 2.0 mission.
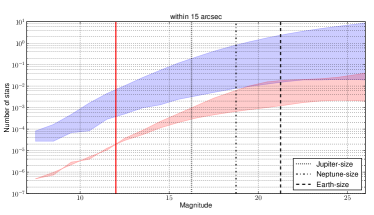
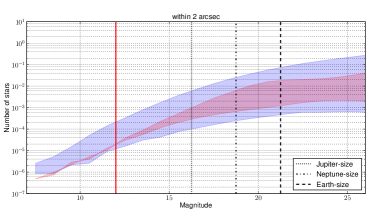
Targeting bright stars also have a great interest in terms of astrophysical false positives. Indeed, we might expect that by targeting stars brighter than those observed by Kepler, the background stellar density will be much lower, and thus, there will be much lower background false positives (background eclipsing binaries and background transiting planets). This is true only if the instrument’s PSF size and the stellar density of the various fields are similar. To qualitatively compare the two effects, we generated field population using the Besançon galactic model within 1 deg2 up to magnitude R=27 for extreme coordinates in the Kepler fields (from b = 5.6∘ – l = 75.7∘ to b = 20.9∘ – l = 76.5∘) and in the preliminary-defined northern long run of the PLATO 2.0 mission (from b = 0∘ – l = 68.5∘ to b = 65∘ – l = 40∘). We then extrapolated the star count provided by the Besançon galactic model to the exclusion radius of Kepler and PLATO 2.0 (See Fig. 3). For Kepler, we considered that Kepler is able to discard background eclipsing binaries located in a different pixel than the target, hence with an exclusion radius of 2 arcsec†††the pixels of the Kepler telescope are 3.96 arcsec large (See Fig. 3). Typically, considering a Kepler target of magnitude 16, there is between 0.04 and 0.5 background star within a radius of 2 arcsec that might mimic a planetary transit down to an Earth-size planet. If we assume than PLATO 2.0 will have the same efficiency than Kepler to discard background eclipsing binaries, but with pixels of 15 arcsec (Rauer et al. 2013), there will be between 0.04 and 3.6 stars in the background of a 12th magnitude target that might mimic an Earth-size planet. These numbers are much larger than for the Kepler mission. Fortunately, PLATO 2.0 will observe stars with 8 up to 32 telescopes (Rauer et al. 2013). Assuming that the centroid precision follows the square root of the number of telescope, we find that the maximum number of background stars aligned by chance with PLATO 2.0 targets of magnitude 12 mimicking down to an Earth-size planet are 0.45 and 0.11 star for 8 and 32 telescopes (respectively). This means that we might expect less background false positives in the PLATO 2.0 mission compared with Kepler, and thus, a lower false-positive rate for PLATO 2.0 (assuming that the rate of bounded false positives is similar for Kepler than PLATO 2.0). Since TESS will observe stars with only one telescope with large pixels, we expect a large number of background false positives, at least for targets close to the galactic plane.
We stress that these results are a rough estimation of the false-positive probability of the PLATO 2.0 mission, in comparison with Kepler. A more rigorous analysis of the expected false-positive probability of this mission will be performed as soon as the PLATO 2.0 fields and list of targets are defined.
5 Conclusions and discussion
Astrophysical false positives are a classical nuisance of exoplanet transit surveys. Neglecting them might lead exoplanet theorists to wrong conclusion. It is therefore crucial to account for them in statistical analysis of transit candidates. For that, the best option is to establish all the candidates by measuring their mass using dedicated Doppler observations. Unfortunately, the CoRoT and Kepler targets are too faint to allow the characterization of the smallest candidates. The false-positive rate is the key value to perform statistical analysis of the candidates to derive planet properties. For the CoRoT mission, the false-positive rate is about 80% while the Kepler false-positive rate has been quite discussed. The latest estimation find a value of (Santerne et al. 2013). Another possibility is to validate statistically all candidates using tools such as PASTIS (Díaz et al. 2013).
Next-generation transit space missions (namely TESS and PLATO 2.0) will target much brighter stars than CoRoT and Kepler. First, the Doppler observations will be much more efficient to characterize small planets (especially with new spectrographs like ESPRESSO) and then, we might expected to have less false positives in the scope of PLATO 2.0 than Kepler since the background of bright targets is less dense in potential false positives than for faint targets. We therefore anticipate a lower false-positive rate for PLATO 2.0 than for Kepler. On the other hand, TESS will observe bright targets with large pixels within which a significant amount of potential false positives might reside. However, this will strongly depends on the galactic latitude of the target. A more detailed study of the expected false-positive probability of both missions can be performed as soon as the target list is defined.
Acknowledgements.
AS acknowledges the support by the European Research Council/European Community under the FP7 through Starting Grant agreement number 239953. RFD is supported by CNES. AS also acknowledges the administrative council of SF2A for providing him a grant to attend this meeting.References
- Adams et al. (2012) Adams, E. R., Ciardi, D. R., Dupree, A. K., et al. 2012, AJ, 144, 42
- Almenara et al. (2009) Almenara, J. M., Deeg, H. J., Aigrain, S., et al. 2009, A&A, 506, 337
- Baglin et al. (2006) Baglin, A., Auvergne, M., Boisnard, L., et al. 2006, 36th COSPAR Scientific Assembly, 36, 3749
- Bakos et al. (2007) Bakos, G. Á., Noyes, R. W., Kovács, G., et al. 2007, ApJ, 656, 552
- Batalha et al. (2013) Batalha, N. M., Rowe, J. F., Bryson, S. T., et al. 2013, ApJS, 204, 24
- Borucki et al. (2009) Borucki, W. J., Koch, D., Jenkins, J., et al. 2009, Science, 325, 709
- Bryson et al. (2013) Bryson, S. T., Jenkins, J. M., Gilliland, R. L., et al. 2013, arXiv:1303.0052
- Collier Cameron et al. (2007) Collier Cameron, A., Bouchy, F., Hébrard, G., et al. 2007, MNRAS, 375, 951
- Cameron (2012) Cameron, A. C. 2012, Nature, 492, 48
- Deeg et al. (2009) Deeg, H. J., Gillon, M., Shporer, A., et al. 2009, A&A, 506, 343
- Díaz et al. (2013) Díaz, R. F., Almenara, J.-M., Santerne, A., et al. 2013, submitted to MNRAS
- Faigler et al. (2013) Faigler, S., Tal-Or, L., Mazeh, T., Latham, D. W., & Buchhave, L. A. 2013, ApJ, 771, 26
- Fressin et al. (2012) Fressin, F., Torres, G., Pont, F., et al. 2012, ApJ, 745, 81
- Fressin et al. (2013) Fressin, F., Torres, G., Charbonneau, D., et al. 2013, ApJ, 766, 81
- Girardi et al. (2005) Girardi, L., Groenewegen, M. A. T., Hatziminaoglou, E., & da Costa, L. 2005, A&A, 436, 895
- Halbwachs et al. (2003) Halbwachs, J. L., Mayor, M., Udry, S., & Arenou, F. 2003, A&A, 397, 159
- Holman et al. (2010) Holman, M. J., Fabrycky, D. C., Ragozzine, D., et al. 2010, Science, 330, 51
- Howard et al. (2010) Howard, A. W., Marcy, G. W., Johnson, J. A., et al. 2010, Science, 330, 653
- Howell et al. (2011) Howell, S. B., Everett, M. E., Sherry, W., Horch, E., & Ciardi, D. R. 2011, AJ, 142, 19
- Mayor et al. (2011) Mayor, M., Marmier, M., Lovis, C., et al. 2011, arXiv:1109.2497
- Mordasini et al. (2009) Mordasini, C., Alibert, Y., Benz, W., & Naef, D. 2009, A&A, 501, 1161
- Mordasini et al. (2012) Mordasini, C., Alibert, Y., Georgy, C., et al. 2012, A&A, 547, A112
- Morton & Johnson (2011) Morton, T. D., & Johnson, J. A. 2011, ApJ, 738, 170
- Rauer et al. (2013) Rauer, H., Catala, C., Aerts, C. et al. 2013, submitted to EA, arXiv:1310.0696
- Raghavan et al. (2010) Raghavan, D., McAlister, H. A., Henry, T. J., et al. 2010, ApJS, 190, 1
- Robin et al. (2003) Robin, A. C., Reylé, C., Derrière, S., & Picaud, S. 2003, A&A, 409, 523
- Santerne et al. (2011a) Santerne, A., Endl, M., Hatzes, A., et al. 2011a, European Physical Journal Web of Conferences, 11, 2001
- Santerne et al. (2011b) Santerne, A., Díaz, R. F., Bouchy, F., et al. 2011b, A&A, 528, A63
- Santerne et al. (2011c) Santerne, A., Bonomo, A. S., Hébrard, G., et al. 2011c, A&A, 536, A70
- Santerne et al. (2012) Santerne, A., Díaz, R. F., Moutou, C., et al. 2012, A&A, 545, A76
- Santerne et al. (2013) Santerne, A., Fressin, F., Díaz, R. F., et al. 2013, A&A, 557, A139
- Torres et al. (2011) Torres, G., Fressin, F., Lissauer, J. J., et al. 2011, Bulletin of the American Astronomical Society, #112.06