Prepulse and amplified spontaneous emission effects on the interaction of a petawatt class laser with thin solid targets
Abstract
When a finite contrast petawatt laser pulse irradiates a micron-thick foil, a prepulse (including amplified spontaneous emission) creates a preplasma, where an ultrashort relativistically strong portion of the laser pulse (the main pulse) acquires higher intensity due to relativistic self-focusing and undergoes fast depletion transferring energy to fast electrons. If the preplasma thickness is optimal, the main pulse can reach the target generating fast ions more efficiently than an ideal, infinite contrast, laser pulse. A simple analytical model of a target with preplasma formation is developed and the radiation pressure dominant acceleration of ions in this target is predicted. The preplasma formation by a nanosecond prepulse is analyzed with dissipative hydrodynamic simulations. The main pulse interaction with the preplasma is studied with multi-parametric particle-in-cell simulations. The optimal conditions for hundreds of MeV ion acceleration are found with accompanying effects important for diagnostics, including high-order harmonics generation.
I Introduction
Petawatt (PW) power class laser interaction with various targets enables novel regimes of high energy charged particle acceleration and high brightness coherent and incoherent electromagnetic radiation generation over a wide range of photon energies MTB ; KI ; ESL ; SC ; UFN ; HHG .
One of the central scientific goals of studying relativistic laser plasmas is to obtain high-quality ion beams accelerated to hundreds mega-electron-volt (MeV) per nucleon, because this is a crucial milestone on the road towards the laser ion accelerator for applications in hadron therapy BK . Various laser ion acceleration mechanisms have been discussed in theoretical and experimental papers (see review articles MTB ; BFB ; DNP ; MBP and literature cited therein).
Apparently the maximum ion energy increases with the laser focused intensity which is in turn proportional to the laser power. Protons of 60 MeV from 100 m foils irradiated by 400 J subpicosecond laser pulses of a PW class laser system have been detected in Ref. Snavely . With laser pulses under 10 J, the highest proton energy obtained so far is 40 MeV Ogura , for a micron-thick metal foil irradiated by an ultra-short 200 TW femtosecond pulse laser (fs) at an intensity of about W/cm2. A 85 MeV proton generation has been detected with the petawatt laser at APRI-GIST, Korea Jeong .
According to the theoretical concept formulated in Ref. TARA , a femtosecond petawatt class laser pulse focused onto a thin solid density proton-containing target can blow off almost all the electrons creating a Coulomb potential which accelerates protons to the energy of , which scales with the laser power, , as
| (1) |
Here the coefficient is of the order of unity and depends on the laser pulse shape and its energy absorption; GW is proportional to the critical power for relativistic self-focusing GZSUN ; and are the electron charge and mass; is the speed of light in vacuum. The laser radiation with the power of focused into a spot with the diameter of the laser wavelength, , produces the intensity of W/cmm and the corresponding electric field of reaching the relativistic limit MTB . In terms of the dimensionless amplitude, , where is the laser frequency and is the focused intensity, the relativistic limit is . The relationship in Eq. (1) shows that the 200 MeV proton energy can be achieved with PW laser power on the target.
A femtosecond petawatt laser pulse (the main pulse) obtained with the present-day laser technology MTB is typically accompanied by a relatively low-energy nanosecond prepulse which is a combination of sub-picosecond pulses, a picosecond ramp and nanosecond amplified spontaneous emission (ASE). The prepulse heats, melts and evaporates a portion of an initially solid density target creating a preplasma at the target front on the timescale of nanoseconds. The main pulse then interacts with the preplasma before it can reach the solid density region. These effects can substantially modify the laser – thin solid target interaction (e.g., see experimental and theoretical results on the ion acceleration in Refs. MATSU ; YOGO , where the prepulse transforms a micron foil into a finite thickness near-critical plasma layer, and in Ref. WANG , where a low-contrast of a 3 TW main pulse impedes ion acceleration). Research into optimization of the prepulse for picosecond laser-irradiation of thin foil targets has been previously performed MCKENNA .
A fast depletion of the main pulse propagating in preplasma can diminish the ion acceleration efficiency. However the main pulse also undergoes relativistic self-focusing which increases its intensity and decreases the volume of the laser field immediate interaction (tightening the pulse waist). A mutual counteraction of these effects can lead to the enhancement of ion acceleration efficiency, as we show below.
In this paper we investigate how the prepulse modifies the interaction of petawatt class laser with thin solid targets. We find optimal conditions for the ion acceleration and reveal accompanying effects which are useful for diagnostics in experimental searches for the optimal regimes.
In order to accomplish this task, we performed two kinds of numerical simulations strongly separated by the timescale. The study of the interaction of a nanosecond sub-mJ prepulse with a micron foil has required simulations using dissipative hydrodynamic algorithms described in Refs. UTSUMI ; NAGATOMO ; SUNAHARA ; OHNISHI . The interaction of a femtosecond several joule main pulse with preplasma modelled following dissipative hydrodynamics simulations have been studied with multi-parametric particle-in-cell (PIC) simulations similarly to Refs. MATSU ; TZE .
In the present paper we briefly review the ion acceleration mechanisms in Sec. II; describe typical parameters of the laser pulse components in Sec. III; formulate a simple analytical model for preplasma formation and ion acceleration in Sec. IV; present dissipative hydrodynamic simulation results in Sec. V; summarize the multi-parametric PIC simulation results in Sec. VI; discuss the outcomes and conclude in Sec. VII.
II Ion Acceleration Mechanisms
Several basic laser ion acceleration mechanisms have been established, depending on the laser pulse and target parameters. They can be categorized into several groups.
The most actively studied regime so far is Target Normal Sheath Acceleration (TNSA) TNSA . TNSA is realized, when a low contrast laser pulse interacts with a thick solid density slab target. This implies that a portion of the laser-heated electrons leave the target in the forward direction with respect to the laser pulse propagation and establish a longitudinal electric field at the target rear surface. In the quasistatic limit the ion energy is determined by the electrostatic potential there. In the dynamical regime not only hot electrons leave the target but also a plasma cloud formed at the target rear side expands into vacuum. The fast ions are accelerated at the front of the expanding plasma cloud Gurevich-P-Pitaevsky . The resulting ion beam has a broad quasi-thermal energy spectrum with a cut-off. Most of the experimental results on laser proton acceleration obtained so far, including the above mentioned 40 MeV proton acceleration seen in Ref. Ogura , can be attributed to the TNSA scheme.
A high contrast strong enough laser pulse can push away all the electrons from a thin or mass limited solid density target in a time shorter than the ion response time. Then ions undergo a Coulomb explosion due to the repulsion of the positive electric charge LAST . The resulting ion beam has a nonthermal energy distribution with a cutoff at the energy determined by the maximum of the electrostatic potential of the ion core. The ion energy scaling given by Eq. (1) corresponds to this regime, and can be realized when the laser pulse irradiates a thin double layer target (consisting of high-Z layer and a much thinner proton-containing layer). In the Coulomb explosion of high-Z layer, protons acquire the highest energy. The double layer target can secure obtaining high-quality (quasi-monoenergetic and low-emittance) ion beams, BK ; TARA ; DoubleLayer ; TZE . The proton-containing layer can be prepared in a controllable way as in Ref. SCHW or can be a water contamination layer usually present on metal foils.
Radiation Pressure Dominated Acceleration RPDA , comes into play when the laser is able to push the foil as a whole by the electromagnetic radiation pressure. This mechanism is a realization of the relativistic receding mirror concept UFN . The laser pulse is reflected by a co-moving mirror with its energy transferred to the mirror. Recently, several papers have reported on the experimental indication of the onset of this regime of laser ion acceleration, KAR . The transition from the TNSA to the RPDA regime has been observed in the PW class laser beam interaction with nanoscale solid foil targets, when 45 MeV protons have been detected IJKim .
The Magnetic Vortex Acceleration MVA regime occurs when the laser interacts with a near-critical density target, where it makes a channel in both electron and ion density. Exiting from the plasma the laser pulse establishes a strong longitudinal electric field sustained by a quasistatic magnetic field associated with the vortex motion of electrons. This electric field accelerates the ions. In the case of sub-picosecond pulses the acceleration of helium ions up to 40 MeV from underdense plasma by the VULCAN laser WIL1 and the acceleration of protons up to 50 MeV by the Omega EP laser WIL2 have been observed. Also experiments with femtosecond pulses irradiating cluster jet targets show that 10-20 MeV per nucleon ions can be generated Fukuda .
A combination of the basic laser ion acceleration mechanisms can enhance the maximum ion energy, or increase the number of accelerated ions, or modify the ion beam spectrum. For example, the accelerated ion energy can be substantially increased with the Directed Coulomb Explosion scheme Stepan-DC , which is the combination of Radiation Pressure Acceleration and Coulomb Explosion mechanisms. Another example can be found in MORITA .
Target micro- (and nano-) structuring can enhance the laser pulse coupling with the target DM ; SK and improve the accelerated ion beam quality BK ; TARA ; DoubleLayer ; SCHW .
In the case when the laser radiation interacts with an undercritical density target the ponderomotive pressure of a wide enough laser pulse launches a collisionless shock wave propagating in the forward direction. The ions reflected at the shock wave front acquire a velocity twice the velocity of the shock, producing a narrow energy spectrum ion beam SHOCK . The accelerated ion beam interacting with the background plasma becomes subject to two-stream and filamentation instabilities SLOW , the latter determines the width of the accelerated ion spectra.
III Parameters of the Main Pulse, Prepulse and Amplified Spontaneous Emission
In the analysis of the laser – thin solid target interaction we consider laser pulses of the petawatt class. As can be inferred from experimental and theoretical results mentioned in previous sections, such the power and the focused intensity of W/cm are required for the laser-driven generation of hundreds of MeV ions. We consider the laser pulse energy, , of the order of tens of joules, which entails the main pulse duration, , of the order of tens of femtoseconds.
As an example of a typical structure of a petawatt class laser pulse, in Fig. 1 we show the time dependence of the pulse power for the J-KAREN laser KIRIYAMA2012 used in Ref. Ogura . The main pulse containing the main part of the energy has the duration of fs. It is preceeded by radiation with much less power, which we call the prepulse, with the duration of the order of ns and total energy, , less than mJ. The main components of this long timescale radiation are the nanosecond amplified spontaneous emission (ASE) and a few picosecond ramp. The peaks in Fig. 1 a few tens and hundreds of ps before the main pulse originate from post-pulse transfer to prepulse due to self-phase modulation at the chirped stage of the CPA amplifier chain DIDENKO . Some of these peaks can also be artifacts generated in the cross-correlator. The few picosecond ramp originates from the high-order phase modulations determined by high-order dispersion terms.
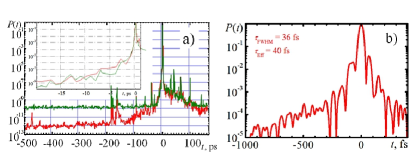
The laser pulse contrast in terms of energy is characterized by the ratio of the main pulse to the prepulse energy,
| (2) |
which we consider in the range from to . We introduce also the intensity contrast equal to the ratio of the main pulse to the prepulse intensity,
| (3) |
When the main pulse intensity is W/cm2, the intensity contrast is for the prepulse intensity of W/cm2, and is for W/cm2.
We note that the preplasma formation has been studied in Ref. SAGISAKA experimentally and via hydrodynamics simulations for a few orders of magnitude lower laser energy.
IV Simple Model for Preplasma Formation and Ion Acceleration
IV.1 Simple model for preplasma formation
When laser radiation interacts with a solid target, the prepulse produces an extended preplasma. The key parameters of the preplasma are the electron temperature, plasma density and the expansion velocity, and the preplasma spatial scale.
The electron temperature, , grows due to collisional heating of the plasma undergoing irradiation by the laser prepulse field, , oscillating with frequency . The minimal electron temperature can be estimated to be equal to the quiver electron energy:
| (4) |
where is the prepulse intensity contrast determined by Eq. (3), and is the dimensionless amplitude of the main pulse.
In a collisional plasma the electron temperature growth is determined by equation RAIZER
| (5) |
with the collision frequency, , which depends on the electron temperature as . For an electron density and temperature of the order of cm-3 and eV, the collision frequency is s-1. Table 1 shows the collision frequency value for different values of the electron density and temperature.
| [s-1] | |||
|---|---|---|---|
In the long time limit, , Eq. (5) yields
| (6) |
For , from Eq. (5) we have , where the time period is in seconds and the unit of is eV/;
| (7) |
As seen from Table 1, presenting the collision frequency in a wide range of the electron density and temperature, for a nanosecond prepulse we are in the regime of .
In Table 2 we present the electron temperature for different values of the main pulse amplitude and contrast , for a nanosecond prepulse and the electron density of cm-3.
| [eV] | |||
|---|---|---|---|
| 10 | 370 | 130 | 50 |
| 40 | 1270 | 450 | 160 |
| 100 | 3000 | 1000 | 370 |
Fig. 2 shows a schematic distribution of the electron density and temperature in the target modified by the prepulse. The remaining portion of the foil with a high density, plateau, is surrounded by a relatively low density preplasma at the front and a skirt at the rear.
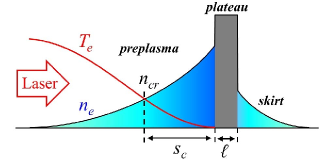
The prepulse energy is absorbed mainly in the region close to the critical density surface, , where . This causes the electron heating with the heat transport due thermal conductivity towards the overcritical density region, the ion heating and the preplasma expansion. A part of the absorbed energy is radiated away due to radiation losses. One can find a similarity between this scenario and physical processes which occur during nanosecond laser radiation interaction with solid targets Bodner ; Lindl .
Now we estimate the “cost” of the preplasma formation, , considering the energy balance with the prepulse energy . We write it in the form of a sum
| (9) |
where and are the total number of electrons and ions in the preplasma; and are the electron and ion temperature; is the ionization “cost” approximately equal to twice the ionization potential; is the ion kinetic energy, and is the energy radiated away. The energy is equal to the absorbed prepulse energy
| (10) |
where is the absorption coefficient.
Assuming the absorption coefficient to be of the order of 0.3 and the prepulse energy of eV we find that for the electron temperature of the order of 300 eV, the total electron number in the preplasma is . Since these electrons originate from the foil with the solid density, cm-3, for the laser focal spot radius of m, the foil cannot be thinner than
| (11) |
The velocity of the preplasma expansion is equal to the ion acoustic velocity, In the case of fully ionized aluminium, , , we obtain cm/s for the electron temperature of eV. During one nanosecond the preplasma expands over the distance of m . The critical surface is located at the distance of m from the remaining portion of the foil, assuming an exponential profile which is a typical case.
IV.2 Ion acceleration in preplasma
When a laser pulse of femtosecond duration and of a petawatt level of power (the main pulse) propagates through the preplasma, it undergoes two principal processes which determine its evolution and, finally, the parameters of electromagnetic radiation reaching the solid density foil and accelerating the ions. The first process which we take into account is the main pulse energy depletion due to the laser energy transformation to the energy of fast electrons and ions. The second process is the self-focusing instability.
It is easy to obtain that the energy balance condition yields for the depletion length, , of a relatively narrow laser pulse:
| (12) |
Here and are the laser pulse length and dimensionless amplitude, respectively.
The laser pulse amplitude for given laser power found from the self-focusing channel width is equal to SF-a-P
| (13) |
Here GW is the critical power of the relativistic self-focusing GZSUN . A laser pulse of the power PW has the amplitude equal to which corresponds to the radiation intensity of the order of W/cm2. Combining relationships (12) and (13) we obtain that the length of the laser energy depletion in the near-critical density plasma is
| (14) |
If the laser pulse has a length m and power PW, the energy depletion length for according to Eq. (14) is approximately equal to m. As we see, for the preplasma not thicker than m, the femtosecond PW power main pulse can deliver a substantial part of its energy to the remaining portion of the foil, while the pulse amplitude is . In this case, for a sufficiently thin remaining portion of the foil, the ions can be accelerated by the laser radiation pressure in the Radiation Pressure Dominated Acceleration (RPDA) regime RPDA ; KAR .
The key parameter characterizing the RPDA mechanism is the laser pulse fluence,
| (15) |
written in the normalized form with , where is the position of the foil remaining portion. Below we shall use the total fluence .
According to Refs. RPDA ; COMRE (see also Ref. KLIMO ; APLR ) in the nonrelativistic limit (), the maximum energy of ions accelerated in the RPDA regime scales as
| (16) |
According to the definition of the total fluence, Eq. (15) for , the total number of accelerated ions, , is related to the laser pulse energy as
| (17) |
Then the acceleration efficiency is proportional to the normalized total fluence
| (18) |
Using these relationships we obtain that in order to generate protons per second with the energy of MeV, one requires a 1 Hz laser with the pulse energy of J. For a 30 fs laser pulse duration this corresponds to the laser power of about 1 PW. The acceleration efficiency in this case is .
The required thickness of the foil remaining portion, , or, more precisely, its surface density is determined by the condition of target opaqueness RPDA ; MACCHI ; UNLIM ; OPTIM , necessary for RPDA:
| (19) |
The dimensionless parameter has been introduced in Ref. Vshivkov . If a PW laser is focused to a spot with a size of m, i.e. its intensity is about W/cm2, for the fully ionized aluminium solid density, cm-3, the foil remaining portion thickness should be not thinner than the order of nm.
Since one of the most important features of the RPDA acceleration regime is the laminarity of the accelerated ion beams, by using laser pulses with a super-Gaussian transverse profile and narrow aperture collimators for ions, one can obtain a narrow energy spectrum ion beam.
V Hydrodynamic Modelling of the Preplasma Formation
We have run several hydrodynamic simulations all giving similar features UTSUMI ; SUNAHARA ; OHNISHI . In order to simulate the interaction of the prepulse with the solid target we have chosen results from the two-dimensional Arbitrary Lagrangian Eulerian (ALE) radiation hydrodynamics code STAR2D as a representative result SUNAHARA .
V.1 Governing Equations
The governing equations used in the code are SUNAHARA :
| (20) | ||||
| (21) | ||||
| (22) | ||||
| (23) | ||||
| (24) |
where is the velocity, is the mass density, is the total pressure which is the sum of the electron pressure and ion pressure , is the artificial viscosity used for regularization of the shock wave fronts RICHTMYER , , , and are the ion and electron temperature, respectively, and are the specific ion heat and electron heat, respectively, and are the ion and electron conductivities, respectively, including the flux-limited Spitzer-Harm model. The term incorporates electron-ion temperature relaxation where is determined from the Spitzer relaxation time, is the source term from laser heating of electrons where the laser absorption process is assumed to be inverse-bremsstrahlung and the laser propagation is calculated by ray-tracing, is the heating term due to radiation. In the radiation transport equation, Eq. (24), is the photon energy density at energy , is the x-ray propagation direction, is the emissivity, is the attenuation coefficient, and is a diffusion coefficient defined by . More details can be found in SUNAHARA . The equations of state (EOS) used in Eqs. (21),(22), and (23) are that of Ref. RAY . Details and advantages of using this EOS versus other EOS’ will be presented elsewhere.
V.2 Parameters and Results
We model the prepulse as a square pulse of duration 3 ns and transverse Gaussian profile with a wavelength of 1.06m. The peak intensity on target is W/cm2. The full width at half maximum (FWHM) focus spot size is taken to be 2 m. We get the prepulse energy of J. Taking the main pulse energy to be 20 J the energy contrast, defined by Eq. 2, is .
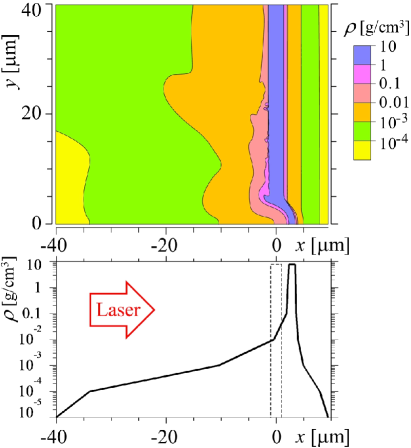
Assuming that the main pulse is Gaussian and has the FWHM duration of 30 fs with respect to intensity, the intensity contrast, defined by Eq. 3, is . The target material is iron with a thickness of 2 m and the initial density of 7.8 g/cm3. The simulation box size is 80 m in the laser propagation direction and 60 m in the transverse direction. In Fig. 3 the laser is propagating from the left to the right perpendicular to the target.
Figure 3 shows the density of the iron target near the laser spot after being irradiated for 3 ns by the prepulse. It can be seen that the target has become curved away from the direction of the laser propagation. The target has moved approximately 3.3 m from its initial position. The portion of the target where the prepulse intensity is greatest has thinned relative to its initial 2 m thickness.
VI Multiparametric Particle-In-Cell Simulations of the Ion Acceleration
Using the results of dissipative hydrodynamic simulations here we investigate the interaction of the high intensity femtosecond portion of the laser pulse (the main pulse) with the Al (aluminum) foil modified by the low intensity nanosecond portion (the prepulse). We search for the dependence of the maximum ion energy on the laser beam and target properties.
VI.1 Plasma profile
As we saw in the previous section, when a metallic foil is irradiated by a prepulse, a portion of the foil evaporates forming a preplasma, Fig 2, while the remaining portion with a flat-top profile (plateau) is bent due to a recoil with the transverse scale of the order of the laser pulse spot size, Fig. 3. On the back side of the foil a relatively thin and low density plasma layer (skirt) is formed.
A sufficiently thin foil can be completely disintegrated. While there are several mechanisms of ion acceleration by intense femtosecond pulses in underdense or near-critical plasma MVA ; MATSU ; YOGO ; Fukuda , here we consider the case where a significant portion of the foil has a solid density at the arrival of the main pulse which may provide conditions for the RPDA and directed-Coulomb explosion regimes.
Our hydrodynamics simulations for micron-thick foils show that the profiles of the preplasma and skirt are nearly exponential up to the critical density, while the critical surface (for the resulting maximum ionization state) is not farther than a few microns away from the plateau. Assuming a typical shape of the preplasma and varying its scale one can cover a wide range of possible preplasma profiles without a loss of qualitative fitness of the results. We model the plasma (electron) density by the formulae
| (25) | ||||
| (26) | ||||
| (27) | ||||
| (28) |
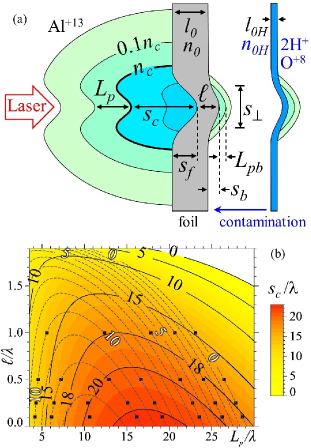
where is the Heaviside step function, for and for . The resulting density profile is shown in Fig. 4(a). The unperturbed part of the foil with the (electron) density occupies the interval of for , where is the initial foil thickness. The remaining portion of the foil, plateau, occupies the interval of for , where the function and parameters , and describe bending. The plateau (minimum) thickness is , . The preplasma with the maximum (electron) density of is characterized by the scale-length , the distance at which the plasma density drops 10 times. The skirt at the back side of the foil has a longitudinal and transverse scale-length of and , respectively. Its maximum (electron) density is assumed to be equal to the critical density, , for the maximum ionization state resulting from the hydrodynamic simulations.
We also model water contamination usually present at the back side of the foil. This additional layer with the thickness of (typically 10 nm) is adjacent to the back side of the foil. Its density is a combination of the flat-top profile Eq. (27) and the exponential profile Eq. (26), in the same fashion as the skirt density [the last term in Eq.(25), where the first argument is replaced by ]. The longitudinal and transverse scale-length of the exponential profile are the same as for the skirt, i.e. and , respectively. The maximum (electron) density in this layer is .
The number of particles ablated from the foil is equal to the preplasma density integral, neglecting the skirt integral. Assuming rotational symmetry, we have
| (29) | |||
| (30) | |||
| (31) |
where the function can be approximated on the interval by with the relative error of 0.1%. Since , this relation determines for given , and :
| (32) |
We assume that . The amount of ablated material is proportional to and does not depend on , Eq. (30).
The critical surface at which the preplasma (electron) density equals critical density, , is determined by the equation . On the rotational symmetry axis, this reads , where is the distance between the critical surface and the plateau,
| (33) |
We note that the expressions for and do not explicitly depend on the longitudinal shift of the bent foil, described by parameters and .
The electron density obtained from the hydrodynamics simulations typically corresponds to a relatively low degree of ionization of atoms constituting the foil. For example, in the previous section the prepulse with the intensity of W/cm2 produces preplasma with Al+3. For the density of aluminum under the normal conditions, 3 electrons per atom give the electron density about while a full ionization implies , where cm-3, is the classical electron radius. A 10 J, 30 fs main pulse focused to a 3 m spot is strong enough to fully ionize Al atoms, also aided by a collective electrostatic field in the preplasma. Therefore, in the simulations we assume that the plasma is fully ionized. However, for experimental diagnostics it is useful to know the location of the critical surface just after the nanosecond pulse, . It is given by the same formula as Eq. (33), with replaced by the (electron) density corresponding to a lower degree of ionization. For both assumptions the critical surface location is shown in Fig. 4(b).
VI.2 Simulation setup
We use the particle-in-cell (PIC) code REMP in a two-dimensional (2D) configuration for the multi-parametric (MP) study, where several tasks with different sets of initial parameters are simultaneously performed on a supercomputer. The simulation box size is . Boundary conditions are absorbing for electromagnetic field and quasiparticles. The mesh size is . The time step is . The total number of quasi-particles representing electrons, protons and O+8 and Al+13 ions is .
We fix the following parameters of the target, typically observed in hydrodynamic simulations in a wide range of the prepulse parameters. The unpertubed portion of the aluminum foil has the thickness of . Its center is placed at the distance of from the left boundary of the simulation box. Transverse scale of bending is (this is approximately equal to the focal spot size of a laser beam focused by a f/3 system). The foil back side shift (due to bending) is . The skirt has a longitudinal scale-length of , and transverse scale-length of . The water layer thickness is . The plateau (electron) density is , the water layer (electron) density is . The preplasma scale-length, , varies from to . The plateau thickness, , varies from to . The choice of parameters , is shown in Fig. 4(b). We also consider an ideal case where a “clean” femtosecond laser pulse interacts with an unperturbed foil, i. e. formally .
The main pulse is approximated by a Gaussian beam with the wavelength of m, linearly polarized along the -axis. Originating from , it is focused with the f-number of f/3 normally onto the plane at the front surface of the unperturbed foil. In vacuum, its focal spot full-width-at-half-maximum (FWHM) size would be (with respect to intensity). The main pulse duration (FWHM with respect to intensity) is 30 fs . The main pulse energy takes the values of 4 J, 10 J, and 20 J.
The results of the simulations are shown in Figs. 5-17, where the spatial and time units are and fs, respectively, and the electromagnetic field strength is shown in terms of the dimensionless amplitude .

VI.3 Interaction scenarios
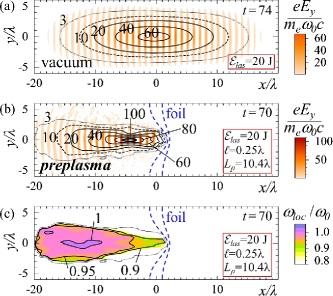
Our simulations reveal typical scenarios of the main pulse evolution in the preplasma. Propagating in the preplasma, the main pulse loses energy creating a channel and piling up a high-density shell. A sufficiently thick preplasma can absorb the main pulse almost completely well before the main pulse reaches the plateau. In this case the ion acceleration is inefficient as we see in our preliminary simulations (not shown here). For a sufficiently small preplasma scale-length, the main pulse reaches the plateau partially reflecting from it and partially penetrating through it. This appears to be the necessary condition for an efficient ion acceleration for the main pulse parameters under consideration. In some cases a self-focusing of the main pulse results in a significant intensification of the pulse and its carrier frequency downshift, as seen in Fig. 5.
VI.4 Ion acceleration in targets with preplasma
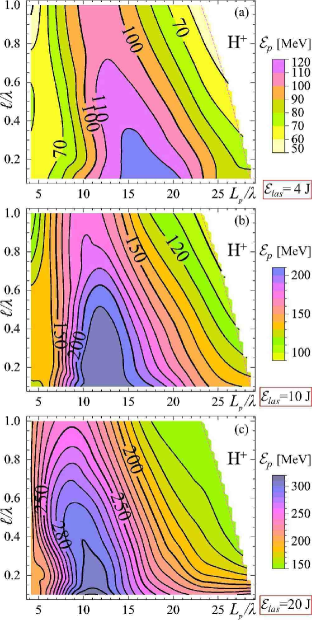
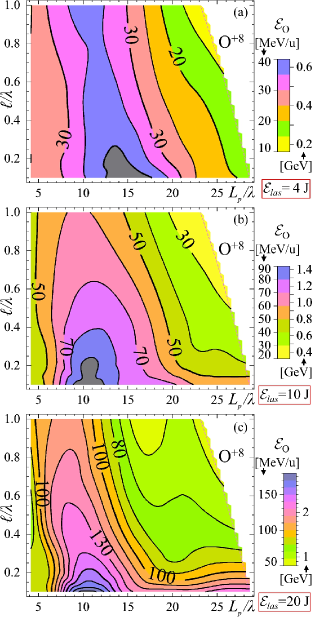
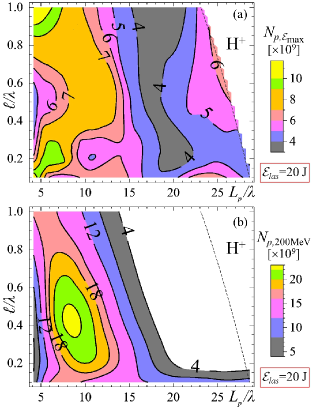
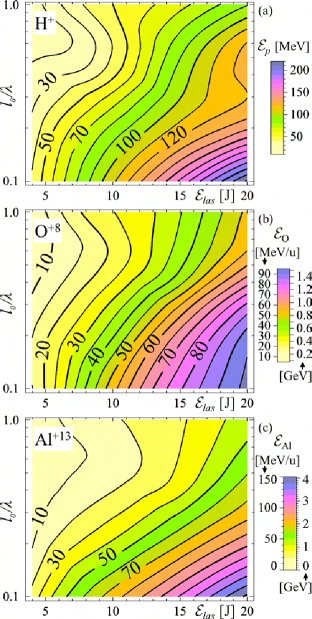
Figs. 6-8 summarize the simulation results in terms of the maximum ion energy per nucleon dependence on the preplasma scale-length and the plateau thickness for different main pulse energies. The maximum ion energy increases with the main pulse energy. For the main pulse energy of 4, 10, and 20 J the maximum proton energy is, respectively, 129, 218, and 322 MeV; in the case of O+8 ions it is 42, 96, and 184 MeV/u; and in the case of Al+13 ions it is 33, 85, and 153 MeV/u. The values were taken at ( laser cycles after the main pulse reaches the focal plane in vacuum). At this time the energy growth for all cases presented is nearly saturated (less than 3% growth in 10 laser cycles). For all three ion species under the fixed main pulse energy there is an optimal preplasma scale-length which affords the highest energy. Surprisingly it roughly corresponds to the maximum distance between the plateau and the critical surface, , Fig. 4(b). For the main pulse energy of 20 J, Fig. 9(a) shows the number of protons with the energy in the interval (here is a function of and , presented in Fig. 6(c)). The number of protons in the 200 MeV beamlet with a 10% energy spread is shown in Fig. 9(b).
Varying the preplasma scale-length and plateau thickness we observe different regimes of ion acceleration.
When the main pulse cannot penetrate a thick preplasma, fast electrons produced by the absorbed laser pulse penetrate through the target, creating a charge separation field at the rear of the target. This field accelerates ions as described by the target normal sheath acceleration (TNSA) mechanism Gurevich-P-Pitaevsky ; TNSA or its generalization on the non-neutral sheath expansion Nishiuchi ; Passoni . The ion acceleration occurs also from the main pulse channel formed inside the preplasma, mostly in the transverse direction Sarkisov , but this results in much lower ion energy than the acceleration at the rear of the target.
When the main pulse reaches the plateau, its intensity and the plateau thickness determine the interaction regime. For intensity much lower than W/cm2, the main pulse causes a Coulomb explosion TARA ; DoubleLayer of the remaining portion of the foil. Near that threshold of intensity, for the plateau thickness much less than , the radiation pressure dominant acceleration (RPDA) comes into play RPDA , assisted by the directed Coulomb explosion Stepan-DC . We note that the mechanisms providing higher ion energy, in principle, are accompanied by other mechanisms, since a higher threshold is reached via all lower thresholds.
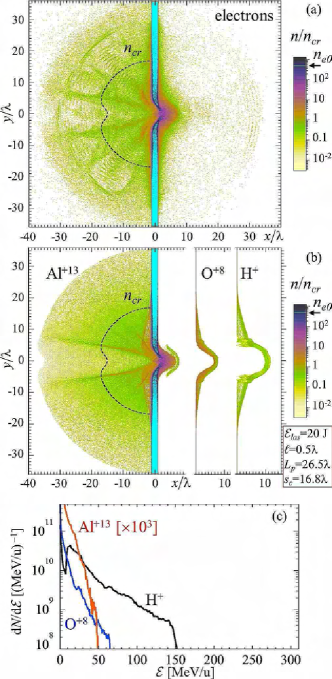
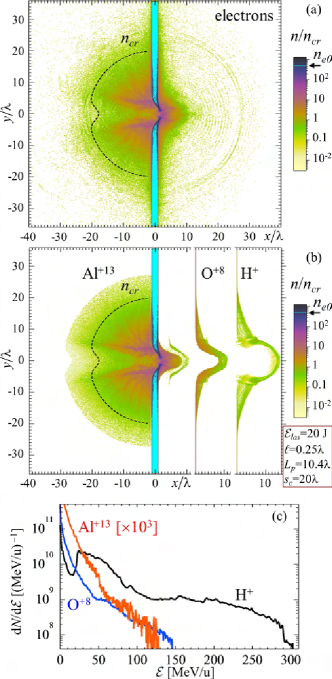
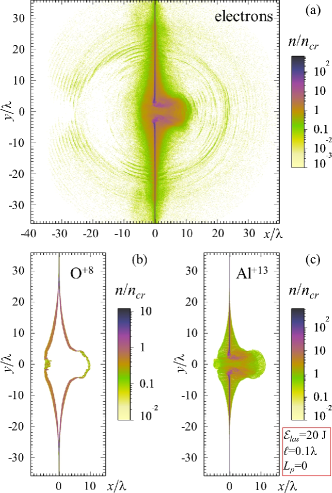
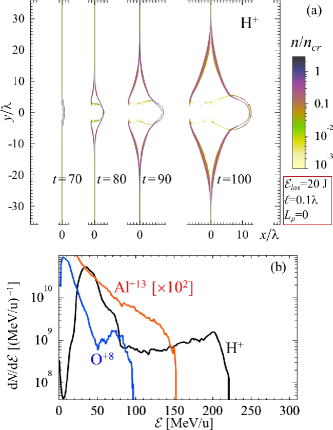
In Figs. 10-11 and Figs. 12-13 we show two cases of the 20 J main pulse interaction with the target, corresponding to Fig. 6(c). The density, fields and frequency spectra are shown at ( laser cycles after the main pulse reaches the focal plane in vacuum), in the active phase of ion acceleration. The ion energy spectra are shown for , when the energy growth is nearly saturated.
In the first case, the plateau thickness is and the preplasma is relatively gently sloped, . The corresponding location of the critical surface is for fully ionized Al+13 or assuming partially ionized Al+3. In the second case, the plateau is two times thinner, and the preplasma is much steeper, ; the critical surface location is for fully ionized Al+13 or assuming partially ionized Al+3. The amount of ablated material in the second case is by % greater than in the first case.
The density distributions, Fig. 10(a,b) and Fig. 12(a,b), reveal that the number the electrons ejected at the distance from the unperturbed foil center () in the interval of is 1.64 times greater in the second case than in the first case; ions are accelerated mostly forward; Al+13 ions from the skirt acquire larger energy than that from the plateau. The ion energy spectra, Fig. 10(c) and Fig. 12(c), show that the ion energy per nucleon is roughly two times greater in the second case than in the first case.
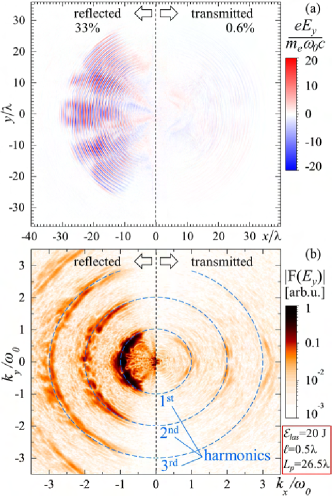
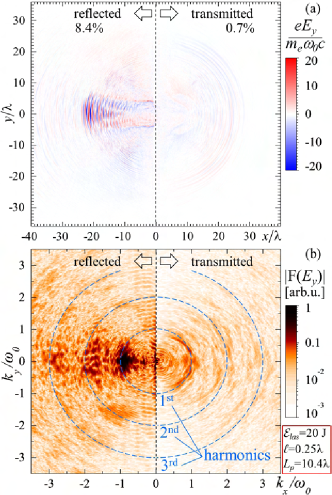
VI.5 Reflection, Absorption, and Frequency Spectrum of Reflected Laser Pulse
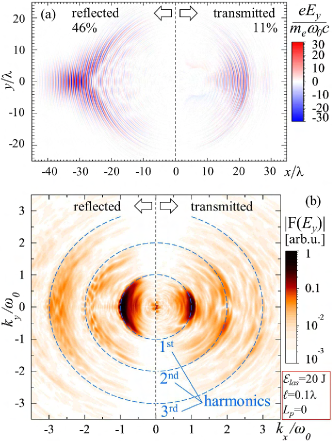
Fig. 11 and Fig. 13 show that in the first case one third of the main pulse energy is reflected in the form of several beams propagating at different angles, while in the second case the beam is 91% absorbed and 8.4% portion is reflected mainly backward. In both cases less than 1% is transmitted through the target. Both the reflected and transmitted radiation is enriched with high-order harmonics, Fig. 11(b) and Fig. 13(b). However, in the second case, producing greater ion energy, the spectrum is much more blurred and noisy. A small downshift of the reflected base frequency and harmonics is noticeable in the second case, Fig. 13(b). It is % with respect to the carrier frequency decreased to , seen in Fig. 5(c). This indicates the onset of the RPDA mechanism of the ion acceleration, RPDA . The accelerating plasma partially reflects the incident radiation decreasing its frequency due to the Doppler effect. The downshift corresponds to the velocity of , and the energy of 0.77 MeV for protons and of 21 MeV for Al ions.
VI.6 Ion acceleration in “clean” targets
For the sake of comparison we consider here the case of a target without a preplasma (formally ). This corresponds to an ideally “clean” laser pulse incident on an unperturbed foil. The target consists of three layers: aluminum in the middle and thick water contaminants on both sides. We assume that all ions are fully ionized as in the analysis above. The main pulse energy takes the values of 4, 10, 15, 20 J; the foil thickness runs through 0.1, 0.25, 0.5, 1.
Fig. 14 shows the maximum energy of ions as a function of the main pulse energy, , and the foil thickness, . For the same main pulse energy and foil thickness, , presented in Figs. 6-8, a “clean” target produces substantially less energetic ions. The greatest value is reached for the 20 J main pulse and thick foil; for this particular case the density distributions, ion energy spectra, quasistatic fields, and transverse electric field and its frequency spectrum are shown in Figs. 15-17.
The main pulse partially penetrates through the target and undergoes partial reflection, Fig. 17(a), boring a hole in the target, Fig. 15(a). The Al+13 ions pushed by the main pulse radiation pressure are accelerated further by a Coulomb explosion, Fig. 15(c). The protons from the rear of the foil are also pushed by the radiation pressure and a slowly moving electric potential of the exploding Al layer, Fig. 16(a). Surprisingly, the protons from the front side of the foil are accelerated even more efficiently, since they overcome the protons from the back side of the foil. The evolving front proton layer develops a “cocoon” shape, characteristic for RPDA. Fig. 16(b) shows the ion energy spectra. The maximum energy of O+8 ions appears to be less than that of Al+13 ions. Seen for and J this effect is the result of a fast redistribution of ions during the course of the interaction.
The amount of radiation transmitted through the target is much greater than in the case of the target with a preplasma, Fig. 17. A well pronounced steepening of the main pulse profile transmitted through the thin foil, Fig. 17(a, right), is the result of the relativistic transparency, Vshivkov . A noticeable frequency downshift by % due to the Doppler effect is seen in the reflected radiation, Fig. 17(b, left), while the transmitted radiation base frequency and harmonics are not shifted, Fig. 17(b, right). This “red” shift corresponds to the velocity of , 0.45 MeV for protons and 12 MeV for Al ions.
VI.7 Summary for PIC simulations
For the efficient acceleration of ions the preplasma must be sufficiently thin in order to allow the main pulse to reach the remaining portion of the foil (plateau). The most efficient acceleration in terms of the maximum ion energy occurs when the preplasma scale-length is optimal and the plateau is thin enough. In this case, due to the self-focusing of the main pulse despite its depletion, the radiation intensity becomes high enough to make the plateau relativistically transparent Vshivkov and to render radiation pressure dominant acceleration RPDA .
In order to formulate optimal conditions for the experimental realization of the ion acceleration we should take into account that in experiments it is difficult to control conditions of the preplasma and the thickness of the remaining portion of the foil. The process of the preplasma formation is determined by relatively low-intensity portions of the laser pulse which, in general, are not sufficiently stable for ensuring reproducibility of the target condition at a time when the main laser pulse arrives. Since thinner targets can be completely destroyed by the prepulse without producing the desired ion beam, it is safer to use foils with initial thickness of the order of microns. Restricting the prepulse intensity and duration so that the resulting preplasma is not thicker than 20 m, one can obtain 100 MeV protons with 4 J laser pulse, 150 MeV with 10 J pulse, and 200 MeV with 20 J pulse, Fig. 6.
The maximum ion energy and the interaction scenario correlate with the properties of the main pulse reflection, transition and absorption. The information on the reflected and transmitted radiation energy and spectra can be relatively easily measured in experiments, Pirozhkov-absorption ; Streeter-2nd-order-harmonic . This can help to optimize the laser and target parameters during experiments.
VII Discussion and Conclusions
In this paper we investigate the role of a low-intensity prepulse accompanying the main pulse of a petawatt class laser focused onto thin solid targets, with respect to the laser-driven ion acceleration. The major constituent of the prepulse is a nanosecond amplified spontaneous emission. The prepulse heats, melts and evaporates a portion of an initially solid density target creating an extended preplasma at the target front. The preplasma scale-length is estimated using a simple analytical model and its typical profile is found with dissipative hydrodynamic simulations.
The main pulse propagating in the preplasma undergoes fast depletion transferring its energy to the energy of fast electrons. A relatively thick preplasma can substantially absorb the main pulse. Contrary to an intuitive expectation that such preplasma hinders the ion acceleration due to the main pulse depletion, our analytical model predicts that in a preplasma with an optimal thickness the femtosecond main pulse can reach the remaining portion of the target and produce the radiation pressure dominant acceleration regime of ions. This is in part due to the relativistic self-focusing of the main pulse and the resultant increase of its intensity. Our multi-parametric PIC simulations demonstrate this possibility and show that by optimizing the preplasma scale-length one can substantially enhance the laser-driven ion energy as compared with the case of a “clean” laser pulse (without a prepulse) irradiating a “clean” target (without a preplasma).
Having petawatt class lasers with a “clean” laser pulse could allow more control, since a second lower intensity laser pulse arriving before the main pulse could be used to create the optimum preplasma.
The maximum ion energy and other features of the laser-target interaction correlate with the regimes of the main pulse absorption, reflection, and transition, including high-order harmonic generation. The analysis of the reflected and transmitted radiation energy and spectra is an important diagnostic tool in experimental searches for the optimal regimes of the ion acceleration.
Our results show that the ion acceleration to a few hundred MeV per nucleon is achievable with petawatt class lasers having a finite contrast.
Acknowledgments
We thank G. Korn, D. Margarone, T. M. Jeong for fruitful discussions. We acknowledge support of this work from MEXT and JSPS. This work was partially supported by the joint research project of the Institute of Laser Engineering, Osaka University (under contract subject 2013B1-39).
References
- (1) G. A. Mourou, T. Tajima, and S. V. Bulanov, Rev. Mod. Phys. 78, 309 (2006).
- (2) F. Krausz and M. Ivanov, Rev. Mod. Phys. 81, 163 (2009).
- (3) E. Esarey, C. B. Schroeder, and W. P. Leemans, Rev. Mod. Phys. 81, 1229 (2009).
- (4) S. Corde, et al., Rev. Mod. Phys. 85, 1 (2013).
- (5) S. V. Bulanov, et al., Physics – Uspekhi 56, 429 (2013).
- (6) U. Teubner and P. Gibbon, Rev. Mod. Phys. 81, 445 (2009)
- (7) S. V. Bulanov and V. S. Khoroshkov, Plasma Phys. Rep. 28, 453 (2002).
- (8) M. Borghesi, et al., Fusion Sci. Technol. 49, 412 (2006).
- (9) H. Daido, M. Nishiuchi, and A. S. Pirozhkov, Rep. Prog. Phys. 75, 056401 (2012).
- (10) A. Macchi, M. Borghesi, and M. Passoni, Rev. Mod. Phys. 85, 751 (2013).
- (11) R. A. Snavely, et al., Phys. Rev. Lett. 85, 2945 (2000).
- (12) K. Ogura, et al., Opt. Lett. 37, 2868 (2012).
- (13) T. M. Jeong (Advanced Photonics Research Institute, Gwangju Institute of Science and Technology, Korea), private communication (2013).
- (14) S. V. Bulanov, et al., AIP Conf. Proc. 740, 414 (2004).
- (15) G. Z. Sun, et al., Phys. Fluids 30, 526 (1987).
- (16) K. Matsukado, et al., Phys. Rev. Lett. 91, 215001 (2003).
- (17) P. McKenna, et al., Laser and Particle Beams 26, 591 (2008).
- (18) N. V. Didenko, et al., Opt. Exp. 16, 3178 (2008).
- (19) A. Yogo, et al., Phys. Rev. E 77, 016401 (2008).
- (20) W. P. Wang, et al., Appl. Phys. Lett. 102, 224101 (2013).
- (21) T. Utsumi, et al., Applied Physics A 79, 1185 (2004).
- (22) H. Nagatomo, et al., Phys. Plasmas 14, 056303 (2007).
- (23) N. Ohnishi, High Energy Density Physics 8, 341 (2012).
- (24) A. Sunahara and K. A. Tanaka, Fus. Eng. Des. 85 935 (2010); A. Sunahara, et al., Laser and Particle Beams 30 95 (2012).
- (25) R.D. Richtmyer, K.W. Morton, Difference Methods for Initial Value Problems, (Interscience, New York, 1976).
- (26) T. Zh. Esirkepov, M. Yamagiwa, and T. Tajima, Phys. Rev. Lett. 96, 105001 (2006).
- (27) S. C. Wilks, et al., Phys. Plasmas 8, 542 (2001).
- (28) A.V. Gurevich, L.V. Pariiskaya, and L.P. Pitaevskii, Sov. Phys. JETP 22, 449 (1966).
- (29) I. Last, I. Schek, and J. Jortner, J. Chem. Phys. 107, 6685 (1997); K. Nishihara, et al., NIMA 464, 98 (2001).
- (30) S. V. Bulanov, et al., Phys. Lett. A 299, 240 (2002). T. Zh. Esirkepov, et al., Phys. Rev. Lett. 89, 175003 (2002).
- (31) H. Schwoerer, et al., Nature,( London) 439, 445 (2006).
- (32) S. V. Bulanov, et al., Plasma Phys. Rep. 30, 221 (2004); T. Esirkepov, et al., Phys. Rev. Lett. 92, (2004) 175003.
- (33) S. Kar, et al., Phys. Rev. Lett. 100, 225004 (2008); K. U. Akli, et al., Phys. Rev. Lett. 100, 165002 (2008); A. Henig, et al., Phys. Rev. Lett. 103, 245003 (2009); C. A. J. Palmer, et al., Phys. Rev. Lett. 106, 014801 (2011); S. Kar, et al., Phys. Rev. Lett. 109, 185006 (2012).
- (34) I. J. Kim, et al., 2013arXiv1304.0333J (2013).
- (35) A. V. Kuznetsov, et al., Plasma Phys. Rep. 27, 211 (2001); S. V. Bulanov and T. Z. Esirkepov Phys. Rev. Lett. 98, 049503 (2007).
- (36) L. Willingale, et al., Phys. Rev. Lett. 96, 245002 (2006).
- (37) L. Willingale, et al., Phys. Plasmas 18, 056706 (2011).
- (38) Y. Fukuda et al., Phys. Rev. Lett. 103, 165002 (2009).
- (39) S. S. Bulanov, et al., Phys. Rev. E 78, 026412 (2008); S. S. Bulanov, et al., Med. Phys. 35, 1770 (2008).
- (40) T. Morita, et al., Phys. Rev. Lett. 100, 145001 (2008); T. Morita, et al., Plasma Physics and Controlled Fusion 51, 024002 (2009).
- (41) D. Margarone, et al., Phys. Rev. Lett. 109, 234801 (2012).
- (42) O. Klimo, et al., New J. Phys. 13, 053028 (2011); S. Kawata, et al., arXiv:1307.0281 [physics.plasm-ph] (2013).
- (43) D. Haberberger, et al., Nature Phys. 8, 95 (2012); F. Fiuza, et al., Phys. Rev. Lett. 109, 215001 (2012).
- (44) S. V. Bulanov, et al., Phys. Plasmas 19, 103105 (2012).
- (45) H. Kiriyama, et al., Opt. Lett. 37, 3363-65 (2012).
- (46) A. Sagisaka, et al., J. Plas. Phys. 75, 609 (2009).
- (47) Yu. P. Raizer, Laser-induced discharge phenomena (Plenum Pub. Corp., N.Y., 1977).
- (48) S. E. Bodner, et al., Phys. Plasmas 5, 1901 (1998).
- (49) J. D. Lindl, et al., Phys. Plasmas 11, 339 (2004).
- (50) S. S. Bulanov, et al., Phys. Plasmas 17, 043105 (2010).
- (51) S. V. Bulanov, et al., Comptes Rendus Physique 10, 216 (2009).
- (52) O. Klimo, et al., Phys. Rev. ST Accel. Beams 11, 031301 (2008).
- (53) A. P. L. Robinson, et al., New J. Phys. 10, 013021 (2008).
- (54) A. Macchi, S. Veghini, and F. Pegoraro, Phys. Rev. Lett. 103, 085003 (2009).
- (55) S. V. Bulanov, et al., Phys. Rev. Lett. 104, 135003 (2010); S. V. Bulanov, et al., Phys. Plasmas 17, 063102 (2010).
- (56) S. S. Bulanov, et al., Phys. Plasmas 19, 093112 (2012).
- (57) V. A. Vshivkov, et al., Phys. Plasmas 5, 2727 (1998).
- (58) A. Ray, et al., Laser and Particle Beams 24 437 (2006).
- (59) M. Nishiuchi, et al., Physics Letters A 357, 339 (2006).
- (60) M. Passoni, et al., Phys. Rev. Lett. 101, 115001 (2008).
- (61) G. S. Sarkisov, et al., Phys. Rev. E 59, 7042 (1999).
- (62) A. S. Pirozhkov, et. al., Applied Phys. Lett. 94, 241102 (2009).
- (63) M. J. V. Streeter, et. al., New J. of Physics 13, 023041 (2011).