Short GRB 130603B: Discovery of a jet break in the optical and radio afterglows, and a mysterious late-time X-ray excess
Abstract
We present radio, optical/NIR, and X-ray observations of the afterglow of the short-duration GRB 130603B, and uncover a break in the radio and optical bands at d after the burst, best explained as a jet break with an inferred jet opening angle of . GRB 130603B is only the third short GRB with a radio afterglow detection to date, and the first time that a jet break is evident in the radio band. We model the temporal evolution of the spectral energy distribution to determine the burst explosion properties and find an isotropic-equivalent kinetic energy of erg and a circumburst density of cm-3. From the inferred opening angle of GRB 130603B, we calculate beaming-corrected energies of erg and erg. Along with previous measurements and lower limits we find a median opening angle of . Using the all-sky observed rate of Gpc-3 yr-1, this implies a true short GRB rate of yr-1 within 200 Mpc, the Advanced LIGO/VIRGO sensitivity range for neutron star binary mergers. Finally, we uncover evidence for significant excess emission in the X-ray afterglow of GRB 130603B at d and conclude that the additional energy component could be due to fall-back accretion or spin-down energy from a magnetar formed following the merger.
1. Introduction
The broad-band afterglows of short-duration gamma-ray bursts (GRBs; sec; Kouveliotou et al. 1993) provide a unique opportunity to study the basic properties of these events: their energetics, circumburst densities, and jet opening angles. While the energy scales and densities provide fundamental insight to the explosion physics and progenitors, the geometry provides direct information on the population’s true energy scale and event rate. The most likely progenitors, neutron star-neutron star (NS-NS) and/or neutron star-black hole (NS-BH) mergers (Eichler et al. 1989; Narayan et al. 1992; Fong et al. 2010; Berger 2010; Fong & Berger 2013), are the premier candidates of gravitational waves for Advanced LIGO/VIRGO. Thus, an inference on the opening angle distribution will aid our expectations for coincident electromagnetic-gravitational wave detections.
Over the past years, the Swift satellite (Gehrels et al. 2004) has discovered short GRBs, with a median -ray fluence of erg cm-2 ( keV; Gehrels et al. 2008; Nysewander et al. 2009). Coupled with redshift measurements from their host galaxies, this has demonstrated a range of isotropic-equivalent -ray energies of erg (Berger 2007; Nysewander et al. 2009). Temporal monitoring of their broad-band afterglows has led to a similarly broad range of inferred isotropic-equivalent kinetic energies, erg, circumburst densities of cm-3 (Soderberg et al. 2006; Panaitescu 2006; Stratta et al. 2007; Perley et al. 2009; Berger 2010; Fong et al. 2011), and opening angles of (Fox et al. 2005; Grupe et al. 2006; Soderberg et al. 2006; Fong et al. 2012; Margutti et al. 2012a; Nicuesa Guelbenzu et al. 2012; Berger et al. 2013; Sakamoto et al. 2013).
Collimation in GRBs is determined from temporal steepenings in afterglow light curves, termed “jet breaks”, which are expected to be achromatic (Sari et al. 1999; Rhoads 1999; Panaitescu 2005). Jet breaks in the light curves of long GRBs translate to an opening angle distribution with a range of and a median of , leading to beaming-corrected energies of erg (Bloom et al. 2003; Frail et al. 2001; Friedman & Bloom 2005; Kocevski & Butler 2008; Racusin et al. 2009). For short GRBs, the search for jet breaks has been more challenging, primarily due to the intrinsic faintness of their afterglows, a direct reflection of their low energy scales and circumburst densities. There are only three robust cases of jet breaks for short GRBs based on well-sampled light curves thus far (GRB 051221A: Soderberg et al. 2006, GRB 090426: Nicuesa Guelbenzu et al. 2011; GRB 111020A: Fong et al. 2012), with . The non-detection of jet breaks to day after the burst has also provided lower limits on the jet opening angles of (Fox et al. 2005; Grupe et al. 2006; Fong et al. 2012; Coward et al. 2012; Margutti et al. 2012a; Berger et al. 2013), suggesting that short GRBs may have wider jets than their long-duration counterparts.
In addition to an inference on the opening angles, afterglows can also provide unique constraints on the energy scales and circumburst densities through multi-wavelength detections and modeling of the spectral energy distributions. However, of the Swift short GRBs detected to present, only two have been detected in the radio band (GRB 050724A: Berger et al. 2005; GRB 051221A: Soderberg et al. 2006). Both of these events have inferred densities of cm-3 and isotropic-equivalent energies of erg. The upgrade of the VLA with a ten-fold increase in sensitivity (Perley et al. 2011) provides a promising route to increased radio afterglow detections, and thus substantially tighter constraints on these properties.
Temporal afterglow information, particularly in the X-ray band, has also revealed cases of anomalous behavior that do not fit with the standard synchrotron picture of afterglows. For short GRBs, there have been observed cases of flares at s after the burst (Grupe et al. 2006; Margutti et al. 2011), shallow decays attributed to energy injection (e.g., Soderberg et al. 2006), putative early plateaus attributed to the spin-down power of a hyper-massive and highly-magnetized neutron star remnant (Rowlinson et al. 2010, 2013) and two cases of late-time X-ray re-brightenings on day timescales (GRB 050724A: Grupe et al. 2006; GRB 080503: Perley et al. 2009).
Recently, the short-duration GRB 130603B sparked much interest, because its bright optical afterglow enabled the first afterglow spectrum of a short GRB and thus an unambiguous redshift determination of (Cucchiara et al. 2013; de Ugarte Postigo et al. 2013). It also led to the first claimed detection of a “kilonova” associated with a short GRB (Berger et al. 2013; Tanvir et al. 2013), providing direct evidence for a compact object binary progenitor. Here, we present and model the broad-band afterglow of GRB 130603B. In Section 2, we present the X-ray, optical/NIR and radio data sets. In Section 3, we model the evolution of the spectral energy distribution (SED) and constrain the burst explosion properties. In Section 4, we discuss the steepening in the radio and optical light curves, best explained as a jet break. In Section 5, we investigate several possibilities to explain excess X-ray emission at day. Finally in Section 6, we discuss GRB 130603B in the context of the short GRB population, and investigate implications for the energy scale and event rate.
Unless otherwise noted, all magnitudes in this paper are in the AB system and are corrected for Galactic extinction in the direction of the burst using mag (Schlegel et al. 1998; Schlafly & Finkbeiner 2011). Reported uncertainties correspond to confidence. We employ a standard CDM cosmology with , , and km s-1 Mpc-1.
2. Observations
| Exposure Time | Telescope | Instrument | Band | References | |||
|---|---|---|---|---|---|---|---|
| (d) | (hr) | (Jy) | (Jy) | ||||
| X-rays | |||||||
| XMM-Newton | EPIC-pn | 1 keV | This work | ||||
| XMM-Newton | EPIC-pn | 1 keV | This work | ||||
| Optical | |||||||
| Swift | UVOT | 1 | |||||
| Swift | UVOT | 1 | |||||
| NOT | MOS | 2 | |||||
| WHT | ACAM | 1 | |||||
| WHT | ACAM | 1 | |||||
| CAHA | DLR-MKIII | 1 | |||||
| GTC | OSIRIS | 2 | |||||
| WHT | ACAM | 2 | |||||
| Gemini-South | GMOS | 3 | |||||
| Magellan/Baade | IMACS | 4 | |||||
| Gemini-South | GMOS | 3 | |||||
| Gemini-North | GMOS | 2 | |||||
| UKIRT | WFCAM | 2 | |||||
| Gemini-North | GMOS | 2 | |||||
| UKIRT | WFCAM | 2 | |||||
| Gemini-North | GMOS | 2 | |||||
| Gemini-North | GMOS | 2 | |||||
| Gemini-South | GMOS | 3 | |||||
| Gemini-South | GMOS | 3 | |||||
| Magellan/Baade | IMACS | 4 | |||||
| Gemini-North | GMOS | 2 | |||||
| Gemini-North | GMOS | 2 | |||||
| Gemini-North | GMOS | 2 | |||||
| UKIRT | WFCAM | 2 | |||||
| Gemini-North | GMOS | 2 | |||||
| VLT | HAWK-I | 2 | |||||
| GTC | OSIRIS | 2 | |||||
| GTC | OSIRIS | 2 | |||||
| VLT | HAWK-I | 2 | |||||
| TNG | DOLoRes | 1 | |||||
| TNG | DOLoRes | 1 | |||||
| Magellan/Baade | IMACS | This work | |||||
| HST | ACS | F606W | 4 | ||||
| HST | WFC3 | F160W | 2, 4 | ||||
| TNG | DOLoRes | 1 | |||||
| TNG | DOLoRes | 1 | |||||
| MMT | MMTCam | This work | |||||
| HST | WFC3 | F160W | 4 | ||||
| Magellan/Clay | LDSS3 | This work | |||||
| Radio | |||||||
| VLA | GHz | This work | |||||
| VLA | GHz | This work | |||||
| VLA | GHz | This work | |||||
| VLA | GHz | This work | |||||
| VLA | GHz | This work | |||||
| VLA | GHz | This work | |||||
| VLA | GHz | This work | |||||
| VLA | GHz | This work | |||||
| VLA | GHz | This work | |||||
Note. — All upper limits correspond to confidence. Optical flux densities are corrected for Galactic extinction in the direction of the burst, but are not corrected for extinction in the rest-frame of the burst.
a The reported flux and uncertainty are of the claimed kilonova detection (Berger et al. 2013; Tanvir et al. 2013).
References: (1) de Ugarte Postigo et al. 2013; (2) Tanvir et al. 2013; (3) Cucchiara et al. 2013; (4) Berger et al. 2013
GRB 130603B was detected on 2013 June 3 at 15:49:14 UT by the Burst Alert Telescope (BAT; Barthelmy et al. 2005) on-board the Swift satellite (Melandri et al. 2013), and by Konus-Wind (Golenetskii et al. 2013). Swift/BAT localized the burst to RA=11h28m53.2s and Dec= (J2000) with accuracy ( containment; Barthelmy et al. 2013). The -ray emission consists of a single pulse with a duration of s ( keV; Barthelmy et al. 2013), a fluence of erg cm-2 ( keV; Golenetskii et al. 2013), and a peak energy of keV (Golenetskii et al. 2013). The spectral lags are ms ( keV to keV) and ms ( keV to keV; Norris et al. 2013). The combination of the duration, high peak energy, and zero (or negative) lag unambiguously classifies GRB 130603B as a short-hard burst. At (Cucchiara et al. 2013; de Ugarte Postigo et al. 2013), the isotropic-equivalent gamma-ray energy is erg ( keV, rest-frame).
2.1. X-rays
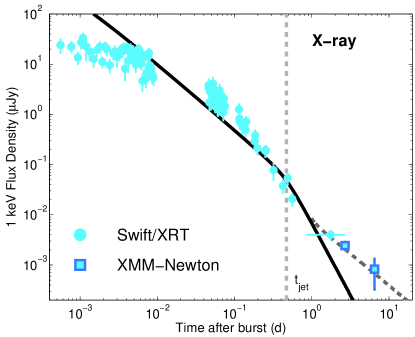
Observations with the X-ray Telescope (XRT; Burrows et al. 2005) on-board Swift commenced at s (where is the time after the BAT trigger) and revealed a fading, uncatalogued X-ray source with a UVOT-enhanced position of RA=11h28m48.15s and Dec= (J2000) and an uncertainty of radius ( containment; Goad et al. 2007; Evans et al. 2007, 2009). The source faded below the XRT detection threshold by d. We analyze the XRT data using the HEASOFT package (v.6.13) and relevant calibration files. To generate a count-rate light curve, we apply standard filtering and screening criteria (see Margutti et al. 2012b), ensuring a minimum signal-to-noise ratio of for each temporal bin.
We initiated a target-of-opportunity program on XMM-Newton (ID: 072257, PI: Fong) with the European Photon Imaging Camera (EPIC-PN) and obtained observations at d and d with net exposure times of ks and ks, respectively. We analyze these data using standard routines in the Scientific Analysis System (SAS) and detect a fading source coincident with the XRT position. We find counts () in the first observation in a -radius aperture, and counts () in the second observation in a -radius aperture, where the aperture size is adjusted to maximize the signal-to-noise ratio.
To determine the flux calibration, we model the XRT data with an absorbed single power-law spectrum, using the Galactic neutral Hydrogen absorption column (; Kalberla et al. 2005). We fit for the photon index, and the intrinsic Hydrogen absorption column ( at ). Using all of the available XRT data, we find and . We apply these spectral parameters to the XRT and XMM data. The resulting fluxes from XMM are listed in Table 1.
2.2. Optical
Subsequent to the discovery of the X-ray afterglow (Melandri et al. 2013), ground-based optical/NIR observations began at hr to search for an optical counterpart (Berger et al. 2013; Cucchiara et al. 2013; de Ugarte Postigo et al. 2013; Tanvir et al. 2013). We initiated four sets of -band observations of GRB 130603B using instruments on the twin Magellan 6.5-m telescopes, spanning hr to d (Table 1). The description of these observations and the optical afterglow discovery are provided in Berger et al. (2013). In addition, we obtained a set of -band observations with MMTCam on the -m Multi-Mirror Telescope (MMT) and processed these data using standard procedures in IRAF. All of the published optical/NIR afterglow photometry (Berger et al. 2013; Cucchiara et al. 2013; de Ugarte Postigo et al. 2013; Tanvir et al. 2013), are listed in Table 1.
2.3. Radio
We observed the position of GRB 130603B with the Karl G. Jansky Very Large Array (VLA; Program 13A-046, PI: Berger) starting at hr at a mean frequency of GHz (upper and lower side-bands centered at GHz and GHz) using 3C286 and J1120-1420 for bandpass/flux and gain calibration, respectively. We follow standard procedures in the Astronomical Image Processing System (AIPS; Greisen 2003) for data calibration and analysis. We detect a source located at RA=11h28m48.15s, Dec= (J2000; RA, Dec), consistent with the optical and X-ray afterglow positions. We obtained three subsequent GHz observations at d, d, and d in which the source faded, indicating that it is the radio afterglow. We also obtained observations at a mean frequency of Hz at d (using J1118+1234 as the phase calibrator), where the afterglow is not detected.
We measure flux densities for the upper and lower side-bands from each epoch using AIPS/JMFIT, and calculate upper limits from source-free regions using AIPS/IMSTAT. The radio afterglow detections and upper limits are listed in Table 1.
3. Broad-band Afterglow Properties
We utilize the broad-band afterglow observations to constrain the explosion properties and circumburst environment of GRB 130603B. We emphasize that this is only the third radio afterglow detection of a short GRB, thereby enabling substantially tighter constraints on the physical properties than for the majority of short GRBs. We adopt the standard synchrotron model for a relativistic blastwave in a constant density medium (ISM; Sari et al. 1999; Granot & Sari 2002). This model provides a mapping from the broad-band afterglow flux densities to physical parameters of the explosion and circumburst environment: isotropic-equivalent kinetic energy (), circumburst density (), fractions of post-shock energy in radiating electrons () and magnetic fields (), and the electron power-law distribution index (), with for .
To determine the locations of the break frequencies with respect to the X-ray, optical and radio bands, we first compare the spectral indices from the afterglow observations. From the X-ray spectral fit, we find (Section 2.1), while from the optical -band afterglow photometry at d (Table 1; Cucchiara et al. 2013; Tanvir et al. 2013), we measure an observed spectral index of . The NIR spectral index measured from the -bands at the same epoch is substantially shallower, , indicating that the optical flux is suppressed by extinction in the host galaxy. To determine the amount of extinction, we apply a Milky Way extinction curve (Cardelli et al. 1989) to the photometry, fitting for the spectral index and rest-frame extinction (), and find best-fit values of and mag, similar to the values found from other analyses (de Ugarte Postigo et al. 2013; Jin et al. 2013). Using standard Galactic relations between the intrinsic hydrogen column density and rest-frame extinction (Predehl & Schmitt 1995; Watson 2011), we find an inferred extinction of mag from the value determined in Section 2.1, consistent with mag. A comparison of and indicates that the cooling frequency, , lies between the optical and X-ray bands, and that .
To determine the location of the self-absorption and peak frequencies ( and , respectively) with respect to the optical and radio bands, we compare the radio spectral slope determined from VLA observations at d and d (Table 1) to . We find that does not match the optical slope and furthermore is consistent with , as expected for .
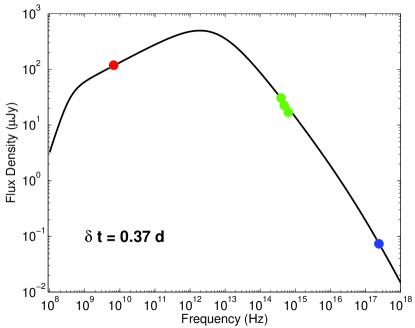
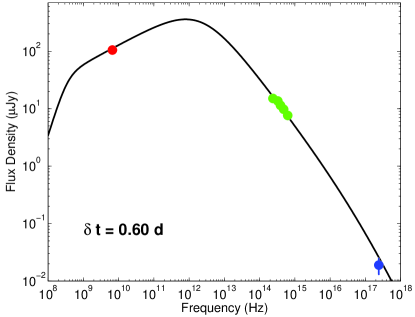
Knowing the relative locations of the break frequencies with respect to our observing bands, we use the standard synchrotron model to determine allowable ranges for the physical parameters. We use the afterglow SED at two common epochs, d and d, where the optical/NIR fluxes are corrected for mag (Figure 1). We also use the constraints and determine:
| (1a) | |||
| (1b) | |||
| (1c) | |||
| (1d) | |||
| (1e) | |||
where the ranges are set by the uncertainty in and the conditions that . We note that the inferred isotropic-equivalent kinetic energy is comparable to erg. We show representative model SEDs along with the broad-band afterglow observations in Figure 1.
4. Afterglow Evolution: Jet Break
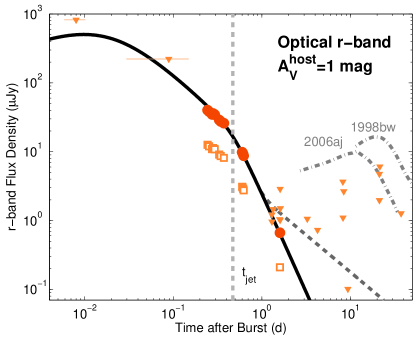
To investigate the temporal behavior of the optical/NIR afterglow, we interpolate all of the available afterglow data (Table 1) to the optical -band using the observed spectral slope (Section 3) and then correct these fluxes for mag. The resulting temporal behavior of the optical afterglow flux is characterized by a broken power law (Figure 2). Invoking a broken power law model with two segments, we find pre- and post-break decay indices of and , with a break time of d. The required change in the temporal index is therefore . Although there are several possibilities that can explain breaks in GRB afterglow light curves, most of these cannot explain the large change in slope and the steep post-break decline seen here. For instance, the transition of the cooling frequency across the band predicts (Sari et al. 1998), while the cessation of energy injection observed in long GRBs typically leads to with moderate decline rates of and (Nousek et al. 2006; Zhang et al. 2006; Liang et al. 2007). A steep drop in the density is predicted to cause maximum changes of for density contrasts of (Nakar & Granot 2007), and would require a density contrast of to account for .
We therefore conclude that the temporal steepening is instead a jet break, when the edge of a relativistically-beamed outflow becomes visible to the observer (Sari et al. 1999; Rhoads 1999). In this scenario, the post-break flux declines as (Sari et al. 1999). Indeed, we find good agreement between determined from the optical light curve and independently determined from the broad-band SED (Section 3).
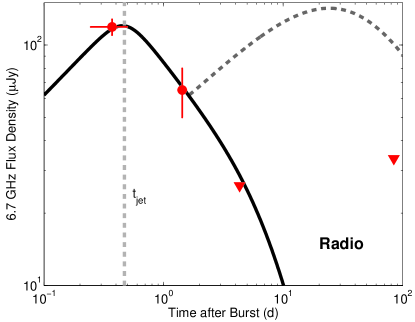
In addition, since the radio band lies between and (Section 3), the radio flux density should increase as in the spherical regime (Granot & Sari 2002), while the flux will decrease as in a post-jet break scenario (Sari et al. 1999). We find that the observed radio flux of GRB 130603B declines with between d and d, demonstrating that the evolution is not isotropic (Figure 2). Thus, the temporal behavior of both the optical and radio afterglows support a jet break at d, making this the first detection of a jet break in the radio afterglow of a short GRB.
In conjunction with the energy, density, and redshift, the time of the break can be converted to a jet opening angle (Sari et al. 1999; Frail et al. 2001),
| (2) |
where is in days, is in units of erg and is in units of cm-3. For the ranges of and in Equations 1d-1e, we calculate . However, given a NS-NS/NS-BH progenitor as indicated by the likely detection of a kilonova (Berger et al. 2013; Tanvir et al. 2013), the circumburst density is likely more typical of ISM densities ( cm-3), leading to .
5. Late-time X-ray Excess
The synchrotron afterglow model with a jet break at d provides a good match to the radio and optical light curves (Figure 2). However, unlike the optical afterglow behavior, we do not observe significant steepening in the X-ray light curve, and instead the afterglow flux at d can be characterized by a single power law with . Thus, our afterglow model underpredicts the X-ray flux by a factor of at d (see Figure 2). We note that Tanvir et al. (2013) and de Ugarte Postigo et al. (2013) previously claimed that the same broken power-law fits both the optical and X-ray data, but this was based on the XRT data alone. The XMM-Newton observations do not support these claims. We are thus motivated to consider an additional energy source for this excess X-ray emission, which follows erg s-1 (where is in units of days).
One possible source of late-time excess X-ray emission is continued energy injection into the blastwave from ongoing central engine activity (Zhang & Mészáros 2002; Zhang et al. 2006). We first consider continuous power law energy injection with . We find that energy injection beginning at d characterized by (e.g., ) provides an adequate fit to the late-time X-ray light curve (Figure 2). Assuming that the injection extends to d, the energy injection factor is . However, this energy injection model violates both the optical and radio light curves; in particular, the radio upper limits are a factor of below the predicted flux with energy injection (Figure 2). Therefore, continuous energy injection is not a viable explanation for the excess X-ray emission.
We are therefore motivated to consider a source of emission that predominantly contributes in the X-rays with negligible effects on the other bands. We focus on scenarios in which this emission originates from the central engine, but which we now assume can be viewed directly through the merger ejecta (we justify this assumption below). We first consider ongoing accretion (“fall-back”) onto the newly-formed black hole following a compact object merger. By extrapolating the matter trajectories from numerical simulations of the merger process to late times, Rosswog (2007) predicts accretion luminosities of erg s-1 on a timescale of d, with a temporal decay of similar to the canonical prediction of for a tidally disrupted star (Rees 1988). Assuming a radiative efficiency of , this scenario is well matched to the X-ray light curve of GRB 130603B. However, such efficiencies are optimistic and more detailed models of the fall-back process from compact object mergers (Rossi & Begelman 2009) predict much lower X-ray luminosities of , which would not be large enough to explain the observed excess.
Another possibility is that the X-ray emission is powered by the spin-down of a massive magnetar remnant (Metzger et al. 2008; Bucciantini et al. 2012; Zhang 2013), a process that has been used to explain putative plateaus in the X-ray afterglows of short GRBs (Rowlinson et al. 2013). Such remnants may be at least temporarily stable to gravitational collapse, if they rotate with spin periods of few ms (e.g. Özel et al. 2010; Giacomazzo & Perna 2013). The remnant may also acquire strong magnetic fields of G, similar to those of Galactic magnetars (Duncan & Thompson 1992; Zrake & MacFadyen 2013). The magnetar model predicts that the late-time spin-down luminosity should decay as , consistent with the observed temporal decay of . The predicted spectrum is (Metzger et al. 2013), also consistent with the observed spectral index . Fitting the entire X-ray light curve with a magnetar model characterized by the duration and luminosity of the plateau (Zhang & Mészáros 2002), and assuming and cm, we find best-fit parameters of G and ms (where higher mass corresponds to slower spin periods). However, such slow spin periods are likely unphysical in the merger context due to the substantial angular momentum of the initial binary. Instead, assuming a more reasonable initial spin period of 1 ms, the required magnetic field strength to produce the observed X-ray luminosity at d assuming 10% radiative efficiency, is G, but such a model would under-predict the light curve at s by a factor of a few. We thus conclude that the magnetar scenario could potentially explain the late-time X-ray excess for s.
To justify that we can observe the central engine directly, as is required in either the fall-back or magnetar models, the merger ejecta must be transparent to soft X-rays. Due to the high bound-free X-ray opacity of neutral matter, this in turn requires that the engine be sufficiently luminous to re-ionize the merger ejecta (Metzger et al. 2013). The ejecta becomes transparent to X-rays once two conditions are satisfied: (1) the opacity becomes dominated by electron scattering (, where and are the bound-free and electron scattering opacities, respectively) and (2) the electron scattering optical depth, , through the ejecta decreases to . Assuming ejecta mainly composed of hydrogen-like iron111Outflows along the polar direction arise chiefly from the accretion disk and are expected to be composed of Fe-like nuclei (e.g. Metzger et al. 2008). and an ejecta temperature of K, we derive the following expressions (see Appendix for details):
| (3) |
| (4) |
where , and are the (effective) mass, radius, and velocity of the ejecta along the observer line of sight, respectively. Using fiducial values for and of the merger (Hotokezaka et al. 2013; Fernández & Metzger 2013), we find that both conditions are satisfied on timescales few hr given the observed X-ray luminosity. We thus conclude that the ejecta are indeed transparent to the soft X-rays at late times, supporting the idea that direct radiation from the central engine could produce the observed X-ray excess emission in GRB 130603B.
We note that of the short GRBs with X-ray observations to d, two events, GRBs 050724 and 080503, also exhibited late-time X-ray excess emission on timescales of d (Grupe et al. 2006; Perley et al. 2009). However, unlike GRB 130603B, these bursts both had corresponding behavior in the optical bands (Malesani et al. 2007; Perley et al. 2009), suggesting that the optical and X-ray emission were from the same emitting region.
6. Comparison to Previous Short GRBs
The broad-band afterglow observations of GRB 130603B provide the second detection of a multi-wavelength jet break in a short GRB, and the first detection of a jet break in the radio band. Radio afterglow emission has thus far been detected in two short GRBs: GRB 050724A (Berger et al. 2005), GRB 051221A (Soderberg et al. 2006). The ability to monitor the radio afterglow of GRB 130603B at a flux density level of mJy highlights the improved sensitivity of the VLA.
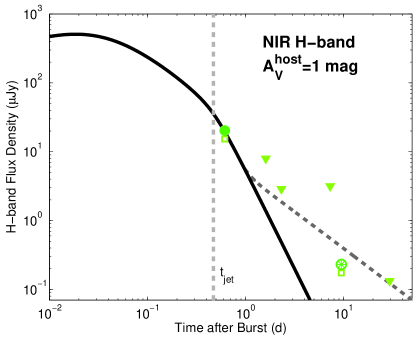
Indeed, the radio evolution can provide an important constraint on the progenitor. In the context of the compact object binary progenitor, the radioactive decay of -process elements in the sub-relativistic merger ejecta is predicted to produce transient emission, termed a “kilonova” (Li & Paczyński 1998; Metzger et al. 2010; Goriely et al. 2011; Roberts et al. 2011; Rosswog et al. 2013), which is expected to peak in the NIR (Barnes & Kasen 2013; Kasen et al. 2013; Tanaka & Hotokezaka 2013). Late-time NIR emission in GRB 130603B detected with the Hubble Space Telescope (Figure 2; Berger et al. 2013; Tanvir et al. 2013) has been interpreted as the first detection of a -process kilonova. An alternative scenario to explain the excess NIR emission of GRB 130603B may be a wide, mildly relativistic component of a structured jet (Jin et al. 2013) which has been used to explain the light curve behavior of a handful of long GRBs (e.g., Berger et al. 2003; Sheth et al. 2003; Peng et al. 2005; Racusin et al. 2008). In this scenario, the predicted radio emission is similarly boosted, and will be Jy at d, the time of our final radio observations (Jin et al. 2013). Instead, the non-detection of any radio emission to Jy provides a strong constraint on the existence of a two component jet, and supports the kilonova interpretation of the NIR emission.
The detection of a jet break in GRB 130603B leads to an opening angle measurement of , with a more likely range of . This opening angle is the fourth222We note that Nicuesa Guelbenzu et al. (2012) claimed a jet break in the GRB 090305A afterglow but this is based on a single optical data point. such measurement for a short GRB after GRB 051221A (; Soderberg et al. 2006), GRB 090426 (; Nicuesa Guelbenzu et al. 2011), and GRB 111020A (; Fong et al. 2012). From these four short GRB opening angle measurements, the median is (Figure 3).
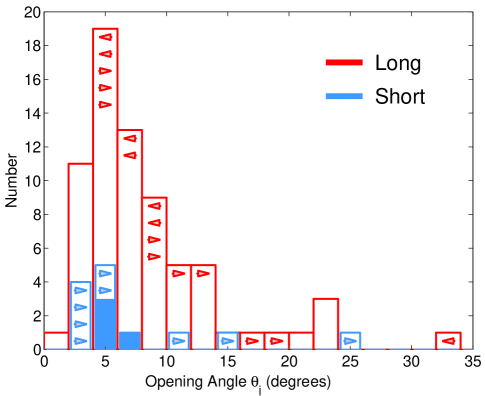
The non-detections of jet breaks can provide lower limits on the opening angles, assuming on-axis orientation, as off-axis observing angles could disguise jet breaks (van Eerten & MacFadyen 2012, 2013). Indeed, such non-detections to timescales of day with Swift/XRT have led to lower limits of (Fong et al. 2012), while monitoring with more sensitive instruments such as Chandra and XMM-Newton to timescales of week has led to more meaningful limits of (Figure 3; Fox et al. 2005; Grupe et al. 2006; Berger et al. 2013). The search for jet breaks has been less fruitful in the optical bands, primarily due to the intrinsic faintness of the optical afterglows and contamination from host galaxies. Indeed, the sole lower limit from a well-sampled optical light curve is from GRB 081226A, with (Nicuesa Guelbenzu et al. 2012), while we conservatively adopt a lower limit of for GRB 050709 based on a sparsely-sampled optical light curve (Fox et al. 2005). Using the measured opening angles and lower limits of , a likely median for short GRBs is .
The opening angle distribution of short GRBs impacts the true energy scale and event rate. The true energy is lower than the isotropic-equivalent value by the beaming factor, (, ), while the actual event rate is increased by . For GRB 130603B, with an opening angle of , the resulting beaming factor is . Therefore, the true energies are erg and erg. The small population of short GRBs with well-constrained opening angles have beaming-corrected energies of erg (Soderberg et al. 2006; Burrows et al. 2006; Grupe et al. 2006; Fong et al. 2012; Nicuesa Guelbenzu et al. 2012), roughly two orders of magnitude below the inferred true energies for long GRBs (Frail et al. 2001; Bloom et al. 2003; Kocevski & Butler 2008; Racusin et al. 2009).
The true event rate is elevated compared to the observed rate by . The current estimated observed short GRB volumetric rate is Gpc-3 yr-1 (Nakar et al. 2006). For a median opening angle of , the median inverse beaming factor is , resulting in a true rate of Gpc-3 yr-1. The observed all-sky event rate of yr-1 within 200 Mpc (Guetta & Piran 2005) then becomes yr-1. This rate is comparable to estimates for NS-NS merger detections with Advanced LIGO/VIRGO (LIGO Scientific Collaboration et al. 2013).
7. Conclusions
We presented broad-band observations of the afterglow of GRB 130603B, uncovering a jet break in the optical and radio light curves at d. This comprehensive data set marks the first detection of a jet break in the radio band and the third radio afterglow detection in nearly a decade of follow-up. The inferred opening angle is , leading to true energy releases of erg.
We observe excess X-ray emission at 1 day with no corresponding emission in the other bands. We rule out energy injection from ongoing activity from the central engine due to the non-detection of any radio or optical emission on a similar timescale. We find that fall-back accretion can explain the late-time excess only if the radiative efficiency is . Finally, we consider that the emission is due to the spin-down of a massive magnetar and find that a model characterized by a spin period of ms and magnetic field of G provides a good fit to the emission at d, but underpredicts the X-ray emission at s. Furthermore, we show that the merger ejecta are transparent to soft X-rays (also see Appendix), ensuring that the engine can be viewed in X-rays.
GRB 130603B highlights the importance of multi-wavelength afterglow observations, which provide the only route to constraints on the basic explosion properties of GRBs. In particular, the radio band is advantageous because unlike the optical, it does not typically suffer from host galaxy contamination, and can provide an additional constraint on the circumburst density. Thus, continued target-of-opportunity efforts at the VLA will provide invaluable information on the sub-parsec explosion environments. In addition, the non-detection of late-time radio emission, coupled with the detection of NIR excess emission, can provide unambiguous support for the kilonova interpretation for future events, as it has for GRB 130603B.
The opening angle determination for GRB 130603B is the fourth robust jet break measurement for a short GRB. Using realistic assumptions for the opening angle distribution, this implies a conservative volumetric event rate of Gpc-3 yr-1, and an all-sky event rate of yr-1 within 200 Mpc, consistent with the predictions of NS-NS merger detections with Advanced LIGO/VIRGO. However, the opening angle distribution for wider jets of is poorly constrained, and it is necessary to continue monitoring short GRB afterglows to late times to characterize this part of the distribution.
Appendix A Re-ionization Model
The average density of the freely-expanding ejecta decreases with time as , where is the ejecta radius, and is the ejecta velocity. The ionization state of the ejecta is determined by comparing the absorption rate of ionizing photons = (per ion) to the rate of recombination , where = is the number density of ionizing photons; is a constant of order unity that depends on the spectrum of the ionizing radiation; is the specific X-ray luminosity near the ionization threshold energy keV; cm2 is the photoionization cross section at and is the number density of electrons in the ejecta; cm3 s-1 is the [type 2] recombination coefficient (e.g. Osterbrock & Ferland 2006); and is the ejecta temperature in units of 104 K. The above results can be combined to determine the ratio of the bound-free and electron scattering cm2 g-1 opacities of the ejecta, where is the neutral fraction (set by the balance between ionization and recombination rates). The resulting coefficient is in Equation 3, from which it is shown that the ejecta is sufficiently ionized for the observed X-rays to originate directly from the central engine interior to the ejecta.
One might be concerned that an X-ray source of sufficient luminosity to ionize the ejecta along the observer line of site (perpendicular to the merger plane) would also be sufficient to ionize matter ejected in the equator, the radioactive heating of which powers the optical/NIR kilonova emission. Indeed, the red colors of the kilonova result from the high line opacity of the lanthanides, which would vanish were the ejecta ionized by the central engine. However, equation (3) shows that is larger for the equatorial ejecta (due to its larger mass and lower velocity ), and that this ratio increases with time (since , approximately). The fact that may be sigificantly for the equatorial kilonova ejecta implies that the latter may remain neutral, preserving the kilonova emission. However, more detailed calculations, including the different (and uncertain) recombination rates of the lanthanides, is necessary to verify this conclusion.
References
- Barnes & Kasen (2013) Barnes, J., & Kasen, D. 2013, ArXiv e-prints
- Barthelmy et al. (2005) Barthelmy, S. D., et al. 2005, Space Sci. Rev., 120, 143
- Barthelmy et al. (2013) Barthelmy, S. D., et al. 2013, GRB Coordinates Network, 14741, 1
- Berger (2007) Berger, E. 2007, ApJ, 670, 1254
- Berger (2010) Berger, E. 2010, ApJ, 722, 1946
- Berger et al. (2013) Berger, E., Fong, W., & Chornock, R. 2013, ApJ, 774, L23
- Berger et al. (2003) Berger, E., Kulkarni, S. R., & Frail, D. A. 2003, ApJ, 590, 379
- Berger et al. (2003) Berger, E., et al. 2003, Nature, 426, 154
- Berger et al. (2005) Berger, E., et al. 2005, Nature, 438, 988
- Berger et al. (2013) Berger, E., et al. 2013, ApJ, 765, 121
- Bloom et al. (2003) Bloom, J. S., Frail, D. A., & Kulkarni, S. R. 2003, ApJ, 594, 674
- Bucciantini et al. (2012) Bucciantini, N., Metzger, B. D., Thompson, T. A., & Quataert, E. 2012, MNRAS, 419, 1537
- Burrows et al. (2006) Burrows, D. N., et al. 2006, ApJ, 653, 468
- Burrows et al. (2005) Burrows, D. N., et al. 2005, Space Sci. Rev., 120, 165
- Cardelli et al. (1989) Cardelli, J. A., Clayton, G. C., & Mathis, J. S. 1989, ApJ, 345, 245
- Cenko et al. (2011) Cenko, S. B., et al. 2011, ApJ, 732, 29
- Cenko et al. (2010) Cenko, S. B., et al. 2010, ApJ, 711, 641
- Clocchiatti et al. (2011) Clocchiatti, A., Suntzeff, N. B., Covarrubias, R., & Candia, P. 2011, AJ, 141, 163
- Coward et al. (2012) Coward, D. M., et al. 2012, MNRAS, 425, 2668
- Cucchiara et al. (2013) Cucchiara, A., Prochaska, J. X., Perley, D. A., Cenko, S. B., Werk, J., Cao, Y., Bloom, J. S., & Cobb, B. E. 2013, ArXiv e-prints
- de Ugarte Postigo et al. (2013) de Ugarte Postigo, A., et al. 2013, ArXiv e-prints
- Duncan & Thompson (1992) Duncan, R. C., & Thompson, C. 1992, ApJ, 392, L9
- Eichler et al. (1989) Eichler, D., Livio, M., Piran, T., & Schramm, D. N. 1989, Nature, 340, 126
- Evans et al. (2009) Evans, P. A., et al. 2009, MNRAS, 397, 1177
- Evans et al. (2007) Evans, P. A., et al. 2007, A&A, 469, 379
- Fernández & Metzger (2013) Fernández, R., & Metzger, B. D. 2013, ArXiv e-prints
- Filgas et al. (2011) Filgas, R., et al. 2011, A&A, 526, A113
- Fong & Berger (2013) Fong, W., & Berger, E. 2013, ApJ, 776, 18
- Fong et al. (2013) Fong, W., et al. 2013, ApJ, 769, 56
- Fong et al. (2011) Fong, W., et al. 2011, ApJ, 730, 26
- Fong et al. (2010) Fong, W., Berger, E., & Fox, D. B. 2010, ApJ, 708, 9
- Fong et al. (2012) Fong, W., et al. 2012, ApJ, 756, 189
- Fox et al. (2005) Fox, D. B., et al. 2005, Nature, 437, 845
- Frail et al. (2001) Frail, D. A., et al. 2001, ApJ, 562, L55
- Friedman & Bloom (2005) Friedman, A. S., & Bloom, J. S. 2005, ApJ, 627, 1
- Galama et al. (1998) Galama, T. J., et al. 1998, Nature, 395, 670
- Gehrels et al. (2008) Gehrels, N., et al. 2008, ApJ, 689, 1161
- Gehrels et al. (2004) Gehrels, N., et al. 2004, ApJ, 611, 1005
- Ghirlanda et al. (2004) Ghirlanda, G., Ghisellini, G., & Lazzati, D. 2004, ApJ, 616, 331
- Giacomazzo & Perna (2013) Giacomazzo, B., & Perna, R. 2013, ApJ, 771, L26
- Goad et al. (2007) Goad, M. R., et al. 2007, A&A, 476, 1401
- Goldstein et al. (2011) Goldstein, A., et al. 2011, ArXiv e-prints
- Golenetskii et al. (2013) Golenetskii, S., et al. 2013, GRB Coordinates Network, 14771, 1
- Goriely et al. (2011) Goriely, S., Bauswein, A., & Janka, H.-T. 2011, ApJ, 738, L32
- Granot & Sari (2002) Granot, J., & Sari, R. 2002, ApJ, 568, 820
- Greisen (2003) Greisen, E. W. 2003, Information Handling in Astronomy - Historical Vistas, 285, 109
- Grupe et al. (2006) Grupe, D., Burrows, D. N., Patel, S. K., Kouveliotou, C., Zhang, B., Mészáros, P., Wijers, R. A. M., & Gehrels, N. 2006, ApJ, 653, 462
- Guetta & Piran (2005) Guetta, D., & Piran, T. 2005, A&A, 435, 421
- Hotokezaka et al. (2013) Hotokezaka, K., Kiuchi, K., Kyutoku, K., Okawa, H., Sekiguchi, Y.-i., Shibata, M., & Taniguchi, K. 2013, Phys. Rev. D, 87, 024001
- Jin et al. (2013) Jin, Z.-P., Xu, D., Fan, Y.-Z., Wu, X.-F., & Wei, D.-M. 2013, ApJ, 775, L19
- Kalberla et al. (2005) Kalberla, P. M. W., Burton, W. B., Hartmann, D., Arnal, E. M., Bajaja, E., Morras, R., & Pöppel, W. G. L. 2005, A&A, 440, 775
- Kasen et al. (2013) Kasen, D., Badnell, N. R., & Barnes, J. 2013, ApJ, 774, 25
- Kocevski & Butler (2008) Kocevski, D., & Butler, N. 2008, ApJ, 680, 531
- Kouveliotou et al. (1993) Kouveliotou, C., Meegan, C. A., Fishman, G. J., Bhat, N. P., Briggs, M. S., Koshut, T. M., Paciesas, W. S., & Pendleton, G. N. 1993, ApJ, 413, L101
- Li & Paczyński (1998) Li, L.-X., & Paczyński, B. 1998, ApJ, 507, L59
- Liang et al. (2007) Liang, E.-W., Zhang, B.-B., & Zhang, B. 2007, ApJ, 670, 565
- LIGO Scientific Collaboration et al. (2013) LIGO Scientific Collaboration, et al. 2013, ArXiv e-prints
- Malesani et al. (2007) Malesani, D., et al. 2007, A&A, 473, 77
- Margutti et al. (2012a) Margutti, R., et al. 2012a, ApJ, 756, 63
- Margutti et al. (2011) Margutti, R., et al. 2011, MNRAS, 417, 2144
- Margutti et al. (2012b) Margutti, R., et al. 2012b, ArXiv e-prints
- Melandri et al. (2013) Melandri, A., et al. 2013, GRB Coordinates Network, 14735, 1
- Metzger et al. (2010) Metzger, B. D., et al. 2010, MNRAS, 406, 2650
- Metzger et al. (2008) Metzger, B. D., Quataert, E., & Thompson, T. A. 2008, MNRAS, 385, 1455
- Metzger et al. (2013) Metzger, B. D., Vurm, I., Hascoet, R., & Beloborodov, A. M. 2013, ArXiv e-prints
- Mirabal et al. (2006) Mirabal, N., Halpern, J. P., An, D., Thorstensen, J. R., & Terndrup, D. M. 2006, ApJ, 643, L99
- Nakar et al. (2006) Nakar, E., Gal-Yam, A., & Fox, D. B. 2006, ApJ, 650, 281
- Nakar & Granot (2007) Nakar, E., & Granot, J. 2007, MNRAS, 380, 1744
- Narayan et al. (1992) Narayan, R., Paczynski, B., & Piran, T. 1992, ApJ, 395, L83
- Nicuesa Guelbenzu et al. (2012) Nicuesa Guelbenzu, A., et al. 2012, ArXiv e-prints
- Nicuesa Guelbenzu et al. (2011) Nicuesa Guelbenzu, A., et al. 2011, A&A, 531, L6
- Norris et al. (2013) Norris, J., Gehrels, N., Barthelmy, S. D., & Sakamoto, T. 2013, GRB Coordinates Network, 14746, 1
- Nousek et al. (2006) Nousek, J. A., et al. 2006, ApJ, 642, 389
- Nysewander et al. (2009) Nysewander, M., Fruchter, A. S., & Pe’er, A. 2009, ApJ, 701, 824
- Osterbrock & Ferland (2006) Osterbrock, D. E., & Ferland, G. J. 2006, Astrophysics of gaseous nebulae and active galactic nuclei
- Özel et al. (2010) Özel, F., Psaltis, D., Ransom, S., Demorest, P., & Alford, M. 2010, ApJ, 724, L199
- Panaitescu (2005) Panaitescu, A. 2005, MNRAS, 362, 921
- Panaitescu (2006) Panaitescu, A. 2006, MNRAS, 367, L42
- Peng et al. (2005) Peng, F., Königl, A., & Granot, J. 2005, ApJ, 626, 966
- Perley et al. (2009) Perley, D. A., et al. 2009, ApJ, 696, 1871
- Perley et al. (2011) Perley, R. A., Chandler, C. J., Butler, B. J., & Wrobel, J. M. 2011, ApJ, 739, L1
- Predehl & Schmitt (1995) Predehl, P., & Schmitt, J. H. M. M. 1995, A&A, 293, 889
- Racusin et al. (2008) Racusin, J. L., et al. 2008, Nature, 455, 183
- Racusin et al. (2009) Racusin, J. L., et al. 2009, ApJ, 698, 43
- Rees (1988) Rees, M. J. 1988, Nature, 333, 523
- Rhoads (1999) Rhoads, J. E. 1999, ApJ, 525, 737
- Roberts et al. (2011) Roberts, L. F., Kasen, D., Lee, W. H., & Ramirez-Ruiz, E. 2011, ApJ, 736, L21
- Rossi & Begelman (2009) Rossi, E. M., & Begelman, M. C. 2009, MNRAS, 392, 1451
- Rosswog (2007) Rosswog, S. 2007, MNRAS, 376, L48
- Rosswog et al. (2013) Rosswog, S., Korobkin, O., Arcones, A., & Thielemann, F.-K. 2013, ArXiv e-prints
- Rowlinson et al. (2013) Rowlinson, A., O’Brien, P. T., Metzger, B. D., Tanvir, N. R., & Levan, A. J. 2013, MNRAS, 430, 1061
- Rowlinson et al. (2010) Rowlinson, A., et al. 2010, MNRAS, 409, 531
- Sakamoto et al. (2013) Sakamoto, T., et al. 2013, ApJ, 766, 41
- Sari et al. (1999) Sari, R., Piran, T., & Halpern, J. P. 1999, ApJ, 519, L17
- Sari et al. (1998) Sari, R., Piran, T., & Narayan, R. 1998, ApJ, 497, L17
- Schlafly & Finkbeiner (2011) Schlafly, E. F., & Finkbeiner, D. P. 2011, ApJ, 737, 103
- Schlegel et al. (1998) Schlegel, D. J., Finkbeiner, D. P., & Davis, M. 1998, ApJ, 500, 525
- Sheth et al. (2003) Sheth, K., Frail, D. A., White, S., Das, M., Bertoldi, F., Walter, F., Kulkarni, S. R., & Berger, E. 2003, ApJ, 595, L33
- Soderberg et al. (2006) Soderberg, A. M., et al. 2006, ApJ, 650, 261
- Stratta et al. (2007) Stratta, G., et al. 2007, A&A, 474, 827
- Tanaka & Hotokezaka (2013) Tanaka, M., & Hotokezaka, K. 2013, ArXiv e-prints
- Tanvir et al. (2013) Tanvir, N. R., Levan, A. J., Fruchter, A. S., Hjorth, J., Hounsell, R. A., Wiersema, K., & Tunnicliffe, R. L. 2013, Nature, 500, 547
- van Eerten & MacFadyen (2013) van Eerten, H., & MacFadyen, A. 2013, ApJ, 767, 141
- van Eerten & MacFadyen (2012) van Eerten, H. J., & MacFadyen, A. I. 2012, ApJ, 751, 155
- Watson (2011) Watson, D. 2011, A&A, 533, A16
- Zhang (2013) Zhang, B. 2013, ApJ, 763, L22
- Zhang et al. (2006) Zhang, B., Fan, Y. Z., Dyks, J., Kobayashi, S., Mészáros, P., Burrows, D. N., Nousek, J. A., & Gehrels, N. 2006, ApJ, 642, 354
- Zhang & Mészáros (2002) Zhang, B., & Mészáros, P. 2002, ApJ, 566, 712
- Zrake & MacFadyen (2013) Zrake, J., & MacFadyen, A. I. 2013, ApJ, 769, L29