Correlation dynamics and enhanced signals for serial DNA sequencing
Abstract
Nanopore based sequencing has demonstrated significant potential for the development of fast, accurate, and cost-efficient fingerprinting techniques for next generation molecular detection and sequencing. We propose a specific multi-layered graphene-based nanopore device architecture for the recognition of single DNA bases. Molecular detection and analysis can be accomplished through the detection of transverse currents as the molecule or DNA base translocates through the nanopore. To increase the overall signal-to-noise ratio and the accuracy, we implement a new ”multi-point cross-correlation” technique for identification of DNA bases or other molecules on the molecular level. we demonstrate that the cross-correlations between each nanopore will greatly enhance the transverse current signal for each molecule. We implement first-principles transport calculations for DNA bases surveyed across a multi-layered graphene nanopore system to illustrate the advantages of proposed geometry. A time-series analysis of the cross-correlation functions illustrates the potential of this method for enhancing the signal-to-noise ratio. This work constitutes a significant step forward in facilitating fingerprinting of single biomolecules using solid state technology.
keywords:
graphene, electronic DNA sequencing, nanopore, tunneling conductance, cross correlationTheoretical Division, Los Alamos National Laboratory]Theoretical Division, Los Alamos National Laboratory, Los Alamos, New Mexico 87545 Department of Physics and Astronomy, James Madison University]Department of Physics and Astronomy, James Madison University, Harrisonburg, VA 22807 Department of Physics, University of Washington]Department of Physics, University of Washington, Seattle Washington 98195 Department of Physics, University of California, San Diego]Department of Physics, University of California, San Diego, California 92093 Department of Physics, University of California, San Diego]Department of Physics, University of California, San Diego, California 92093 Nordita Roslagstullsbacken 23, 106 91 Stockholm Sweden] Nordic Institute for Theoretical Physics, KTH Royal Institute of Technology and Stockholm University, Stockholm, Sweden \altaffiliationTheoretical Division, Los Alamos National Laboratory, Los Alamos, New Mexico 87545 \altaffiliationCenter for Integrated Nanotechnologies, Los Alamos National Laboratory, Los Alamos, New Mexico 87545
1 Introduction
With applications ranging from explosives and drug detection to DNA sequencing and biomolecular identification, the ability to detect specific molecules and/or molecular series presents many challenges for scientists. With a specific need for timely and accurate measurements and evaluation, it is essential that researchers investigate both the manner of detection as well as explore new and improved computational methods for analysis to keep up with the growing pace of the individual fields.
The field of DNA sequencing is rapidly evolving due to increasing support and technology. As this occurs, sequencing techniques are challenged by the need for a rapid increase of accuracy, speed, and resolution for smaller amounts of material 1. Nanopore-based sequencing 2, 3 and serial methods 4, 5 provide promising alternatives to the well established Sanger method 6, particularly for identifying single DNA bases using transverse conductance 7, 8. Such an approach relies on the ability to resolve the electronic fingerprints of DNA one relevant unit at a time (‘serial’) as DNA translocates through a nanochannel. It has been established that experimental methods are capable of achieving single-base resolution, which has prompted investigations into the local electrical properties of single DNA bases 9, 10. Concurrently, the theoretical underpinnings of this approach have been continuously developing 4, 11, 5, 7, 8.
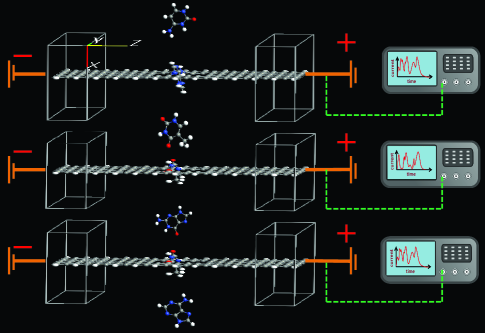
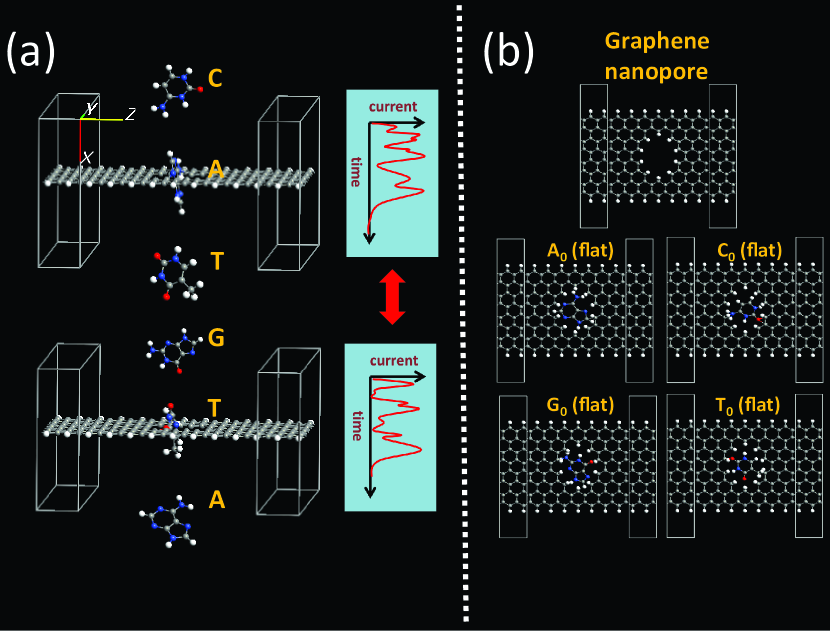
The single-molecule sensitivity of nanopore sequencing has been recently demonstrated by Kawai et al. 12 and Lindsayet al. 13. The sequence of DNA/RNA oligomers and microRNA by tunneling has also been demonstrated 14. Despite such high-quality experimental methods, the most pressing challenge in serial sequencing lies in overcoming effects of noise that lead to a small signal to noise (S/N) ratio in the measured current . The signal fluctuations generally originate from thermal agitation and bond formation between base and nanopore/electrode walls or interactions with a substrate. In an effort to avoid these limitations, we propose the sequential measurement of transverse current cross-correlations, as obtained from multiple pairs of electrodes. The experimental set up for such a nanopore arrangement is schematically shown in 1. To be specific, we focus on graphene as the porous material, because it is atomically thick and exhibits extraordinary thermal and electronic properties.
Besides these geometric advantages and good conductivity, graphene also possesses high tensile strength and can endure a high transmembrane pressure environment 15. Consequently, graphene has been proposed as an effective substrate and conducting medium for nanopore sequencing by numerous groups 16, 17, 18, 19, 9, 20. We emphasize, however, that the method for nanopore sequencing may be useful in any other method in which serial measurements (e.g., time series) are made to ascertain individual properties (resistivity here) of the bases.
Although this challenge is much more severe for protein based or solid state nanopores, the nature of an atomically thick graphene nanopore wall cannot completely rule out the stacking between carbon and DNA bases. In addition, vibration and other electronic fluctuations present in the graphene membrane can significantly mask the conductance signals, making it difficult to differentiate the individual DNA bases.
Previous theoretical 5, 11 and experimental 9 studies of the interactions between DNA bases and graphene derivatives have revealed the local electronic structure of single bases. The experimental realization of a single layer graphene-based nanopore device is made possible by combining several state of the art techniques e.g., mechanical exfoliation from graphite on SiO2 substrate. Transverse tunneling current(conductance) measurements, as the single strand (ss)DNA translocates through a monolayer graphene nanopore, were previously reported by Schneider et al. 18. AFM studies 10 and theoretical simulations of scanning tunneling spectroscopy (STS) 4 support the identification of electronic features with varying spatial extent and intensity near the HOMO-LUMO band.
To make nanopore sequencing and detection a viable method for determining translocating molecules, one must overcome this the noise to signal problem. Therefore, we propose a multilayered graphene device in which the transverse conductance is measured through each nanopore independently, as a series of DNA bases or other molecules translocates through them (see 1). As molecules translocate, they create a time dependent sequence of translocation currents through each of the layers. One then monitors the translocation currents at different pores and acquires a record of sequential current of the same base as it arrives and moves through the individual pores (shown in 2). The time series of the cross correlation currents can then be used to reduce the uncorrelated, independent noise source, and hence enhance the signal to noise ratio and improve the differentiation between bases. While our device is being discussed under the idea of DNA sequencing, the general method and device setup can be used for any molecule small enough to fit through a nanopore. While we are focusing on the area of DNA sequencing and biomolecules, this cross-correlation method for data analysis of the transverse currents can be utilized for the analysis of any molecular series given the proper understanding of the molecules electronic properties.
2 Results and Discussion
We first discuss our first-principles calculations of transmittance for individual DNA bases inside the graphene nanopore, as presented in 3. Then in 4, we show the partial signal recovery using our time-simulation model with three layer graphene nanopores and the cross-correlation between the corresponding signals.
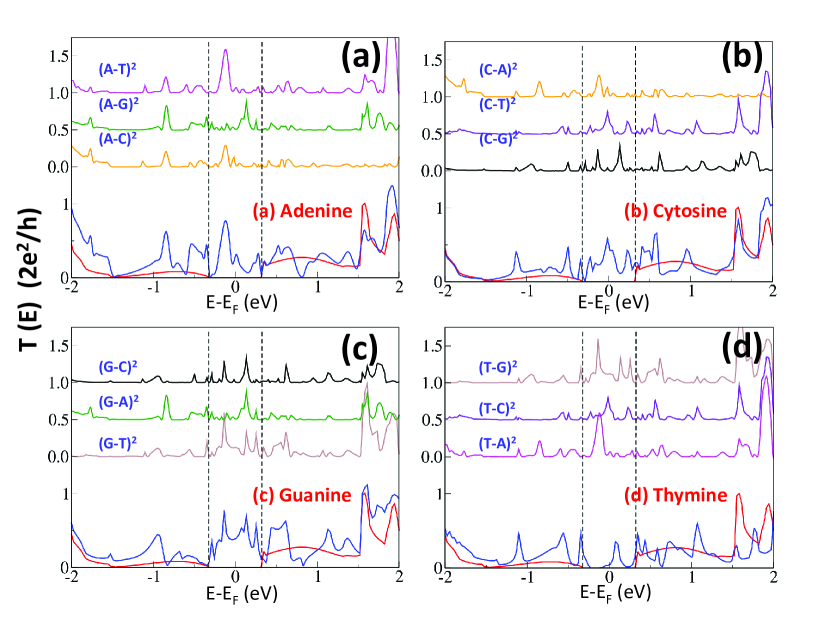
In our first-principles approach, for each DNA base, we have taken three random angular orientation with the graphene membrane, while calculating the transmittance between the two electrodes with 0.7 V bias voltage. The configuration averaged transmittance for A, C, G, and T are shown in the solid blue curve in 3(a)-(d). The conductance of a pure graphene nanoribbon with hydrogenated nanopore is shown in solid red curve in 3 for comparison. The transmittance curve is analogous to the non-equilibrium density of states in the presence of the bias voltage where the zero of energy is the Fermi energy of the central graphene region. The vertical dashed lines are at -0.35 eV and +0.35 eV, which are the chemical potentials of the left and right electrodes respectively. For each base ( 3(a)-(d)), the transmittance curve (solid blue line) in between the left and right electrode chemical potentials is significantly enhanced compared to the pure graphene membrane with a nanopore (solid red line). The features in this region are characteristic of the four bases. For example, a comparison of the Guanine transmittance ( 3(c)) with that of Thymine ( 3(d)), shows the presence of a characteristic broad peak.
For a systematically study of the difference between the transmittance among the four bases, we also plotted the difference curves (the top three) in 3(a)-(d). If the signatures of one or more of the DNA bases are known prior to the detection, the difference curve may provide the signature of an unknown base. For example, if one knows the transmittance of Thymine, a comparison of the characteristic features of difference-squared transmittance , , , helps identify the unknown base. 3(a),(c), and (d) show the difference-curves contain several (up to three) dominant peaks in between the vertical dashed lines. In principle, it is possible to calculate a large number of configurations and maintain a complete data-base of such characteristic difference curves for the sequencing purpose.
Such methods are challenged by two major limitations. The first one is prior knowledge of the exact location of one or more kinds of DNA base, either from the transmittance curve or form other technique. The second one is the presence of significant noise in the data, which makes it difficult for the detection of any single base. Some bases exhibit characteristic features in the transmittance curve, which make them easily detectable. For example, the Thymine ( 3(d) solid blue line) has a very low conductance compared to the others which (in agreement with previous calculations 7, 8) shown by the low peak amplitude near 0 eV. However, even the detection of Thymine can be difficult in the presence of noisy data. To illustrate the specifics of the approach, we present the simulation of a time-series for three graphene nanopore layers with the test sequence A0C0A2G2T1C2G1T2 in Fig.4.
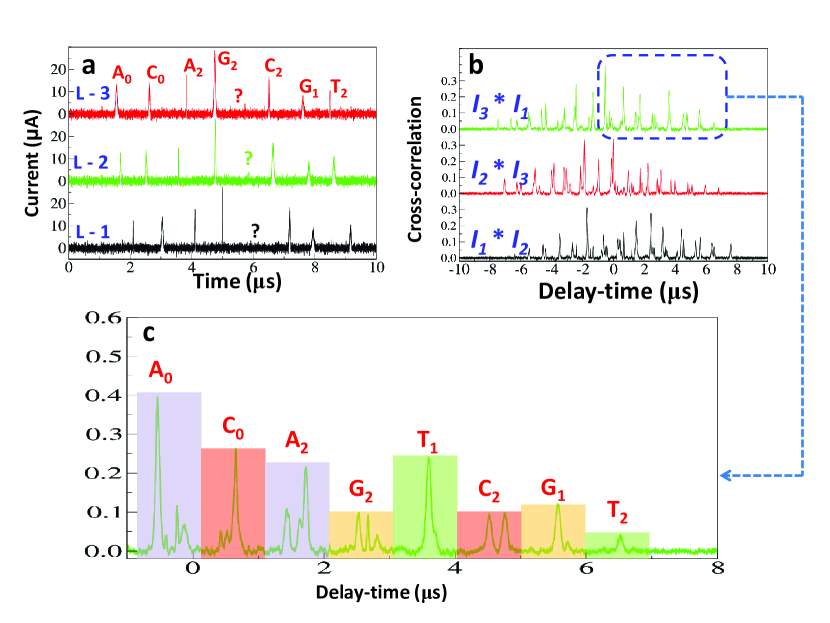
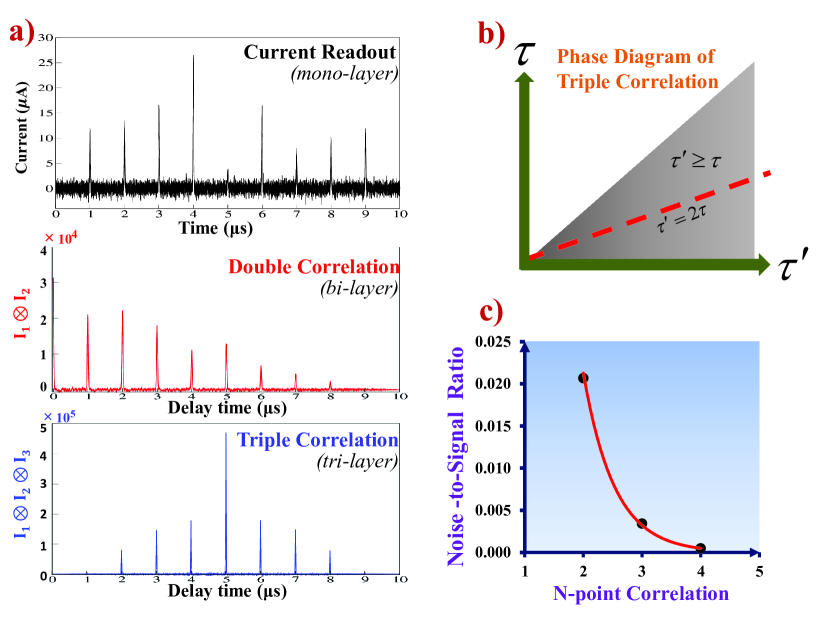
In nanopore based DNA sequencing, the current () is the measured quantity rather than the transmittance (). Thus, we calculated the current from the transmittance. Using the parameters described previously we simulated time-dependent current spectra , , and for our test sequence, as shown in 4(a). The low current amplitude for Thymine in the case of T1 and T2 is expected from the transmittance curve in 3(d), but the natural noise present in the data makes it difficult to confirm the presence of T1 at the expected location. In 4(b), we present the cross-correlation between the current spectra from different pairs of graphene layers. For each pair, the cross-correlation is plotted as a function of time-delay within the -10 s to +10 s range. The cross-correlation spectrum is approximately symmetric around mid point of the total range due to the overlaps between similar pairs of peaks from opposite ends of the original data. Therefore, we only focus on the positive time-delay. The correlation spectrum inside the highlighted dashed box in 4(b) is enhanced in 4(c). By comparing peaks between 4(a) and (c), we confirm the presence of Thymine with T1 configuration. Although the amplitudes of the current spectrum do not translate directly into the amplitudes of the cross-correlation spectrum, they confirm the existence of T1. Thus, a time-series analysis using current cross-correlations recovers all eight peaks in our test sequence ( 4(b)). The suppression of white noise is substantial and the peaks at time-delay=0 in the correlation function ( 4(b)) are enhanced.
We can easily extend this approach to three-point or higher -point correlations, which we demonstrate here, to exponentially reduce the noise-to-signal ratio. The two-point cross-correlation is generally expressed with a single parameter as in
| (1) |
where the time interval is between to . The three-point correlation is a function of two independent variables
| (2) |
We can simplify the description of triple correlation function in the complete two dimensional parametric space by constraining it to the line as in 5(b). Thus the constrained triple correlation function becomes,
| (3) |
Following this procedure we can measure currents from independent graphene layers and calculate constrained -point correlation as
| (4) |
The three panels in 5(a) show our calculated current signal from a single layer as well as the two and three point cross-correlation functions from the corresponding two and three independent graphene nanopores. The test sequence used here is A0C0A2G2T1C2G1T2C1. Using two, three and four point cross-correlation functions, we estimated the ratios between the average signal and average noise in each case, as shown in Table.1 in the supplementary section. We confirm the exponential drop in the noise to signal ratio as shown in 5(c). The computational details and the table containing the results are also given in the supplementary section.
3 Computational Method
In this work, we ignore the background contribution from the large phosphate backbone typically present in a single stranded DNA (ssDNA). This simplification is based on the assumption that by identifying and subtracting the background noise coming from the heavy and rigid backbone structure. one can isolate the relevant signal from the individual bases. More specifically we have built on earlier work 4, 11, 7, 20 to model the pore conductance containing a molecule in two steps: 1) First, we carried out ab initio calculations of transmission () and current () as a single DNA base translocates through the nanopore of a graphene mono-layer. 2) Then, we simulate the time-dependence of the current data by adopting a simple model with multi-layered graphene nanopores with added statistical noise and broadening.
Calculations of transmission were performed taking each DNA base inside the nanopore with three different angular orientations, and using the Landauer-Buttikker 21 formalism implemented in the ab initio software ATK 22. We emphasize that out approach does not rely nor requires a geometry optimization of molecules in the pores. The translocation is a dynamical process with significant variations of configurations found for molecules inside a pore. Thus, the same molecule can arrive in different orientations at each pore, a process which contributes to the configuration noise sources that we address here. Therefore, we do not optimize the configurations and instead use the set of various configurations as the set, from which the random sampling is taken.
In these calculations, we have taken a graphene nanoribbon with 208 carbon atoms in the conduction region, where the nanopore is constructed by removing center carbon atoms and capping the inner wall with hydrogen atoms, since hydrogenated edges were found 20 to enhance the average experimental conductivity. The bias voltage between the left and right electrodes is fixed as +0.35 and -0.35 eV. In this work, the nanopore dimension is much smaller than that modeled by other groups 23, 19. The details and various parameters of our first-principles calculations can be found in the supplementary section.
To demonstrate the recoverability of current () signals from noise, we show the relation between noise coming from different layers. For simplicity, we consider the dominant noise primarily from two sources. As the bases translocate through the i-th graphene nanopore layer, the vibration in the DNA backbone may influence individual base plane to land with random angular orientation with the graphene plane, causing a configuration-noise . The additional noise, such as thermal vibration of the graphene membrane at the -th nanopore, is defined as . Thus the total noise of -th nanopore can be expressed as
| (5) |
The correlation between the two layers is therefore given by
| (6) |
Here . For , the contribution from the last three terms on the right side of Eq. 2 are negligible due the weakly or uncorrelated signals in separate nanopores. Since the DNA bases are strongly attached to the ssDNA backbone, the configuration-noise between two membranes mainly contributes to the first term in Eq. 2. Therefore, the noise can be approximated as
| (7) |
where, for , all the terms on right side of Eq. 2 survive and contribute significantly to the total noise. Since the noise between and is uncorrelated, a comparison of their signals will enhance the individual base signals by reducing the noise to signal ratio.
There are two extreme limits in which we can take advantage of the above observation. These limits relate to the rate of base translocation compared to the typical vibrational frequency of the bases facing the electrodes. When this occurs, the above cross correlations allow us to reduce the intrinsic noise due to random orientations. On the other hand, when the translocation rate is slower than the vibrational frequency, the uncorrelated noise is eliminated and the only one that survives is the correlated one. We focus here on the second case since experimentally the latter situation is more likely 2, 3.
As an example, we show the low current amplitude for Thymine in 4(a), and in 4(c) the enhancement of the signal to noise ratio. We have taken a test sequence A0C0A2G2T1C2G1T2, where the subscripts imply different angular orientations of the bases inside the pore. The time dependence of this sequence is modeled by taking the time interval between two consecutive bases , including a random Gaussian uncertainly between the interval with . Each current signal is also broadened using a random Gaussian broadening with . To simulate a realistic experiment with background noise, we have also included additive white Gaussian noise. We assume that with the applied field in the vertical direction, the average elapsed time between two translocating bases is . The time-distance between two consecutive graphene layers is set to .
4 Conclusions
We implement first-principles calculation of transmittance for a systematic study of the identification of single DNA bases or other biomolecules translocating through graphene nanopores. To eliminate the high background noise, we propose a multilayered graphene-based nanopore device combined with a multi-point cross-correlation method to substantially improve the signal to noise ratio of the electronic readout of biomolecules. To illustrate this approach, we adopted a statistical method for simulating the time-dependent current spectrum. The enhanced resolution is produced by the multiple translocation readouts of the same bases of the same molecule through the pores. The cross-correlated signals from each pair of electrodes will suppress the uncorrelated noise produced by each single translocation event.
In this way, thymine can serve as a “reference molecule” for identifying other molecules from the difference transmittance curves. We also demonstrate the recovery of signals associated with different configurations by taking cross-correlations between different pairs of graphene layers. This study provides a promising method for an enhanced signal to noise ratio in the multipore graphene based devices (or any other serial sequencing device), and their potential applicability as a next generation biomolecular detection technique. While we focus on the correlations in DNA bases, this cross-correlation method can be used for any molecule or molecular series for detection or identification purposes.
We are grateful to K.T. Wikfeld, K. Zakharchenko and Svetlana Kilina for useful discussions. This work is supported by the Center for Integrated Nanotechnologies at Los Alamos, a U.S. Department of Energy, Office of Basic Energy Sciences user facility. Los Alamos National Laboratory, an affirmative action equal opportunity employer, is operated by Los Alamos National Security, LLC, for the National Nuclear Security Administration of the U.S. Department of Energy under contract DE-AC52-06NA25396. Work at NORDITA was supported by VR 621-2012-2983 and ERC 321031-DM. MD acknowledges partial support from the National Institutes of Health. IKS is supported by AFOSR FA9550-10-1-0409.
References
- FOUNDATION 2013 FOUNDATION, X. P. Archon Genomics X PRIZE. 2013; \urlhttp://www.genomics.xprize.org
- Zwolak and Di Ventra 2008 Zwolak, M.; Di Ventra, M. Rev. Mod. Phys. 2008, 80, 141–165
- Branton et al. 2008 Branton, D. et al. Nat. Biotechnol. 2008, 26, 1146–1153
- Ahmed et al. 2012 Ahmed, T.; Kilina, S.; Das, T.; Haraldsen, J. T.; Rehr, J. J.; Balatsky, A. V. Nano Letters 2012, 12, 927–931
- Kilina et al. 2007 Kilina, S.; Tretiak, S.; Yarotski, D. A.; Zhu, J.-X.; Modine, N.; Taylor, A.; Balatsky, A. V. The Journal of Physical Chemistry C 2007, 111, 14541–14551
- Sanger et al. 1977 Sanger, F.; Nicklen, S.; Coulson, A. R. Proc. Natl. Acad. Sci. U.S.A. 1977, 74, 5463–5467
- Zwolak and Di Ventra 2005 Zwolak, M.; Di Ventra, M. Nano Letters 2005, 5, 421–424
- Lagerqvist et al. 2006 Lagerqvist, J.; Zwolak, M.; Di Ventra, M. Nano Letters 2006, 6, 779–782
- Tanaka and Kawai 2009 Tanaka, H.; Kawai, T. Nat Nano 2009, 4, 518–522
- Yarotski et al. 2009 Yarotski, D. A.; Kilina, S. V.; Talin, A. A.; Tretiak, S.; Prezhdo, O. V.; Balatsky, A. V.; Taylor, A. J. Nano Letters 2009, 9, 12–17
- Kilina et al. 2011 Kilina, S.; Yarotski, D. A.; Talin, A. A.; Tretiak, S.; Taylor, A. J.; Balatsky, A. V. Journal of Drug Delivery 2011, 2011
- Tsutsui et al. 2010 Tsutsui, M.; Taniguchi, M.; Yokota, K.; Kawai, T. Nat Nano 2010, 5, 286–290
- Chang et al. 2010 Chang, S.; Huang, S.; He, J.; Liang, F.; Zhang, P.; Li, S.; Chen, X.; Sankey, O.; Lindsay, S. Nano Lett. 2010, 10, 1070–1075
- Ohshiro et al. 2012 Ohshiro, T.; Matsubara, K.; Tsutsui, M.; Furuhashi, M.; Taniguchi, M.; Kawai, T. Scientific Reports 2012, 2, 1070–1075
- Lee et al. 2008 Lee, C.; Wei, X.; Kysar, J. W.; Hone, J. Science 2008, 321, 385–388
- Branton et al. 2008 Branton, D. et al. Nat Biotech 2008, 26, 1146–1153
- Merchant et al. 2010 Merchant, C. A.; Healy, K.; Wanunu, M.; Ray, V.; Peterman, N.; Bartel, J.; Fischbein, M. D.; Venta, K.; Luo, Z.; Johnson, A. T. C.; Drndić, M. Nano Letters 2010, 10, 2915–2921
- Schneider et al. 2010 Schneider, G. F.; Kowalczyk, S. W.; Calado, V. E.; Pandraud, G.; Zandbergen, H. W.; Vandersypen, L. M. K.; Dekker, C. Nano Letters 2010, 10, 3163–3167
- Nelson et al. 2010 Nelson, T.; Zhang, B.; Prezhdo, O. V. Nano Letters 2010, 10, 3237–3242
- He et al. 2011 He, Y.; Scheicher, R. H.; Grigoriev, A.; Ahuja, R.; Long, S.; Huo, Z.; Liu, M. Advanced Functional Materials 2011, 21, 2602–2602
- Du et al. 2008 Du, X.; Skachko, I.; Barker, A.; Andrei, E. Y. Nat Nano 2008, 3, 491–495
- Brandbyge et al. 1997 Brandbyge, M.; Sørensen, M. R.; Jacobsen, K. W. Phys. Rev. B 1997, 56, 14956–14959
- Postma 2010 Postma, H. W. C. Nano Letters 2010, 10, 420–425, PMID: 20044842