Mobility of core water in Bacillus subtilis spores by \ce^2H NMR
Bacterial spores in a metabolically dormant state can survive long periods without nutrients under extreme environmental conditions. The molecular basis of spore dormancy is not well understood, but the distribution and physical state of water within the spore is thought to play an important role. Two scenarios have been proposed for the spore’s core region, containing the DNA and most enzymes. In the gel scenario, the core is a structured macromolecular framework permeated by mobile water. In the glass scenario, the entire core, including the water, is an amorphous solid and the quenched molecular diffusion accounts for the spore’s dormancy and thermal stability. Here, we use \ce^2H magnetic relaxation dispersion to selectively monitor water mobility in the core of Bacillus subtilis spores in the presence and absence of core \ceMn^2+ ions. We also report and analyze the solid-state \ce^2H NMR spectrum from these spores. Our NMR data clearly support the gel scenario with highly mobile core water ( ps average rotational correlation time). Furthermore, we find that the large depot of manganese in the core is nearly anhydrous, with merely 1.7 % on average of the maximum sixfold water coordination.
1 Introduction
The common Gram-positive bacterium Bacillus subtilis can survive a variety of adverse environmental conditions by transforming into a metabolically dormant endospore.1, 2 The molecular basis of spore dormancy is not well understood, but may provide a key to controlling food spoilage and food-borne disease caused by bacterial spores of certain species. Specifically, mechanistic insights may lead to more efficient methods for inactivating spores.3, 4
In the spore, the bacterial genome and most of the essential enzymes are confined to a core region surrounded by an inner membrane (IM) with low permeability to water, ions, and small solutes.2, 5, 6 The space outside the IM, known as the cortex, contains a cross-linked peptidoglycan matrix that is thought to maintain the lower water activity in the core.7 The cortex is surrounded by the coat, another protective barrier composed of multiple layers of cross-linked proteins.8, 9
The amount and physical state of water in the different spore compartments, in particular the core, is thought to be crucial for spore dormancy and resistance.1, 2 The core is less hydrated than the cortex and its water content is inversely related to the spore’s heat resistance.10, 11 It has been proposed that the entire core exists in an amorphous solid-like or glassy state.12, 13, 14 If so, the suppression of molecular diffusion could explain spore dormancy and the spore’s heat resistance could be rationalized in kinetic terms. Reduced mobility has been demonstrated for most of the principal constituents of the core, such as ions,15, 16 pyridine-2,6-dicarboxylic acid (dipicolinic acid, DPA),14, 17 proteins,18 and IM lipids,5 but the mobility of core water has remained controversial.
Early on, it was observed that virtually all spore water exchanges with external water within minutes,19, 20 implying that core water is in a liquid, rather than a glassy, state. This led to what may be termed the “gel scenario” of the core as a matrix of immobilized macromolecules (as well as DPA and chelated divalent metal ions) permeated by mobile or, at least, liquid water.19 According to the competing “glass scenario”, initially proposed as a speculation,12 the entire core, including the water, is immobilized. This view appeared to receive experimental support from differential scanning calorimetry results,14 but alternative interpretations, not involving immobilized water, of these results have been suggested.21, 22. NMR can potentially probe water mobility more directly, but the early proton NMR studies23, 24 appear to have been confounded by the effects of paramagnetic Mn(II) ions.
An electron paramagnetic resonance (EPR) spin-probe study used chemical and mechanical treatment to remove the outer parts of the spore and a paramagnetic broadening agent to separate the EPR signal from spin probes residing inside and outside the spore.25 In this way, the rotational correlation time of the spin probe could be inferred and related to the viscosity of spore water, which was found to exceed the bulk water viscosity by a factor of ten in the core and by a factor of five in the cortex.25 However, these results were obtained by an elaborate difference procedure, the quantitative validity of which hinges on several unproven assumptions. Furthermore, if the spin-probe interacts strongly with any of the spore components, its rotational motion might not reflect the mobility of the solvent.
More recently, \ce^2H magnetic relaxation dispersion (MRD) measurements on \ceD2O-exchanged spores were used to directly monitor the rotational mobility of water molecules in the core and non-core regions.6 Importantly, this study demonstrated that water exchange across the IM is slow on the \ce^2H relaxation time scale ( ms), thus allowing core and non-core water to be characterized individually in the same experiment. Consistent with the gel scenario, it was thus established that core water is highly mobile, with a rotational correlation time of ps.6 Although the core water content deduced from the MRD data6 was consistent with independent estimates,10 the existence of a small fraction of immobilized water could not be excluded since immobilized water does not contribute to the NMR signal detected in MRD experiments. Indeed, a subsequent \ce^2H solid-state NMR study recorded a broad feature in the \ce^2H NMR spectrum from partly dehydrated spores.26 This observation was taken to indicate a substantial amount of immobilized water in the spore,26 as predicted by the glass hypothesis.
The principal aim of the present study is to resolve the long-standing issue of core water mobility by extending the \ce^2H MRD measurements and by performing \ce^2H solid-state NMR experiments on fully hydrated B. subtilis spores. Specifically, by measuring the bi-exponential \ce^2H relaxation over a wider frequency range, we reveal the characteristic signature of Mn(II)-induced paramagnetic relaxation also for core water. Using also a spore preparation with % of the paramagnetic \ceMn^2+ ions in the core substituted by diamagnetic \ceCa^2+ ions, we could quantify the small manganese-water contact in the core. These data also yielded an improved characterization of core water mobility, showing that the rotation of water molecules in the core is merely slowed down 15-fold, on average, as compared to bulk water. We also examined spores that had been sporulated at different temperatures, finding a non-monotonic variation of the core water content. This finding, which deviates from the previously established reduction of core water content with increasing sporulation temperature,11, 27 is tentatively taken to imply that additional factors influence the core water content. Finally, we demonstrate that the \ce^2H quadrupolar echo NMR spectrum from fully hydrated spores can be rationalized without invoking any immobilized spore water. Both our MRD and solid-state NMR results thus support the gel scenario for the core of B. subtilis spores.
2 Materials and methods
2.1 Spore preparation and analysis
The spore samples were prepared from B. subtilis strain PS533.28 Three samples were sporulated on standard 2 SG medium agar plates at 23, 37, or 43 and a fourth sample was sporulated in an essentially Mn-free liquid 2 SG medium at 37 .29, 30 Spores were purified as described,31 lyophilized, and stored dry. All spores used were free ( %) from growing or sporulating cells, germinated spores and cell debris as determined by microscopy.
To prepare NMR samples, the lyophilized spores were suspended in 5 mm sodium phosphate buffer in 99.9 % \ceD2O (pH∗ 7.6, where pH∗ reports the reading of the pH meter calibrated with \ceH2O buffers) and rehydrated during 20 h at 6 . It has been reported that lyophilization and rehydration of spores do not induce germination.32 The samples were then centrifuged at 5000 g for 20 min. The supernatant was discarded and the spore pellet was transferred to an 8 mm o.d. 20 mm height NMR tube insert (for relaxation measurements) or to a 5 mm o.d. 20 mm height NMR tube (for quadrupolar echo) and sealed with parafilm. The insert was placed in a 10 mm o.d. NMR tube for relaxation measurements.
Upon completion of the NMR experiments, the water content of each sample was determined gravimetrically by drying at 105 for 16 h. The dried spore mass was then used for elemental analysis by inductively coupled plasma sector field mass spectrometry (performed at ALS Scandinavia AB, Luleå, Sweden) and for complete amino acid analysis (performed at Amino Acid Analysis Center, Department of Biochemistry and Organic Chemistry, Uppsala University, Sweden).
2.2 NMR experiments
The longitudinal relaxation of the water \ce^2H magnetization was studied at Larmor frequencies from 2.5 to 92.1 MHz using four NMR instruments: a Tecmag Discovery spectrometer equipped with a Drusch iron-core magnet (2.48 – 13.1 MHz \ce^2H frequency) or with a Bruker 4.7 T cryomagnet (30.7 MHz) and Varian DirectDrive 500 (76.7 MHz) and 600 (92.1 MHz) spectrometers. Standard inversion recovery pulse sequences were used. All relaxation experiments were performed at , maintained by a thermostated air-flow. The temperature was checked with a thermocouple referenced to an ice-water bath. All relaxation experiments were completed within 72 h of sample preparation and all samples were examined together at each field. Between measurements, the samples were stored at 4 . No sign of spore germination was observed during the relaxation experiments.
The \ce^2H quadrupolar echo experiment was performed at 27 on a Bruker Avance II 500 spectrometer equipped with a wideline probe (Bruker PH HP BB 500 SB). The quadrupolar echo sequence (90∘ – – 90∘ – – acquisition) was used with 90∘ pulse length of 2.55 \textmugreeks, echo delay of 25 \textmugreeks, and recycle delay of 120 s. The reported spectrum is an average of 2000 transients, accumulated during 67 h immediately following sample preparation. No sign of spore germination was observed after the NMR experiment.
3 Results and discussion
3.1 \ce^2H relaxation of core and non-core water
Water \ce^2H relaxation measurements in the frequency range 2.5 – 92.1 MHz were performed on three B. subtilis spore preparations that had been sporulated at 23, 37, or 43 and on one preparation sporulated in a Mn-depleted medium at 37 . Henceforth, we refer to the former three preparations as native spores, labeling the samples N23, N37, and N43, respectively. The Mn-depleted spore sample is labeled Mn.
The water \ce^2H longitudinal magnetization was found to relax bi-exponentially at all investigated frequencies (Figs. 1 and S1), indicating that the samples contain two water populations in slow (or intermediate) exchange on the relaxation time scale.33 The minor relaxation component (with the smallest weight) has the fastest relaxation (the largest longitudinal relaxation rate ). As in the previous MRD study,6 we assign the minor and major components to water in the core (CR) and non-core (NCR) regions, respectively. The NCR region comprises all compartments outside the core, including the extracellular space. This assignment is motivated by the following considerations: (i) the inner membrane (IM) is the principal permeability barrier in the spore2; (ii) the core is expected to contain less water than the rest of the sample1, 11; (iii) the core water is expected to be less mobile than non-core water, resulting in a larger 6; and (iv) EDTA treatment, which removes \ceMn^2+ from the NCR region but not from the core, strongly reduces of the major component but has no significant effect on of the minor component.6 The observation of slow water exchange across the IM implies that the mean residence time of a water molecule in the core is much longer than 10 ms for the spore samples examined here.6, 33 This result is not inconsistent with the finding, albeit for Bacillus cereus spores, that \ceD2O/\ceH2O exchange of the entire spores occurs within 1 s.34
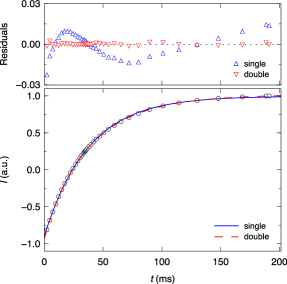
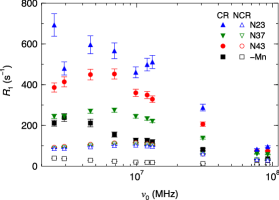
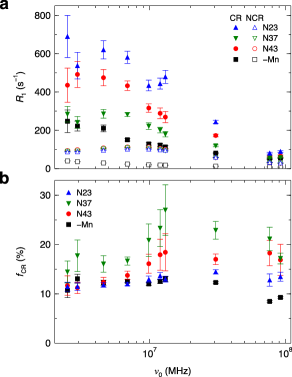
The bi-exponential form of the inversion recovery is most clearly seen from the residuals, which are an order of magnitude larger and show a systematic variation in time for the single-exponential fit (Fig. 1). In the slow exchange regime, the relative weight of the minor component, , can be identified with the water fraction in the core, which must be the same at all frequencies.33 While this is approximately the case, the values obtained from the individual fits vary somewhat with frequency (Fig. S1b). This variation can be attributed to the well-known difficulty of uniquely determining the parameters of a bi-exponential decay when the decay rates are not very different and one of the components has a small weight ( here). The ratio, , of the component relaxation rates is in the range 2 – 8 (Fig. S1a), being smallest at the highest frequencies (as in the example shown in Fig. 1). To improve the accuracy of the parameters, we performed global inversion recovery fits including data at all frequencies and with constrained to be independent of frequency, as expected in the slow exchange regime. Figure 2 shows the resulting component MRD profiles for the four spore samples, while the values are listed in Table 1.
| sample | a | b | c | d |
|---|---|---|---|---|
| N23 | 1.59 | 0.70 | ||
| N37 | 1.79 | 0.62 | ||
| N37 | 1.45 | 0.60 | ||
| Mn | 1.39 |
-
a
Gravimetrically determined sample water content in units of g total \ceD2O (g dry spore mass)-1.
-
b
NMR-derived core water fraction in units of g core \ceD2O (g total \ceD2O)-1.
-
c
Core water content in units of g core \ceD2O (g dry spore mass)-1.
-
d
Core water content in decoated spores27 in units of g core \ceD2O (g dry core mass)-1.
3.2 Sporulation temperature and core water content
Upon completion of the experiments, the water content in units of g \ceD2O (g dry spore mass)-1 was determined gravimetrically for each sample (Table 1). Both and , determined from inversion recovery fits, depend on the amount of extracellular water, but the product , also given in Table 1, does not since it represents the amount of core water on a spore dry mass basis. In previous work,1, 27 the core water content on a core dry mass basis, in units of g core \ceH2O (g dry core mass)-1, was determined by density gradient centrifugation after the coat and cortex were rendered permeable to the gradient material by chemical treatment. These values,27 interpolated to our temperatures and scaled by a factor of 1.111 to convert from \ceH2O to D2O, are included in Table 1. The values are higher than the values, as expected since the core only accounts for a fraction of the spore’s dry mass. However, whereas decreases with increasing sporulation temperature, we find that varies non-monotonically with sporulation temperature, with a % higher value at 37 than at 23 or 43 .
In principle, these two sets of results could be reconciled if the (dry core)/(dry spore) mass fraction varies non-monotonically with sporulation temperature, being at 37 and at the other two temperatures. Increased sporulation temperature has been shown to reduce the amount of coat protein, but has little effect ( %) on the levels of DPA and small acid-soluble proteins in the core or peptidoglycan in the cortex.27 Another study indicated comparable mineral content in B. subtilis spores sporulated at 25, 30, and 37 .35 While the core/spore dry mass ratio may thus increase somewhat with increasing sporulation temperature, a strong non-monotonic variation seems unlikely. Moreover, the amino acid analysis of our samples does not indicate any significant differences among the samples in either total protein content (Table S2) or amino acid composition (Table S3), as might have been expected if the core/spore dry mass ratio varied by 50 %.
If the non-monotonic variation of really reflects a non-monotonic variation of the core water content (as measured by ), then should also vary non-monotonically, with the smallest value at the sporulation temperature (37 ) with the largest core water content (where the slowing down of water rotation should be least pronounced). This is indeed observed (Fig. 2). Some caution is required here, however, since is the sum of a quadrupolar contribution, which reflects the average water mobility in the core, and a paramagnetic relaxation enhancement (PRE) contribution (see below). Both of these contributions are expected to decrease with increasing core water content, but the PRE contribution also depends on the Mn content of the core. According to the elemental analysis (Table S1), the Mn content does not differ significantly between samples N23 and N37, whereas sample N43 seems to have a slightly lower Mn content, which might explain the difference in between samples N23 and N43 (Fig. 2).
In conclusion, this analysis suggests that the water content of the core (relative to the dry mass of the core) is indeed significantly higher in sample N37 than in samples N23 and N43. However, a non-monotonic variation of core water content with sporulation temperature is a priori unlikely and contradicts previous results from decoated spores.1, 27 At this stage, we would therefore not rule out the possibility that other factors, besides the sporulation temperature, affected the core water content of our samples. In this regard, we note that sample N37 deviates somewhat from the other two samples in the elemental analysis (notably for Si and Fe, see Table S1), although the significance of these differences is uncertain. We also note that any correlation with sporulation temperature in our study hinges on the assumption that the core water content at sporulation is reproduced after rehydration of the freeze-dried spores.
3.3 Hydration of \ceMn^2+ in the core
In the previous MRD study of B. subtilis spores, manganese was partly removed from the spores by EDTA treatment.6 This treatment only reduced the total Mn content of the spore by 32 % and it was concluded that the \ceMn^2+ ions in the core were essentially unaffected.6 In contrast, in the –Mn sample investigated here, the total Mn content is reduced by a factor of (Table S1). More than 99 % of the core \ceMn^2+ is thus removed. In the Mn sample, we expect that core \ceMn^2+ is replaced by \ceCa^2+ and this expectation is supported by the elemental analysis (Table S1). It has been shown previously that these Mn-depleted spores have normal core water and DPA contents and normal heat resistance.30
For the three native spore samples, the water \ce^2H MRD profiles in Fig. 2 exhibit maxima just below 10 MHz in both the NCR and CR components. These maxima indicate a Mn(II)-induced PRE contribution to .36, 37 In contrast, the MRD profiles from the Mn spores do not show such a maximum (Fig. 2), demonstrating that \ceMn^2+ is the dominant source of the PRE in the native spores. In the previous MRD study,6 inversion recovery experiments were only performed down to 12 MHz so the PRE maximum could only be observed in the effective measured by the field-cycling technique, which essentially reports on the dominant NCR component. Based on the data above 12 MHz, it was concluded that there is little or no direct \ceMn^2+–water contact in the core.6 The maximum observed in the more extensive data reported here prompt us to revise this conclusion.
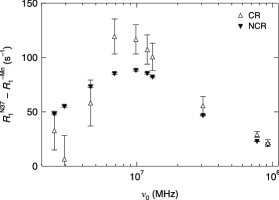
To highlight the PRE contribution, we plot in Fig. 3 the differences and . Even though the \ceMn^2+ concentration is much higher in the core than in the NCR region, the PRE contributions are similar in the two regions (Fig. 3). The data in Fig. 3 yield for the CR/NCR ratio of PRE contributions. This observation indicates that most \ceMn^2+ ions in the core are not in direct contact with water or else that the coordinating water molecules exchange so slowly ( \textmugreeks) that they do not contribute to the PRE. For a quantitative estimate, we note that the PRE contribution to is proportional to , where is the effective water coordination number of the \ceMn^2+ ions and is the water/Mn mole ratio. Furthermore, . Here, we have assumed that the Mn fraction in the core is , as determined previously,6 and we have used the average water fraction for samples N37 and Mn (Table 1). Given that , as determined previously using the conventional Solomon–Bloembergen–Morgan theory,6 we thus arrive at . In other words, the direct water coordination of \ceMn^2+ ions in the core is only 1.7 % of that for fully hydrated ions (with . This conclusion is consistent with the observation that the manganese EPR spectrum from Bacillus megaterium spores closely resembles that from an anhydrous 10:1 Ca:Mn DPA chelate model system16 and with \ce^13C NMR spectra indicating that the DPA in the core is in a solid-like state.17
3.4 Water mobility in the core
The previous MRD study of B. subtilis spores concluded that the (rotational) mobility of water in the core is slowed down by a factor of on average compared to bulk water.6 As noted,6 this estimate is an upper bound, since it was obtained by neglecting any PRE contribution to . Indeed, the present results demonstrate a significant PRE contribution in the core. A more accurate estimate of core water mobility can now be obtained from for the Mn sample, which does not have a PRE contribution. Dividing the high-frequency (averaging over the two highest frequencies in Fig. 1a) by the bulk \ceD2O relaxation rate at 27 (), we obtain a slowing-down factor of . This result happens to coincide with the slowing-down factor of reported for the macromolecular hydration layers of an Escherichia coli cell.38 Because the rotational correlation of bulk \ceH2O is 1.6 ps at 27 , this corresponds to an average rotational correlation time for core water of 25 ps. Core water is thus highly mobile.
Although the detailed structure of the core is unknown, its high content of proteins, nucleic acids, DPA, and calcium ions implies a pronounced microheterogeneity and a correspondingly wide distribution of water mobility. The slowing-down factor of 15 is the mean of this wide distribution. It is therefore dominated by the slowest water molecules up to ns, which is the cutoff set by the highest examined resonance frequency.6 Consequently, the mobility of most of the core water is likely to be much closer to the bulk-water value than suggested by the average slowing-down factor.
For the NCR region, the high-frequency yields a slowing-down factor of 3.6 and, after correcting for the extracellular water,6, 10 a slowing-down factor of for the cortex and coat regions of the spore. Essentially the same result4, 8 was obtained previously based on from EDTA-treated spores.6 The agreement is consistent with the expectation that the NCR region of EDTA-treated spores has the same low Mn content as in the Mn-depleted spores studied here, so that the PRE contribution to is negligibly small in both cases. The slowing-down factor of five for the cortex and coat regions of the spore is comparable to the factor of three deduced in a similar way for the cell water of E. coli.38 Being the mean of wide distribution, the factor of five is presumably strongly influenced by the minor fraction of water confined to the dense coat region. The more water-rich cortex should thus have a water slowing-down factor significantly smaller than five, probably five- to ten-fold smaller than the slowing-down factor of 15 for the core. In contrast, the spin-probe EPR study mentioned in Sec. 1 inferred only a two-fold mobility difference between core and cortex.25
If, as previously argued,12, 13, 14, 26 the core were in a glassy state, then the core water would presumably be in the ‘rigid lattice’ NMR regime (correlation time s), producing a 100 – 200 kHz wide \ce^2H NMR spectrum that would not contribute to the \ce^2H NMR signal detected in relaxation experiments. Therefore, although our \ce^2H relaxation data demonstrate that at least a large fraction of the core water is highly mobile, they do not exclude the possibility that a small fraction of core water is immobilized.
To detect any immobilized water in the core (or elsewhere in the spore), we recorded a \ce^2H quadrupolar echo spectrum from a Mn-depleted spore sample (Fig. 4). The spectrum is a superposition of a narrow central peak and a much weaker broad component. The narrow peak originates from the mobile core and NCR water that we have characterized by MRD measurements. The shape and width of the broad component is consistent with exchangeable ND and OD deuterons (with a distribution of orientational order parameters) in immobilized macromolecules,39, 40, 41 henceforth referred to as labile deuterons (LDs). But the broad component is also consistent with immobilized \ceD2O molecules or with a combination of LDs and immobilized water. It is not possible to discriminate among these possibilities solely on the basis of the spectral lineshape. However, as we shall show, the relative intensity of the broad component indicates that it is produced by LDs rather than by immobilized water.
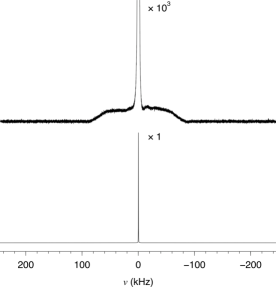
To estimate the relative intensities of the two spectral components, proportional to the number of contributing deuterons, we (separately) fitted a Lorentzian lineshape to the narrow peak and a spin-1 powder pattern (a so-called Pake doublet) to the broad spectral component. Due to the finite pulse length (see Sec. 2.2), the broad component is not fully excited and its intensity is therefore reduced by a factor of 0.76.39, 40 Taking this factor into account, we find that the broad component corresponds to % of the deuterons in the sample. The water content of the Mn-depleted sample used for the quadrupolar echo experiment was g \ceD2O (g dry spore mass)-1. Using also the results of the amino acid analysis (Tables S2 and S3), we estimate that 5.8 % of the deuterons in the sample are ND or OD deuterons in spore proteins. The proteins are largely confined to the core and coat regions of the spore, where they are expected to be rotationally immobilized.6, 9 The 53 % non-protein part of the dry spore mass (Table S3) includes (immobilized) DNA in the core and (partly immobilized) peptidoglycan in the cortex as well as components, such as DPA and calcium in the core, that do not contain LDs. The relative intensity of the broad component can thus be fully accounted for by LDs in the immobilized protein, nucleic acid, and peptidoglycan in the spore.
It is conceivable that a small fraction of the core water is immobilized, but the presence or absence of such a small amount of immobilized water cannot be demonstrated from \ce^2H spectral analysis, since the LD contribution is not accurately known. For example, if 10 % of the core water were immobilized, this would merely increase the relative intensity of the broad spectral component by %, which is comparable to the uncertainty in the LD contribution. In other words, the \ce^2H spectrum in Fig. 4 establishes an upper bound of % for the fraction of immobilized water in the core.
In contrast to our analysis, a \ce^2H quadrupolar echo spectrum from B. subtilis spores reported by Rice et al. was taken as evidence for a significant fraction of immobilized spore water.26 Whereas our spore samples are fully hydrated, the sample studied by these authors was vacuum (0.05 mbar) dried for 24 h. The water content of this sample was not reported, but the authors claimed that they only removed “excess water”.26 The relative intensities of the spectral components were not determined, but the reported spectrum suggests that the narrow central peak, due to mobile water, accounts for at most a few percent of the deuterons in the sample.26 In contrast, the central peak accounts for % of the deuterons in our sample, which includes 25 – 30 % extracellular water.6, 10 It is clear, therefore, that the drying protocol used by Rice et al. removes not only extracellular water but also most of the water inside the spore. Such extensive dehydration may produce structural changes that immobilize a significant fraction of the residual water. However, we do not believe that the spectrum reported by Rice et al. can be taken as evidence for immobilized water even in their dehydrated spores.
The \ce^2H spectrum from dehydrated B. subtilis spores features, in addition to the small central peak, a major broad component with a resolved quadrupole splitting of 130 kHz and a minor broad component with a resolved quadrupole splitting of 36 kHz.26 Rice et al. assigned the major 130 kHz component to immobilized water and the minor 36 kHz component to LDs. Since the water content of the dehydrated sample was not determined, it is not possible to base the assignment on the relative intensity. Without further information, it is, in our view, more reasonable to assign the major 130 kHz component to LDs (which must contribute) rather than to immobilized water (which is conjectural). For the origin of the minor 36 kHz component, we propose LDs in the (partly flexible) cortex peptidoglycan and/or in \ceCD3 and \ceND3 groups, the fast internal rotation of which reduces the \ce^2H quadrupole splitting by a factor of three. (The spores studied by Rice et al. were prepared from bacteria cultivated in a partly deuterated medium so that deuterons were also biosynthetically incorporated in nonlabile macromolecular positions.) In conclusion, we do not believe that the spectrum reported by Rice et al. demonstrates the existence of immobilized water in either dehydrated or fully hydrated spores.
4 Conclusions
In this work, we have characterized the state of water in the core of native and Mn-depleted B. subtilis spores with the aid of two well-established \ce^2H NMR experiments.
Multiple-field inversion recovery experiments were performed for the first time in the frequency range where the paramagnetic enhancement of water \ce^2H relaxation due to \ceMn^2+ ions in the core can be identified. This enhancement allowed us to quantify the \ceMn^2+–water contact in the core, previously thought to be negligibly small.6 In addition, by examining spores with % of the core \ceMn^2+ substituted by \ceCa^2+, we could measure the \ce^2H relaxation rate of core water free from paramagnetic effects. The characterization of core water mobility in the previous MRD study6 could thereby be substantially improved.
A \ce^2H quadrupolar echo experiment was performed for the first time on fully hydrated spores and we showed that the resulting solid-state \ce^2H NMR spectrum can be accounted for by labile macromolecular deuterons, without invoking immobilized water in the core or elsewhere in the spore. This result differs qualitatively from the conclusion of a recent solid-state \ce^2H NMR study of dehydrated spores.26
We also examined the effect of sporulation temperature, but we could not confirm the expected reduction of core water content with increasing sporulation temperature.27 The origin of this discrepancy is unclear, but we speculate that other parameters, besides sporulation temperature, affect the core water content in our samples.
The three most significant quantitative findings of this work are as follows.
-
(i)
Fully hydrated spores do not contain detectable amounts of immobilized water. This means that any immobilized water amounts to less than % of the spore water or less than % of the core water.
-
(ii)
The rotational motion of the observable mobile core water is slowed down by a factor of 15 as compared to bulk water. This average value is likely dominated by a small fraction of core water with rotational correlation time of order 1 ns, while water rotation occurs on a time scale of less than 10 ps in the vast majority of hydration sites in the core.
-
(iii)
The large depot of manganese in the core is nearly anhydrous, the direct water contact amounting, on average, to 1.7 % of the sixfold coordination of fully solvated \ceMn^2+.
In conclusion, the \ce^2H NMR data presented here fully support the gel scenario for the core of B. subtilis spores, and are clearly inconsistent with the glass scenario.
Acknowledgments
We thank Sanna Gustavsson and Daniel Topgaard for help with the solid-state NMR measurements. This work was supported by the Nestlé Research Center (B.H. and S.K.), the Knut and Alice Wallenberg Foundation (B.H.), and a Department of Defense Multi-disciplinary University Research Initiative through the U.S. Army Research Laboratory and the U.S. Army Research Laboratory under contract number W911NF-09-1-0286 (B.S. and P.S.).
References
- 1 P. Gerhardt and R. E. Marquis, in Regulation of Procaryotic Development, edited by I. Smith, R. A. Slepecky, and P. Setlow (American Society of Microbiology, Washington, DC, 1989), pp. 43–63.
- 2 P. Setlow, J. Appl. Microbiol. 101, 514–525 (2006).
- 3 P. Mafart, I. Leguérinel, O. Couvert, and L. Coroller, Food Microbiol. 27, 568–572 (2010).
- 4 R. T. Eijlander, T. Abee, and O. P. Kuipers, Curr. Opin. Biotechnol. 22, 180–186 (2011).
- 5 A. E. Cowan, E. M. Olivastro, D. E. Koppel, C. A. Loshon, B. Setlow, and P. Setlow, Proc. Natl. Acad. Sci. U.S.A. 101, 7733–7738 (2004).
- 6 E. P. Sunde, P. Setlow, L. Hederstedt, and B. Halle, Proc. Natl. Acad. Sci. U.S.A. 106, 19334–19339 (2009).
- 7 D. L. Popham, Cell Mol. Life Sci. 59, 426–433 (2002).
- 8 A. Driks, Microbiol. Mol. Biol. Rev. 63, 1–20 (1999).
- 9 A. O. Henriques and C. P. Moran Jr., Methods 20, 95–110 (2000).
- 10 S. Nakashio and P. Gerhardt, J. Bacteriol. 162, 571–578 (1995).
- 11 T. C. Beaman and P. Gerhardt, Appl. Environ. Microbiol. 52, 1242–1246 (1986).
- 12 G. W. Gould, in Membranes, Metabolism, and Dry Organisms, edited by A. C. Leopold (Cornell University Press, Ithaca, NY, USA, 1986), pp. 143–156.
- 13 V. Sapru and T. P. Labuza, J. Food Sci. 58, 445–448 (1993).
- 14 S. Ablett, A. H. Darke, P. J. Lillford, and D. R. Martin, Int. J. Food Sci. Technol. 34, 59–69 (1999).
- 15 E. L. Carstensen, R. E. Marquis, S. Z. Child, and G. R. Bender, J. Bacteriol. 140, 917–928 (1979).
- 16 K. Johnstone, G. S. A. B. Stewart, M. D. Barratt, and D. J. Ellar, Biochim. Biophys. Acta 714, 379–381 (1982).
- 17 R. G. K. Leuschner and P. J. Lillford, Microbiology 146, 49–55 (2000).
- 18 A. E. Cowan, D. E. Koppel, B. Setlow, and P. Setlow, Proc. Natl. Acad. Sci. U.S.A. 100, 4209–4214 (2003).
- 19 S. H. Black and P. Gerhardt, J. Bacteriol. 83, 960–967 (1962).
- 20 B. J. Marshall and W. G. Murrell, J. Appl. Microbiol. 33, 103–129 (1970).
- 21 R. G. K. Leuschner and P. J. Lillford, Int. J. Food Microbiol. 80, 131–143 (2003).
- 22 M. L. Stecchini, M. Del Torre, E. Venir, A. Morettin, P. Furlan, and E. Maltini, Int. J. Food Microbiol. 106, 286–290 (2006).
- 23 Y. Maeda, T. Fujita, Y. Sugiura, and S. Koga, J. Gen. Appl. Microbiol. 14, 217–226 (1968).
- 24 J. H. Bradbury, J. R. Foster, B. Hammer, J. Lindsay, and W. G. Murrell, Biochim. Biophys. Acta 678, 157–164 (1981).
- 25 Y. P. de Vries, Bacillus cereus spore formation, structure, and germination, PhD thesis, Wageningen University, Wageningen, the Netherlands (2006).
- 26 C. V. Rice, A. Friedline, K. Johnson, M. M. Zachariah, and K. J. Thomas III, in Instruments, Methods, and Missions for Astrobiology XIV, edited by R. B. Hoover, P. C. W. Davies, G. V. Levin, and A. Yu. Rozanov, Proc. SPIE 8152, 81520V (2011).
- 27 E. Melly, P. C. Genest, M. E. Gilmore, S. Little, D. L. Popham, A. Driks, and P. Setlow, J. Appl. Microbiol. 92, 1105–1115 (2002).
- 28 B. Setlow and P. Setlow, J. Bacteriol. 178, 3486–3495 (1996).
- 29 M. Paidhungat, B. Setlow, A. Driks, and P. Setlow, J. Bacteriol. 182, 5505–5512 (2000).
- 30 A. C. Granger, E. K. Gaidamakova, V. Y. Matrosova, M. J. Daly, and P. Setlow, Appl. Environ. Microbiol. 77, 32–40 (2011).
- 31 W. L. Nicholson and P. Setlow, in Molecular Biological Methods for Bacillus, edited by C. R. Harwood and S. M. Cutting (John Wiley and Sons, Chichester, NY, USA, 1990), pp. 391–450.
- 32 H. Fairhead, B. Setlow, W. M. Waites, and P. Setlow. Appl. Environ. Microbiol. 60, 2647–2649 (1994).
- 33 J. R. Zimmerman and W. E. Brittin, J. Phys. Chem. 61, 1328–1333 (1957).
- 34 L. Kong, P. Setlow, and Y.-Q. Li, Anal. Chem. 85, 7094–7101 (2013).
- 35 A. Atrih and S. J. Foster, J. Appl. Microbiol. 91, 364–372 (2001).
- 36 S. H. Koenig and R. D. Brown III, J. Magn. Reson. 61, 426–439 (1985).
- 37 I. Bertini, C. Luchinat, and G. Parigi, Adv. Inorg. Chem. 57, 105–172 (2005).
- 38 E. Persson and B. Halle, Proc. Natl. Acad. Sci. U.S.A. 105, 6266–6271 (2008).
- 39 M. G. Usha and R. J. Wittebort, J. Mol. Biol. 208, 669–678 (1989).
- 40 M. G. Usha, J. Speyer, and R. J. Wittebort, Chem. Phys. 158, 487–500 (1991).
- 41 K. Venu, L. A. Svensson, and B. Halle, Biophys. J. 77, 1074–1085 (1999).
Supporting material
| N23 | N37 | N43 | Mn | |
|---|---|---|---|---|
| Ca | 760 | 800 | 830 | 960 |
| Fe | 0.64 | 0.20 | 0.60 | 1.0 |
| K | 100 | 78 | 104 | 95 |
| Mg | 87 | 104 | 88 | 148 |
| Mn | ||||
| Si | 11 | 1.8 | 21 | 17 |
| Zn |
-
a
When given, uncertainties represent one standard deviation. When not given, the analysis is less accurate.
| N23 | N37 | N43 | Mn | |
|---|---|---|---|---|
| Ala | 12.0 | 11.4 | 11.0 | 11.3 |
| Arg | 5.1 | 5.2 | 5.1 | 5.2 |
| Asxa | 8.9 | 9.0 | 9.0 | 8.5 |
| Cysb | (0.8) | (0.8) | (0.8) | (0.8) |
| Glxc | 13.2 | 12.9 | 12.5 | 12.6 |
| Gly | 11.0 | 11.7 | 11.8 | 11.2 |
| His | 2.7 | 2.9 | 2.8 | 2.8 |
| Ile | 3.7 | 3.7 | 3.6 | 3.6 |
| Leu | 5.3 | 5.2 | 5.2 | 5.0 |
| Lys | 6.0 | 6.1 | 6.6 | 6.4 |
| Met | 1.5 | 0.5 | 0.4 | 1.6 |
| Phe | 4.4 | 4.5 | 4.4 | 4.4 |
| Pro | 3.6 | 3.1 | 3.1 | 3.6 |
| Ser | 6.1 | 6.5 | 6.8 | 6.6 |
| Thr | 4.3 | 4.4 | 4.4 | 4.3 |
| Trpb | (1.0) | (1.0) | (1.0) | (1.0) |
| Tyr | 5.1 | 5.7 | 6.3 | 5.8 |
| Val | 5.4 | 5.3 | 5.4 | 5.2 |
-
a
Asx = Asn + Asp.
-
b
See Table S3 in Ref. 6.
-
c
Glx = Gln + Glu.